

MANTRA Launches With 37% Rally Following OM Token Swap
Mantra (MANTRA) has seen an impressive 37% rally following its recent launch, with the token quickly gaining attention from investors. After completing the OM token swap at a 1:4 ratio, the altcoin has experienced a strong market response.
As of today, MANTRA is already up significantly, signaling positive momentum for the cryptocurrency.
OM Token Swap Completes
On Tuesday, the Mantra team announced the completion of the OM token swap, exchanging 1 OM for 4 MANTRA tokens. The new token launched today on major centralized exchanges (CEXs), including Binance.
With a total supply of 7.055 billion MANTRA tokens, only 67.51% of the supply, or about 4.763 billion tokens, is currently in circulation. The launch and swap have been well-received by investors, and the availability of MANTRA on Binance adds credibility and liquidity to the new altcoin.
Want more token insights like this? Sign up for Editor Harsh Notariya’s Daily Crypto Newsletter here.
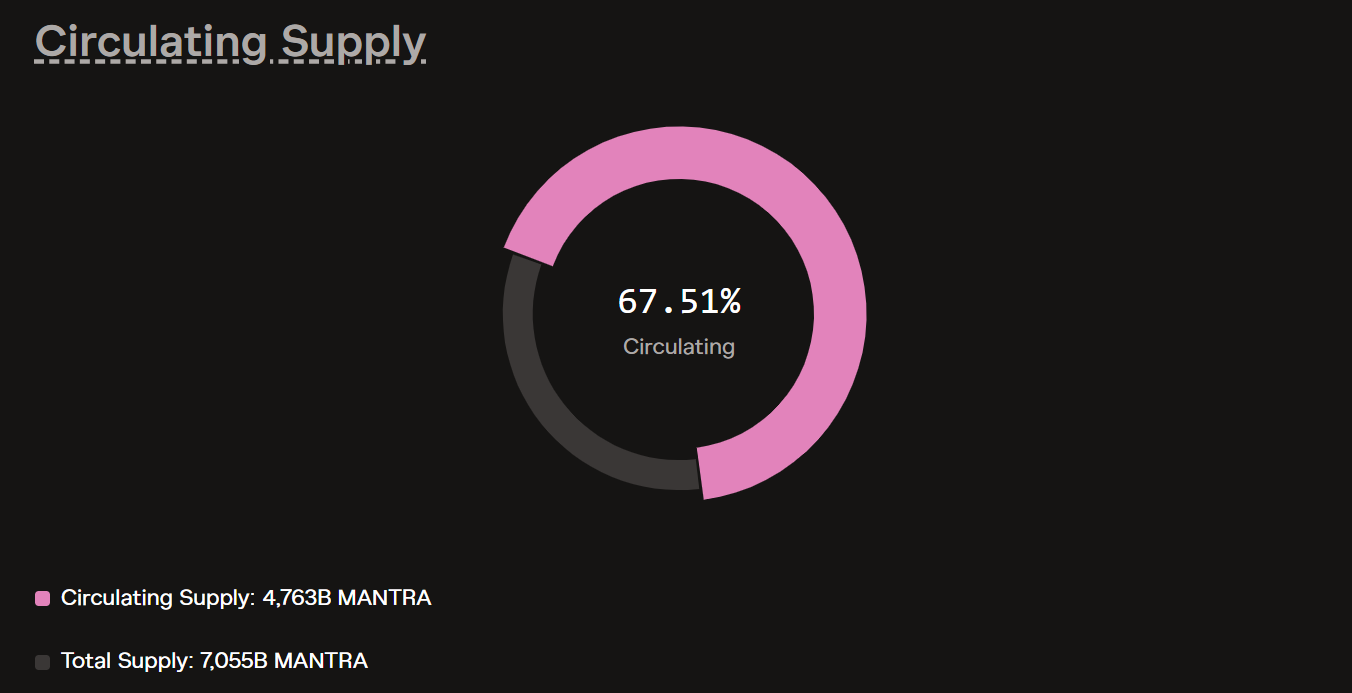 MANTRA Token Allocation. Source: Mantra Dashboard
The Mantra launch is supported by consistent buying pressure, as reflected in the Money Flow Index (MFI). Although the MFI did experience a slight dip in bullish momentum, it quickly regained pace as demand continued to drive the price upward. This suggests that investor interest in MANTRA remains high, which is essential for maintaining a positive price trajectory in the early stages of the coin’s launch.
However, the MFI also highlights that consistent bullish momentum is still needed for a sustainable rally. While the altcoin’s early performance is strong, it will require ongoing support from both retail and institutional investors to maintain its momentum and avoid a potential market reversal.
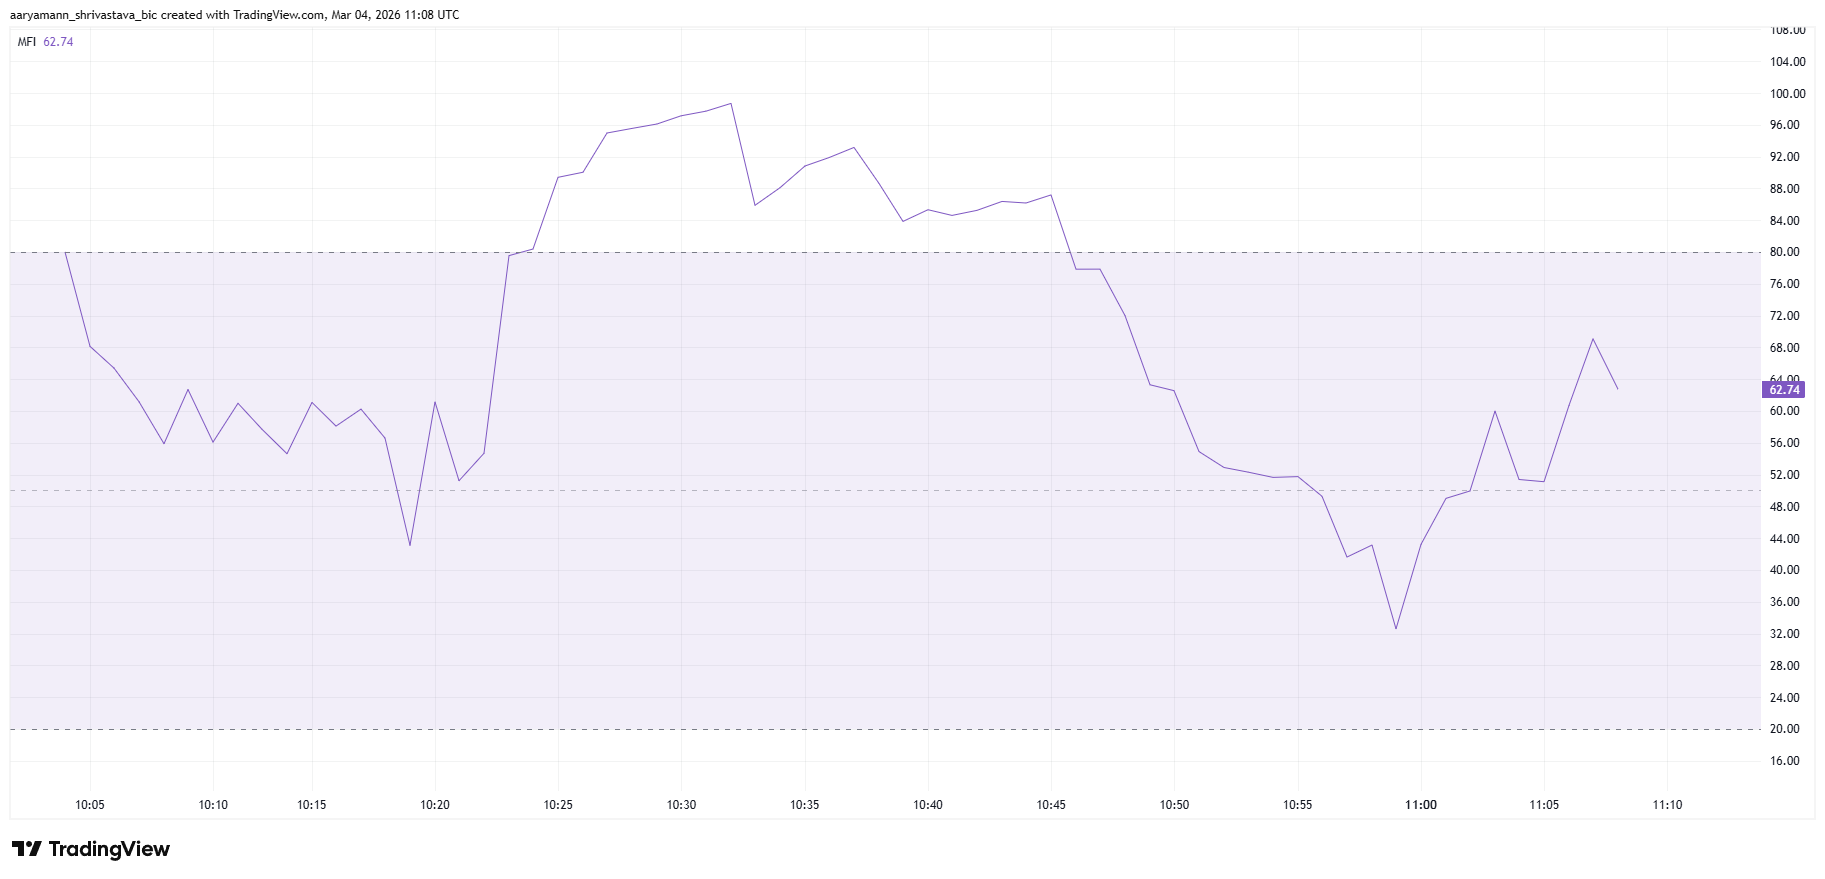 MANTRA MFI. Source: TradingView
MANTRA Price Rise Continues
Currently, MANTRA is trading at $0.023, up 37% from its launch price. The token’s price has seen strong early gains, but trading volume shows a slow decline in buying momentum. While the initial rally has been positive, a continued decline in volume could limit future growth.
But if bullish momentum resurges, MANTRA could surpass the $0.024 level and test resistance at $0.026, which aligns with the 123.6% Fibonacci extension line. This would signal a continuation of the bullish trend and may open the door to further gains.
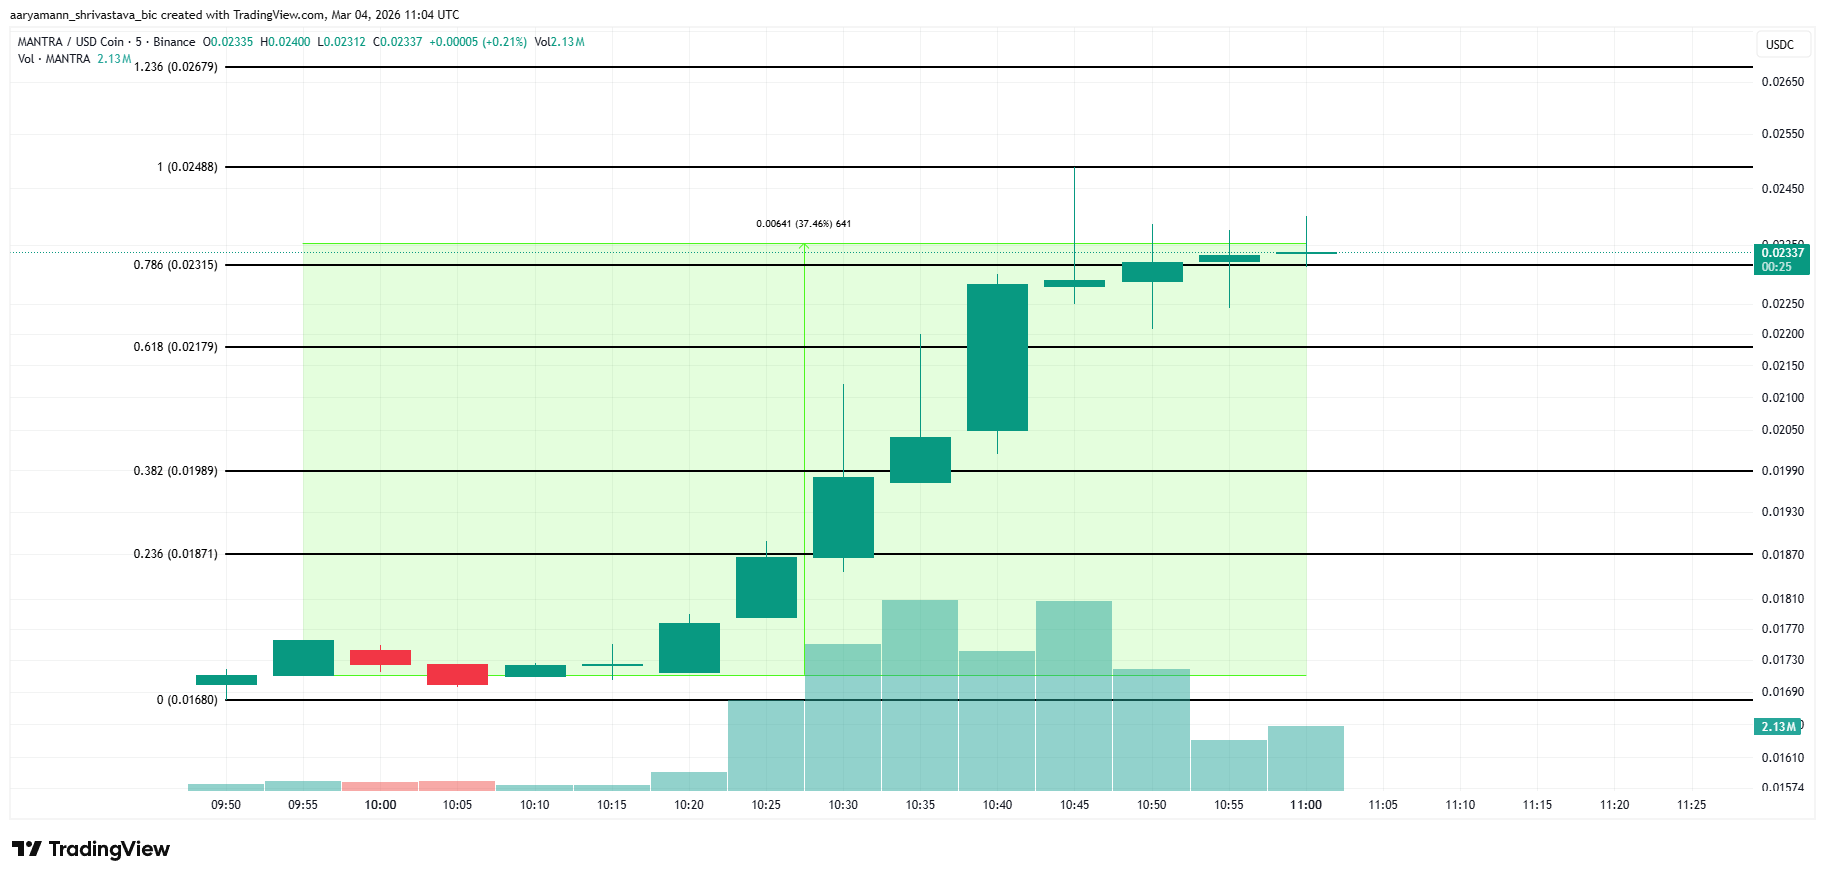 MANTRA Price Analysis. Source: TradingView
On the flip side, if the buying pressure weakens or if investors who swapped OM for MANTRA decide to sell, the token could face a pullback. A decline below the $0.021 support level would suggest further downside risk. This could send the price potentially falling to $0.0198, testing a lower support range.
Recommended Articles


