Ethereum ICO Whale Sells 20,000 ETH ($58M), Raising Questions Over Market Timing

Source Newsbtc

Ethereum continues to trade below the critical $3,000 level as selling pressure intensifies and fear dominates sentiment across the crypto market. The broader downturn has pushed ETH nearly 40% below its August all-time high, raising concerns that the asset may be entering a prolonged bearish phase. Analysts who were once confident in a continued rally are now shifting their tone, warning that market structure, volatility, and liquidity conditions are beginning to resemble early-stage bear market behavior.

At the same time, investor confidence is being further tested by fresh on-chain activity showing large holders reducing exposure. According to data from Lookonchain, an Ethereum ICO participant has sold another 20,000 ETH, valued at approximately $58.14 million, through FalconX just a few hours ago.
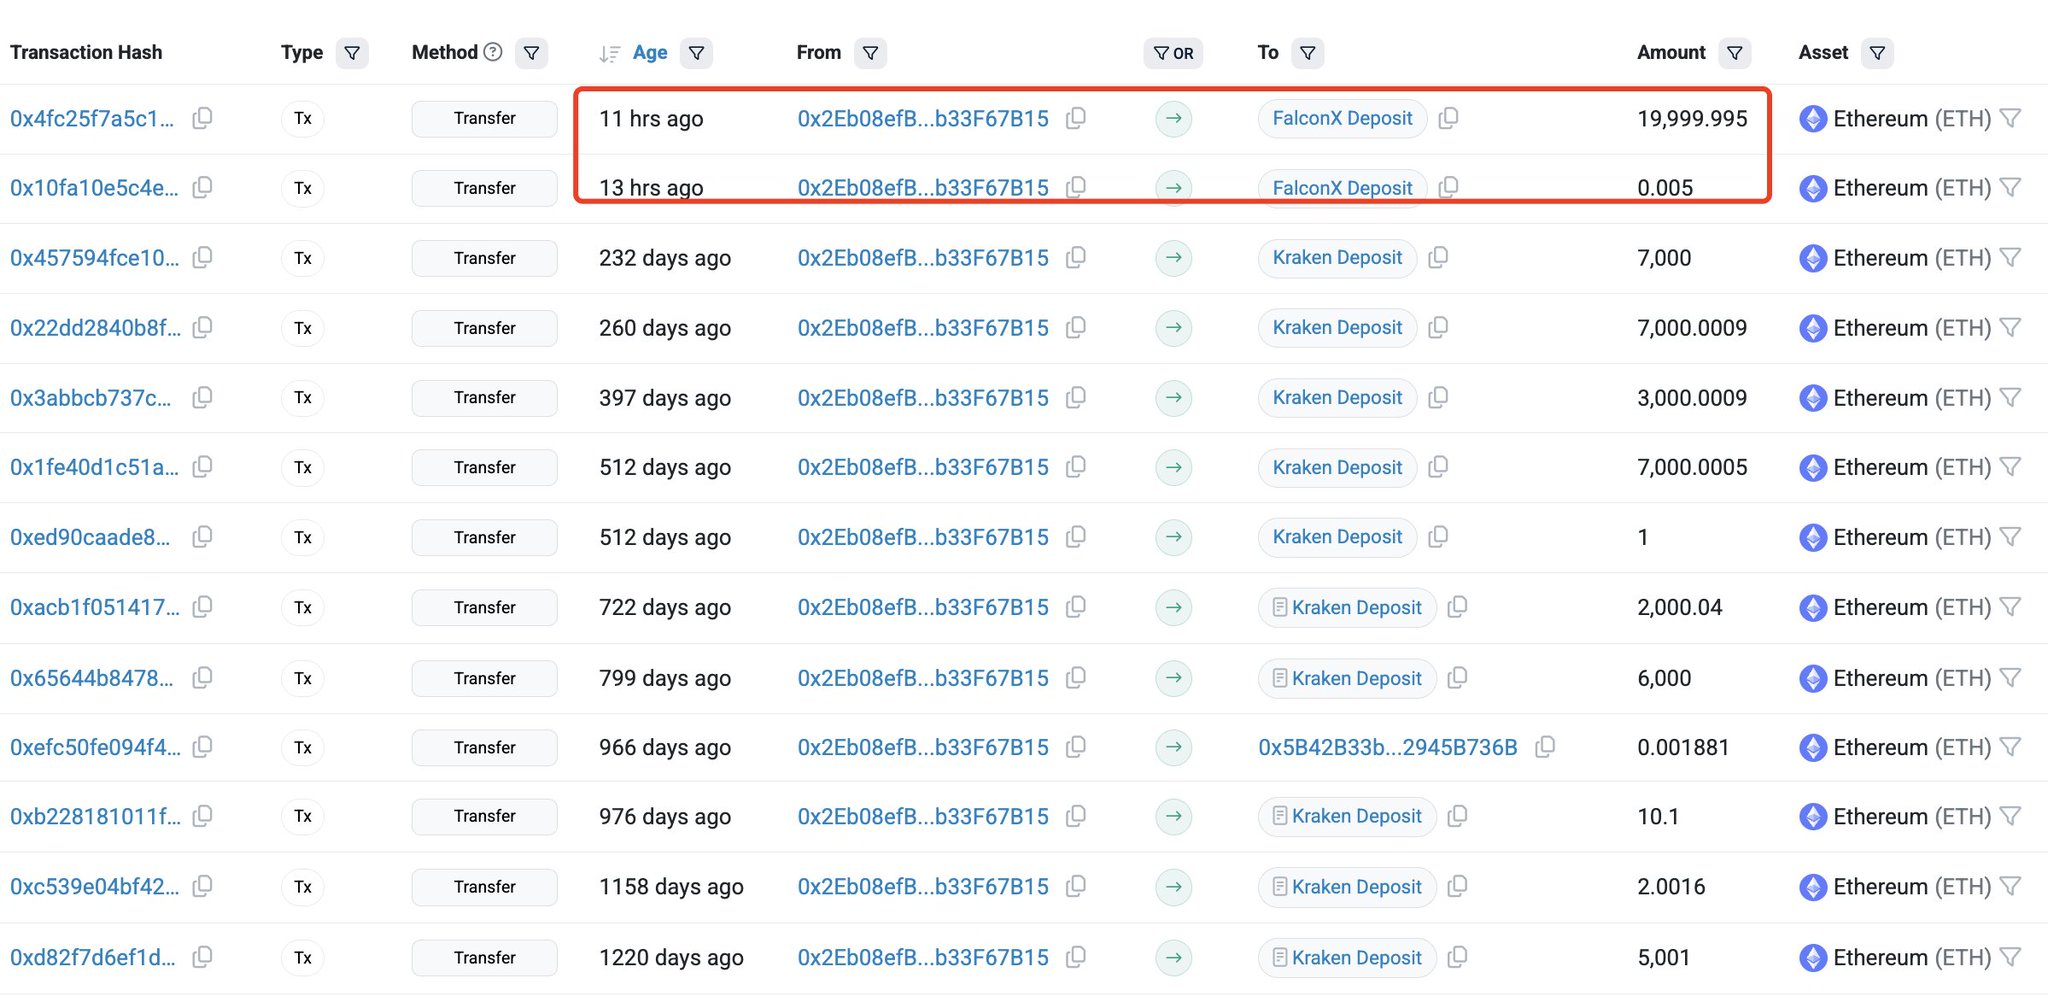
Ethereum ICO Whale Transactions | Source: Lookonchain

With selling pressure accelerating, derivatives sentiment weakening, and long-term holders beginning to reduce positions, Ethereum now sits at a pivotal moment. Bulls must reclaim the $3,000 region to stabilize momentum, while bears argue that a deeper correction could unfold if support continues to erode.

ICO Whale Selling Raises Pressure as Ethereum Awaits Direction

According to Lookonchain, the wallet behind the latest sale — identified as address 0x2eb0 — is no ordinary holder. This Ethereum OG received 254,908 ETH during the ICO, paying just $79,000 at the time. At today’s prices, that allocation is worth roughly $757 million, highlighting the scale of unrealized gains still held by early participants. The recent sale of 20,000 ETH suggests that even long-standing holders with substantial profit cushions are beginning to offload coins, adding to the already fragile market environment.
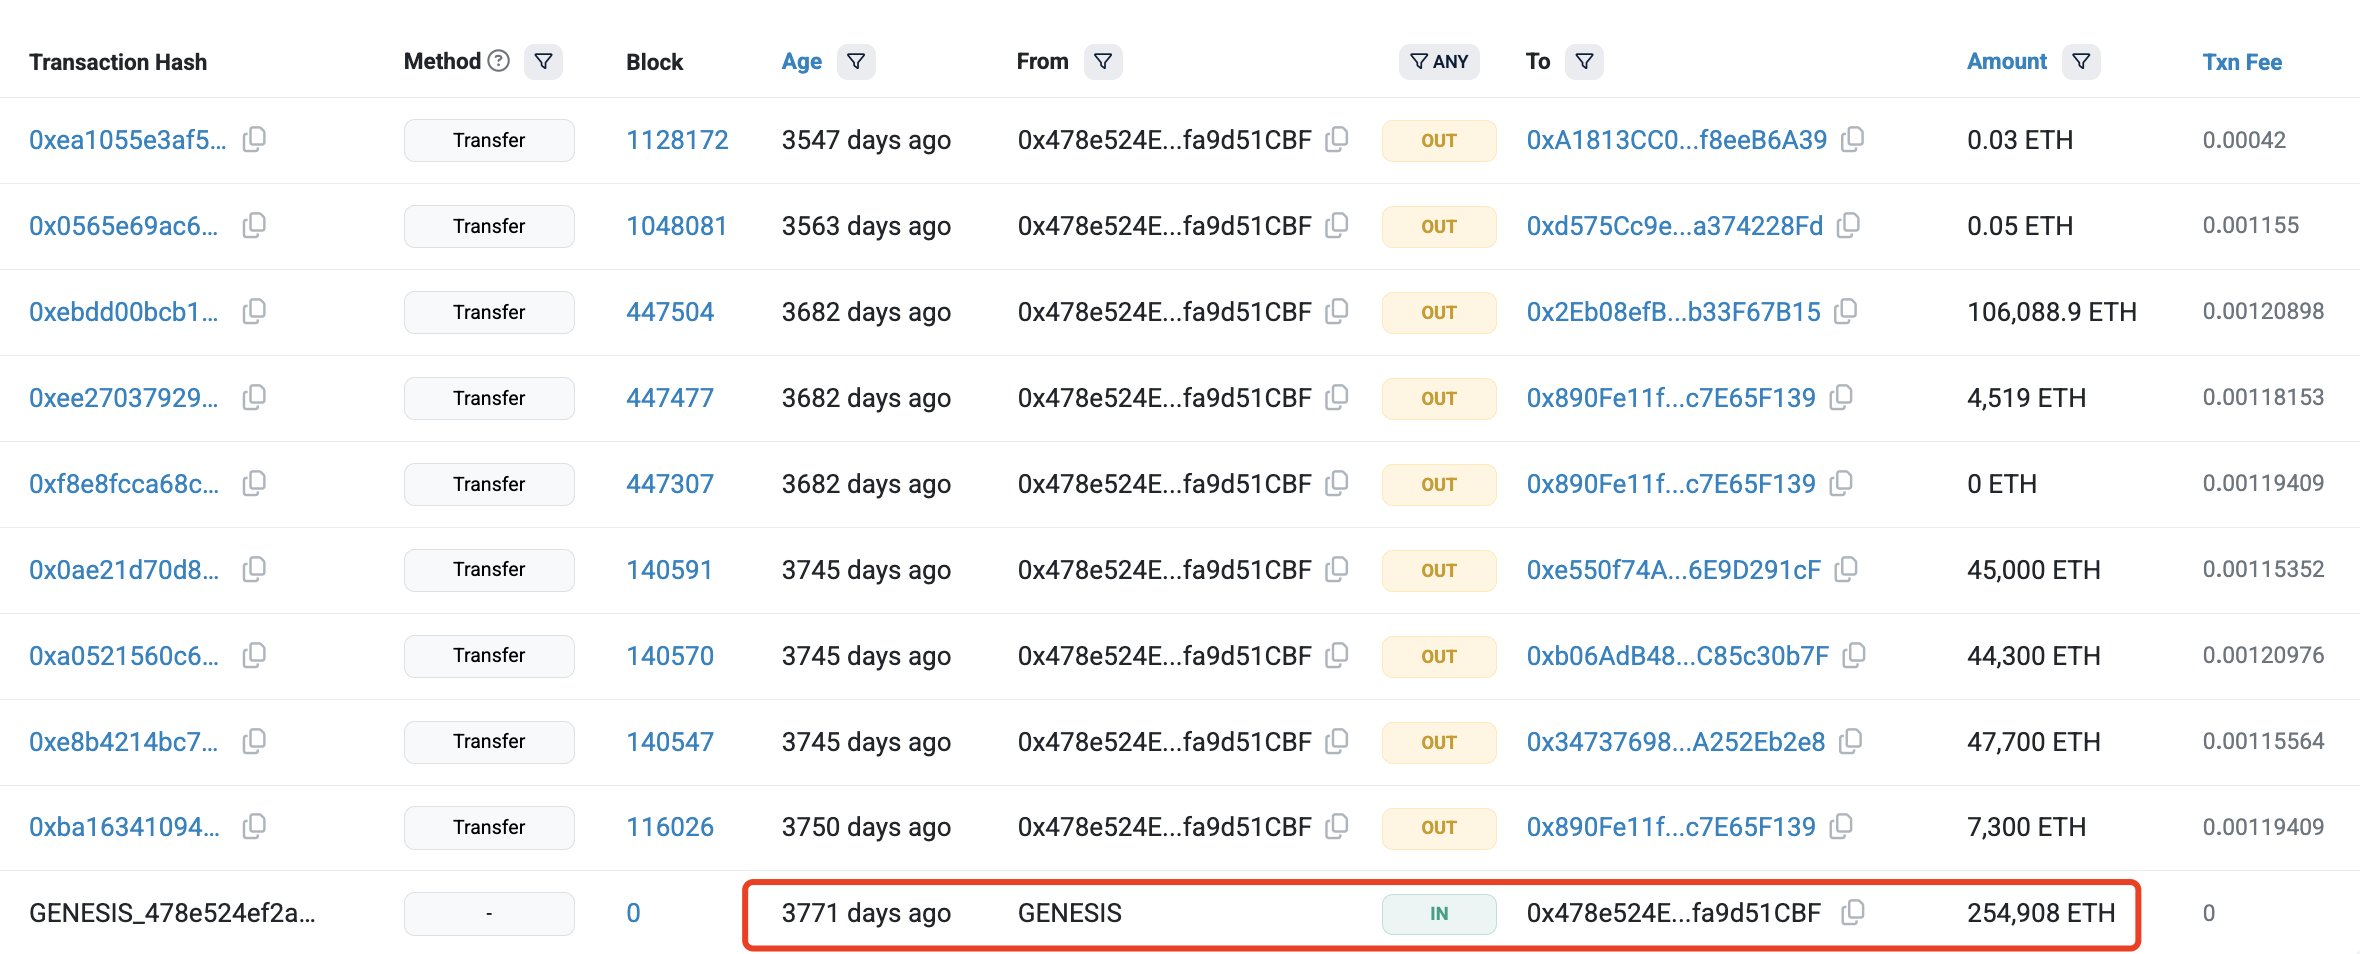
Ethereum ICO Whale original holdings | Source: Lookonchain

This selling activity is particularly impactful given the current sentiment. Ethereum has already fallen sharply from its highs, leverage has unwound across derivatives markets, and retail confidence has thinned. When an early participant with a cost basis near zero begins distributing, it sends a psychological signal that further downside is possible. Yet, some analysts argue that these sales may simply represent portfolio rotation rather than a long-term bearish stance.

The coming days will be decisive, as investors watch whether Ethereum can stabilize and rebound or if selling pressure accelerates. A recovery above $3,000 could revive optimism and reset momentum, while continued weakness risks confirming a deeper downtrend for both ETH and the broader market.

Breakdown, Weak Structure, and Fragile Bounce Attempt

Ethereum’s weekly chart reveals a clear deterioration in trend structure following the sharp rejection from the $4,400 region and the subsequent breakdown below the $3,200 support zone. The selloff pushed ETH toward the mid-$2,700s before a modest rebound, but the price remains below key moving averages, signaling that momentum continues to favor sellers.

ETH testing key demand level | Source: ETHUSDT chart on TradingView

The 50-week moving average has rolled over, while the 100-week and 200-week moving averages now sit overhead, forming layered resistance that could cap any recovery attempts in the short term.

Volume during the decline expanded noticeably, indicating active distribution rather than passive drifting. The most recent candle shows a small bounce, but with no strong volume follow-through, suggesting hesitation and lack of conviction among buyers.

For Ethereum to regain bullish structure, reclaiming the $3,000–$3,200 area is essential, as this zone acted as a pivotal support throughout earlier phases of the cycle and now threatens to flip into resistance.

Featured image from ChatGPT, chart from TradingView.com

Disclaimer: For information purposes only. Past performance is not indicative of future results.
placeholder
Gold Price Forecast: XAU/USD declines below $4,050 on USD strength and hawkish Fed comments Gold price (XAU/USD) extends the decline to around $4,030 during the early Asian session on Tuesday. The precious metal edges lower as traders dialed back expectations of a US interest rate cut next month.
Author  FXStreet
Nov 18, Tue
Gold price (XAU/USD) extends the decline to around $4,030 during the early Asian session on Tuesday. The precious metal edges lower as traders dialed back expectations of a US interest rate cut next month.
placeholder
2025 Black Friday is coming! Which stocks may see volatility?Coming on the day right after Thanksgiving in the United States, Back Friday marks the start of the holiday shopping season. Sales data from this shopping frenzy day reflects investor confidence and consumer trends. The National Retail Federation (NRF) predicts that holiday season (Nov and Dec) retail sales in 2025 will likely exceed $1 trillion for the very first time, which represents a year-over-year increase of 3.7 to 4.2 percent. Historic data from the past decade show that the retail sector has generally outperformed the S&P 500 during the weeks before and after Black Friday. The following retailing companies are expected to be big winners:
Author  Insights
Nov 24, Mon
Coming on the day right after Thanksgiving in the United States, Back Friday marks the start of the holiday shopping season. Sales data from this shopping frenzy day reflects investor confidence and consumer trends. The National Retail Federation (NRF) predicts that holiday season (Nov and Dec) retail sales in 2025 will likely exceed $1 trillion for the very first time, which represents a year-over-year increase of 3.7 to 4.2 percent. Historic data from the past decade show that the retail sector has generally outperformed the S&P 500 during the weeks before and after Black Friday. The following retailing companies are expected to be big winners:
placeholder
Bitcoin Bleeds to $86K, But This Key Indicator Screams "The Top Isn't In"Bitcoin’s adjusted Spent Output Profit Ratio (aSOPR) has spent nearly two years coiling below the extremes seen at past bull-market peaks, even as BTC trades around $86,300 and down 9% on the week — a setup that leaves open the possibility that this cycle’s true top may still lie ahead.
Author  Mitrade
Nov 25, Tue
Bitcoin’s adjusted Spent Output Profit Ratio (aSOPR) has spent nearly two years coiling below the extremes seen at past bull-market peaks, even as BTC trades around $86,300 and down 9% on the week — a setup that leaves open the possibility that this cycle’s true top may still lie ahead.
placeholder
NZD/USD jumps above 0.5650 as RBNZ cuts OCR to 2.25%The NZD/USD pair climbs to near 0.5665 during the early Asian session on Wednesday. The New Zealand Dollar (NZD) strengthens against the US Dollar (USD) following the Reserve Bank of New Zealand (RBNZ) interest rate decision. 
Author  FXStreet
23 hours ago
The NZD/USD pair climbs to near 0.5665 during the early Asian session on Wednesday. The New Zealand Dollar (NZD) strengthens against the US Dollar (USD) following the Reserve Bank of New Zealand (RBNZ) interest rate decision. 
placeholder
Bitcoin Price Rebound Gains Traction with $90K Break in SightBitcoin is trading above $87,000 and its 100-hour SMA after rebounding from $83,500, with a bearish trend line at $88,200 and resistance at $89,000–$90,000 now in focus as BTC either breaks higher toward $91,750–$94,000 or slips back toward $86,700, $85,000 and lower supports.
Author  Mitrade
22 hours ago
Bitcoin is trading above $87,000 and its 100-hour SMA after rebounding from $83,500, with a bearish trend line at $88,200 and resistance at $89,000–$90,000 now in focus as BTC either breaks higher toward $91,750–$94,000 or slips back toward $86,700, $85,000 and lower supports.
goTop
quote