

Why Ethereum May Have Successfully Bottomed at the $2,800 Support Zone
Ethereum (ETH) briefly dropped to near $2,870 on November 19, its lowest point since July, after the release of Federal Reserve minutes raised market uncertainty.
Despite the pullback, on-chain indicators and analyst insights suggest that the second-largest cryptocurrency may be forming a potential bottom.
Federal Reserve Minutes Ignite Market Volatility
The sharp decline in Ethereum was triggered by the Federal Reserve’s October 28–29 meeting minutes. It introduced significant uncertainty about December’s policy outlook.
The document showed a slim majority of Fed officials against a December rate cut, while others suggested it “could well be appropriate.”
This divided stance sparked volatility across both traditional and cryptocurrency markets. Bitcoin slid to a seven-month low, and Ethereum reached near $2,870.
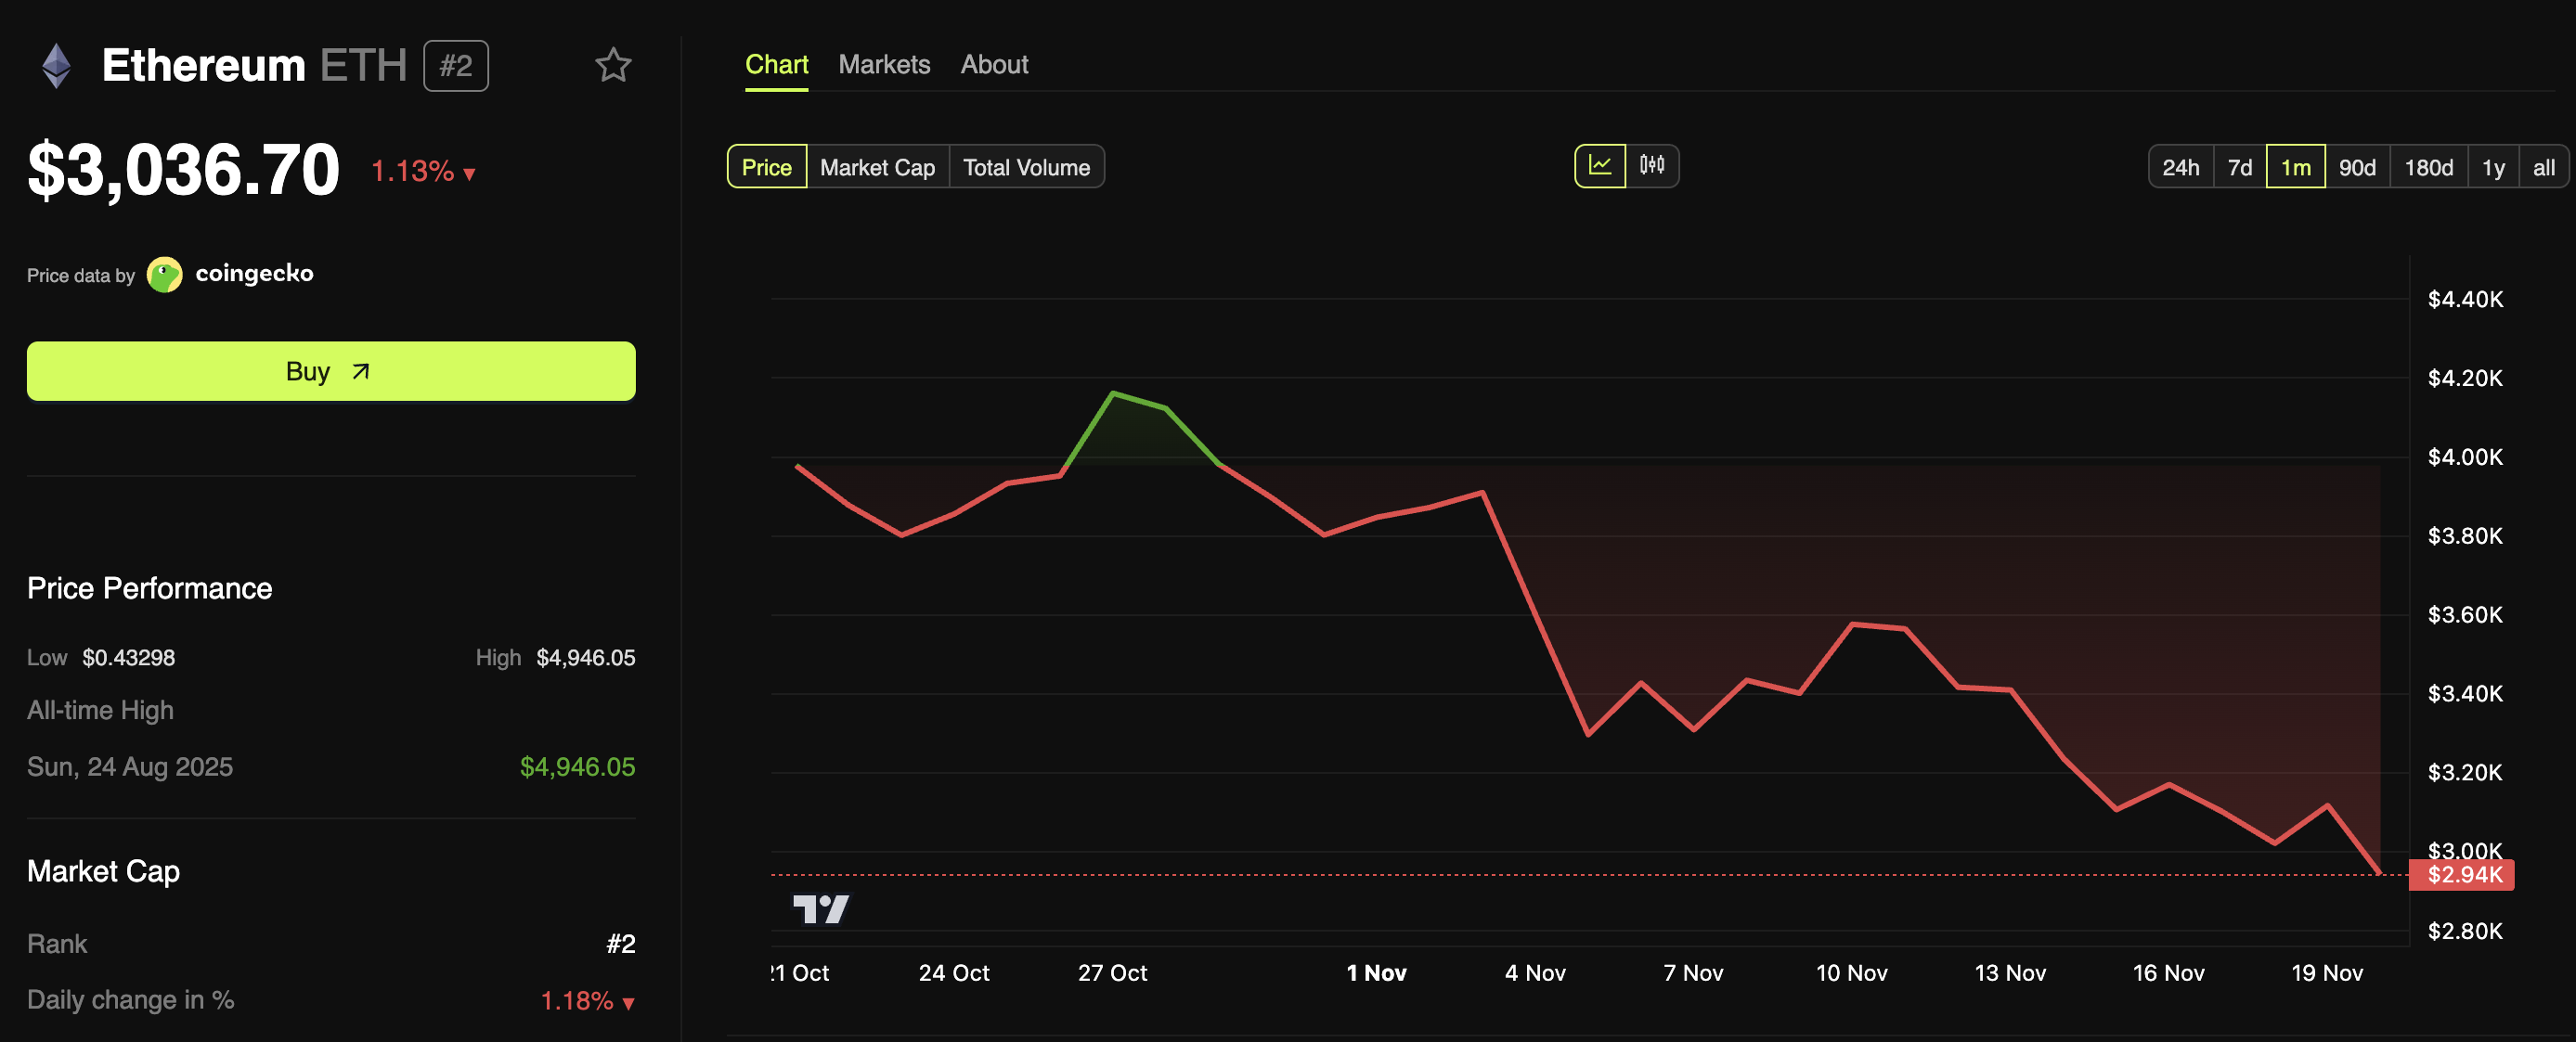 Ethereum (ETH) Price Performance. Source: BeInCrypto Markets
At the time of writing, it had recovered to $3,036. It was still down 1.13% over the past day. But the worst may be over for the coin.
On-Chain Data Highlights Strong $2,800 Support
Insights from an analyst identify the $2,800 area as strong on-chain support. This level aligns with realized price clusters for both retail traders and whales, which have often marked previous market bottoms.
“Historically, realized price levels have often marked cycle bottoms, suggesting that this range could once again provide a foundation for a short-term rebound,” an analyst wrote.
The analysis also revealed that retail traders are selling, while whales holding more than 10,000 ETH are buying. This usually indicates healthy redistribution.
Additionally, the amount of forced long liquidations is shrinking, meaning there’s less forced-selling pressure. At the same time, more traders are opening shorts.
This increases the chances of a short squeeze—a rapid upward move if the price bounces and shorts get liquidated in a low-liquidity market.
Technical analysts have weighed in on this support level. A trader flagged $2,800 as a critical zone for the formation of a bottom.
Analyst Matt Hughes also noted that Ethereum’s drop to roughly $2,870 represents the midpoint between its 2021 market peak and its 2022 bottom. Despite the pullback, he argues the move remains within the bounds of normal crypto-market volatility.
“If you remain objective this is still just normal volatility in crypto and yes, it is still a bullish backtest,” Hughes said.
Liquidity Reset and Market Bottoming Patterns
Altcoin Vector provided further context by examining Ethereum’s liquidity trends. Historical patterns show that when ETH liquidity fully resets, it often precedes a multi-week bottoming period rather than a breakdown.
ETH just repeated the same liquidity event that marked the last two major bottoms, almost to the week. Every major ETH reversal started with a full liquidity reset,” Milk Road added.
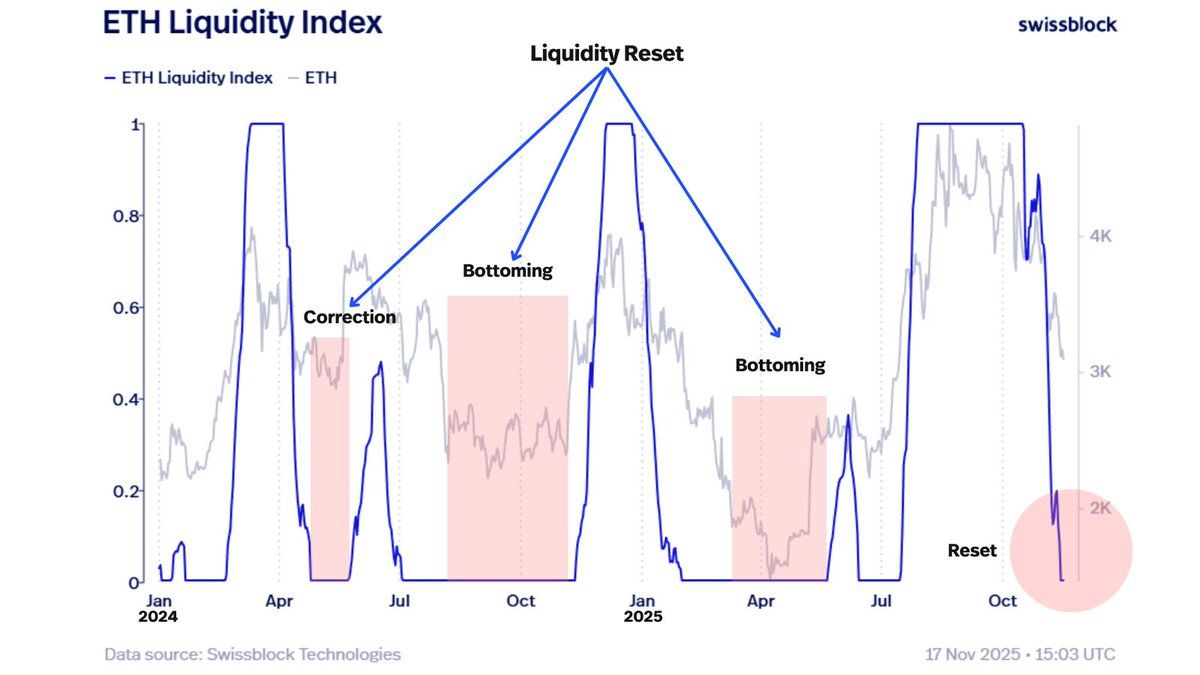 ETH Liquidity Index Indicating Full Reset at Current Levels. Source: X/Altcoin Vector
This “correction/bottoming window” is expected to remain open as long as liquidity slowly rebuilds. If it returns in the coming weeks, Ethereum could be positioned for its next expansion leg.
However, Altcoin Vector warned that a delayed recovery in liquidity increases the risk of prolonged stagnation, leaving the asset’s market structure more vulnerable.
Institutional Accumulation And Network Fundamentals
Despite turbulence in price, network fundamentals remain resilient. ETH staking hit a record high in November 2025, with over 33 million tokens now locked.
Milk Road observed that although sentiment has been weak, the high level of staked ETH indicates strong long-term confidence in the network.
“ETH staking just hit a new all time high… again. Price has been messy, and sentiment has been worse. But the one thing that hasn’t moved is the amount of ETH people are willing to lock away for years,” the post read.
At the same time, institutional accumulation is accelerating.
Corporate interest now goes beyond simply buying ETH on the open market. BlackRock is also making progress on its iShares Staked Ethereum Trust ETF.
This development could amplify long-term demand and signal a deeper institutional commitment to Ethereum’s ecosystem. Furthermore, exchange reserves decreased by over 1 million ETH over the past few months.
“This is the kind of silent supply shock that never looks bullish… until the chart violently catches up. ETH is being accumulated aggressively!” an analyst remarked.
The convergence of on-chain signals, whale accumulation, shrinking exchange reserves, and record staking paints a positive picture for Ethereum. Whether the coin moves toward a sustained recovery will hinge on any potential macroeconomic drivers and the overall market state.
Recommended Articles


