XRP Dip Buyers Are Active — So Why Is the Price Still Falling?

Source Beincrypto

XRP price is down almost 8% in the past week, and even though the last 24 hours have been flat, the absence of red cannot be mistaken for strength.

The chart and on-chain data indicate that XRP is under real pressure, despite one group of investors continuing to buy the dip.

Short-Term Holders Keep Buying — But One Group Doesn’t Agree

HODL Waves — a metric that shows how much supply each holding-duration group controls — reveals that two short-term cohorts have been steadily accumulating XRP through the month.

On October 16, wallets holding XRP for 1–3 months controlled 8.94% of supply. As of November 14, they hold 9.17%.

Another short-term cohort, the 1-week to 1-month group, has increased from 3.74% to 5.53% of the supply in the same period.

Dip Buying Remains Active
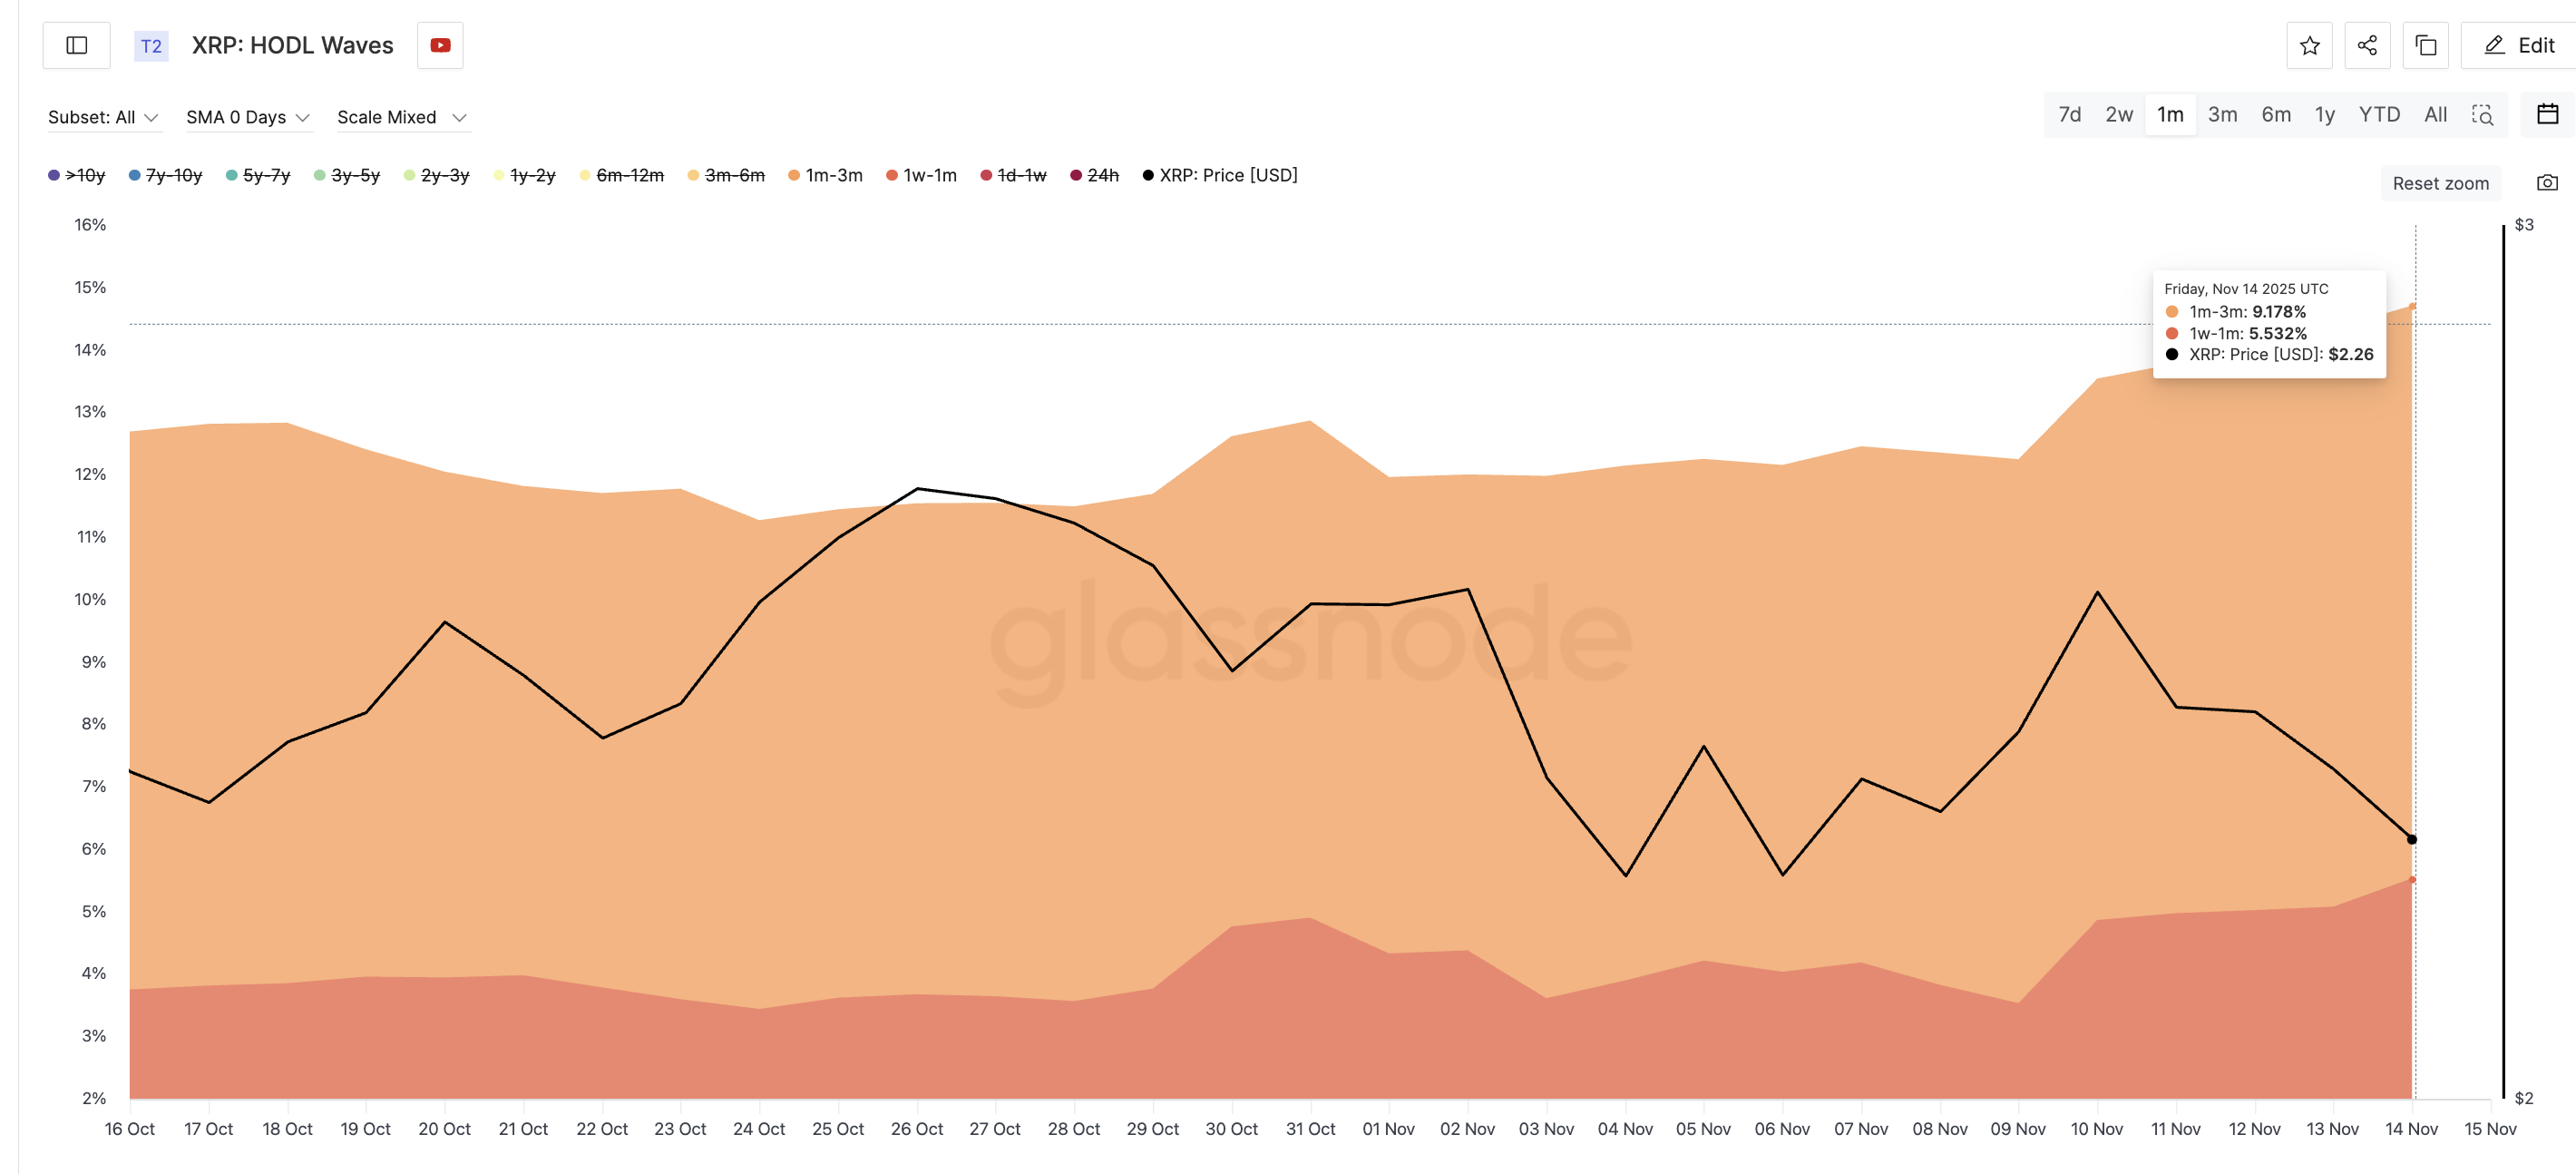
Dip Buying Remains Active: Glassnode

Want more token insights like this? Sign up for Editor Harsh Notariya’s Daily Crypto Newsletter here.

Despite the XRP price dropping 7.8% over the past 30 days, these groups are accumulating, likely positioning for short-term bounces.

But this buying doesn’t seem strong enough to lift the price for one key reason.

The Hodler Net Position Change — a metric that tracks the amount of long-term investor supply entering or leaving wallets — indicates that long-term holders are selling aggressively. It showed heavy negative flow on November 3, when long-term wallets removed 102.50 million XRP. Instead of easing, outflows continued to rise.

XRP HODLers Keep Selling
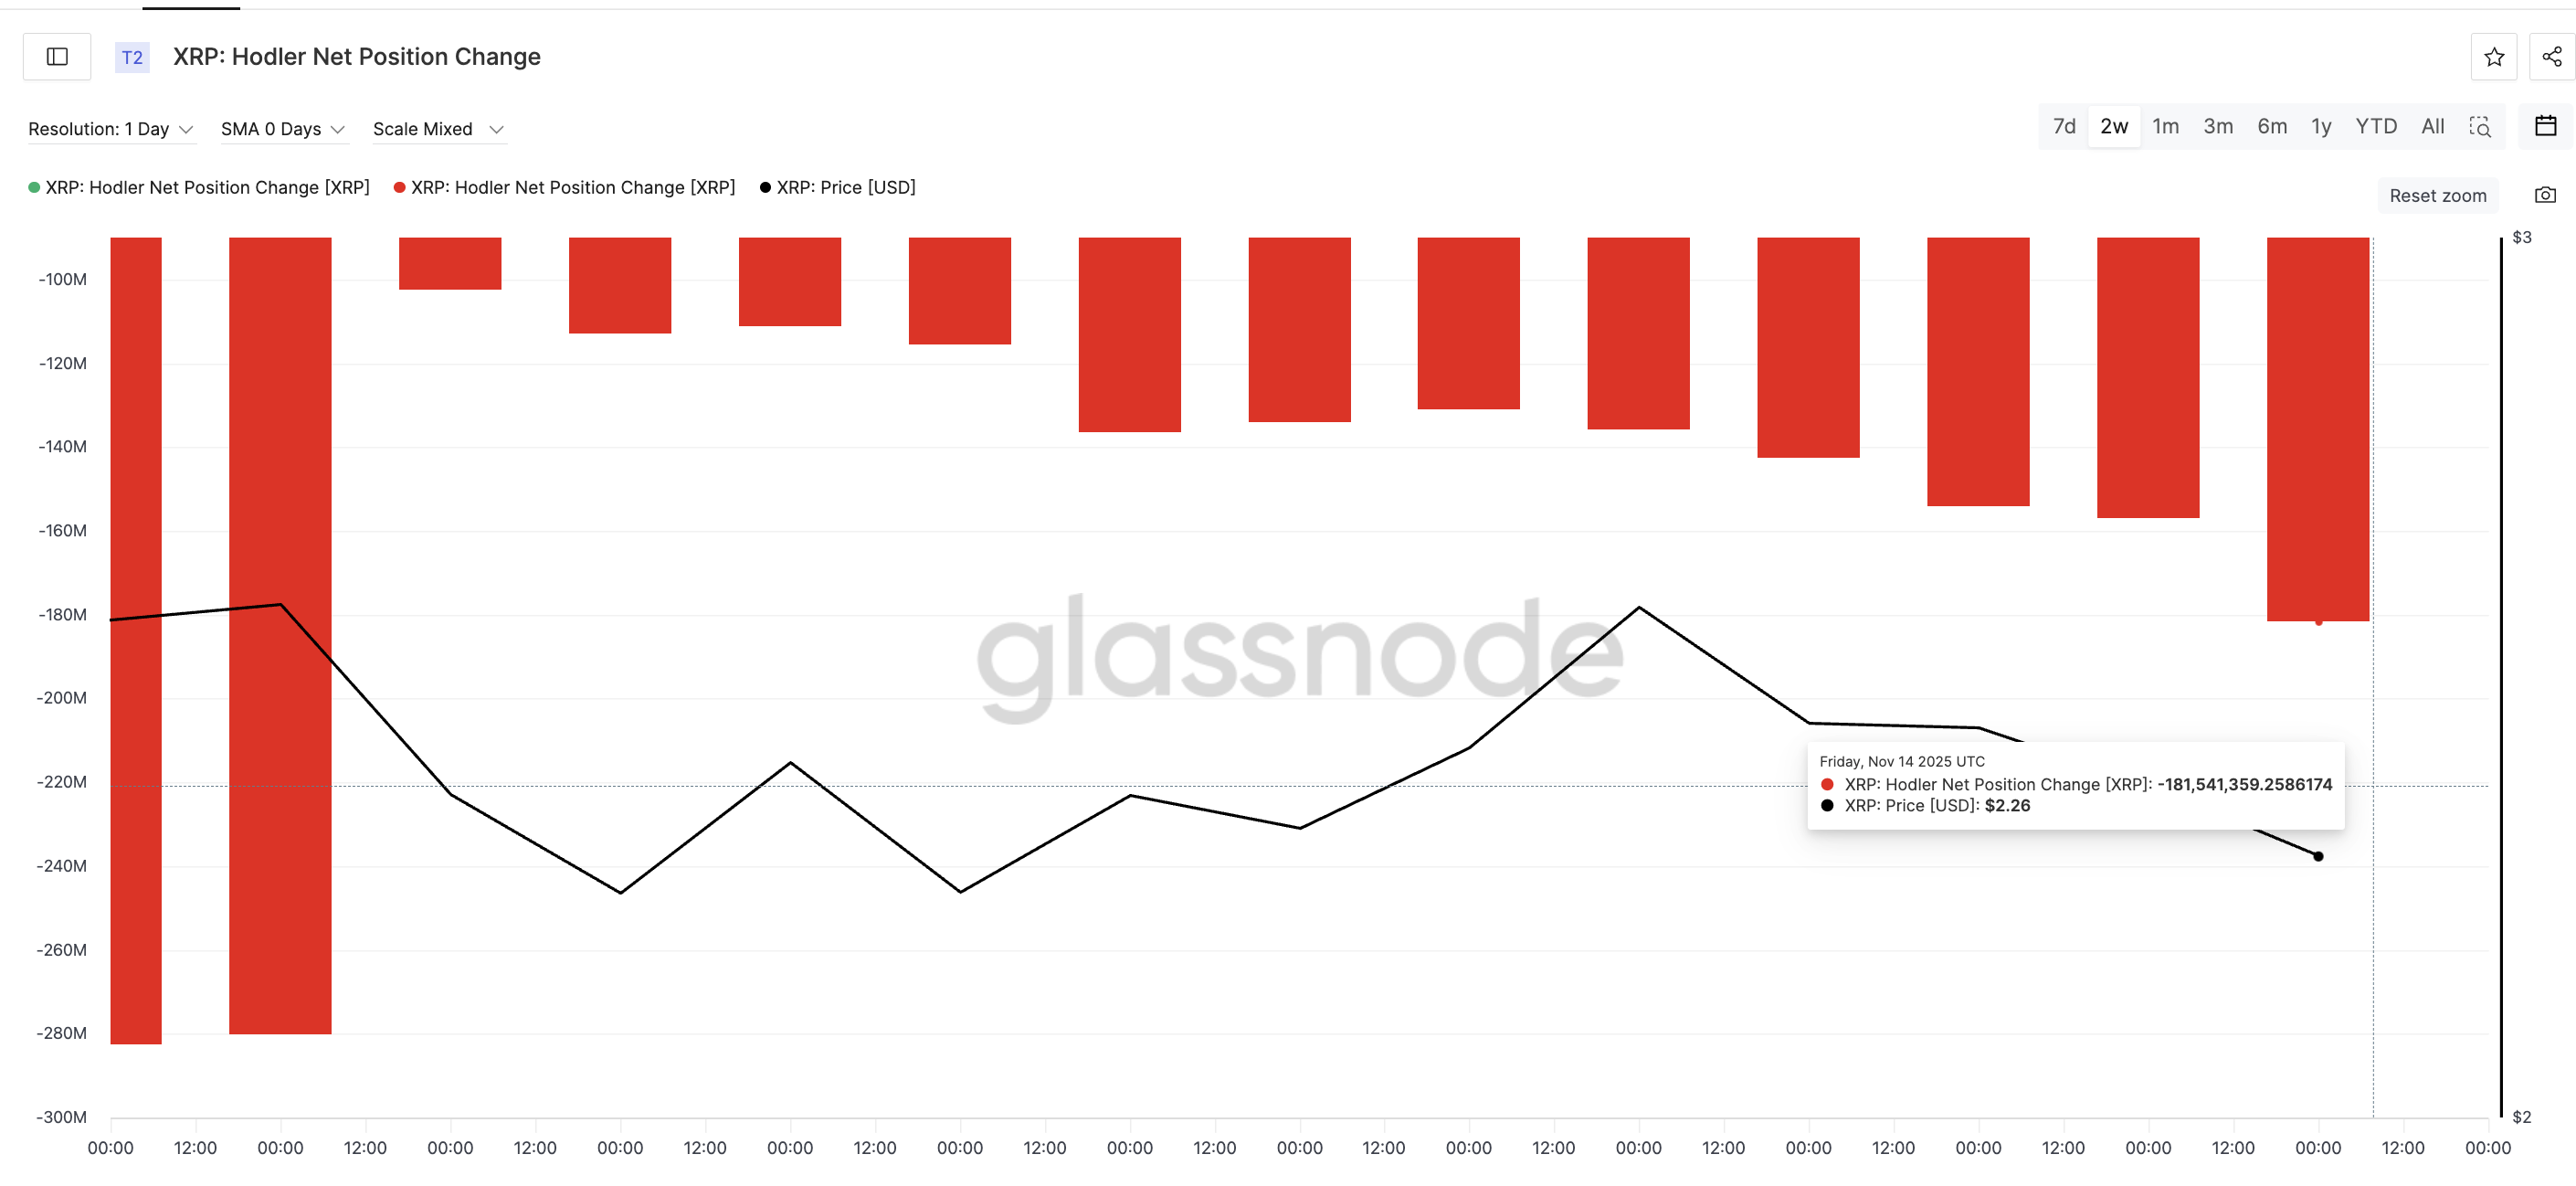
XRP HODLers Keep Selling: Glassnode

By November 14, the number had jumped to 181.50 million XRP: a 77% increase in long-term selling pressure in less than two weeks.

This is the core reason the XRP price was unable to bounce: short-term buying is being overwhelmed by long-term exits.

XRP Price Feels the Pressure as Big Money Steps Back

On the chart, XRP is still struggling to break above $2.26, a strong 0.618 Fibonacci resistance level. The push higher is weakening because money inflows are fading rapidly.

The Chaikin Money Flow (CMF) — which measures buying and selling pressure — has plunged since November 10. It now sits at –0.15, showing net outflows. CMF has also broken below a descending trendline, indicating that larger investors are withdrawing rather than adding. When CMF stays negative while breaking trend support, upside attempts usually fail.

XRP Price Analysis
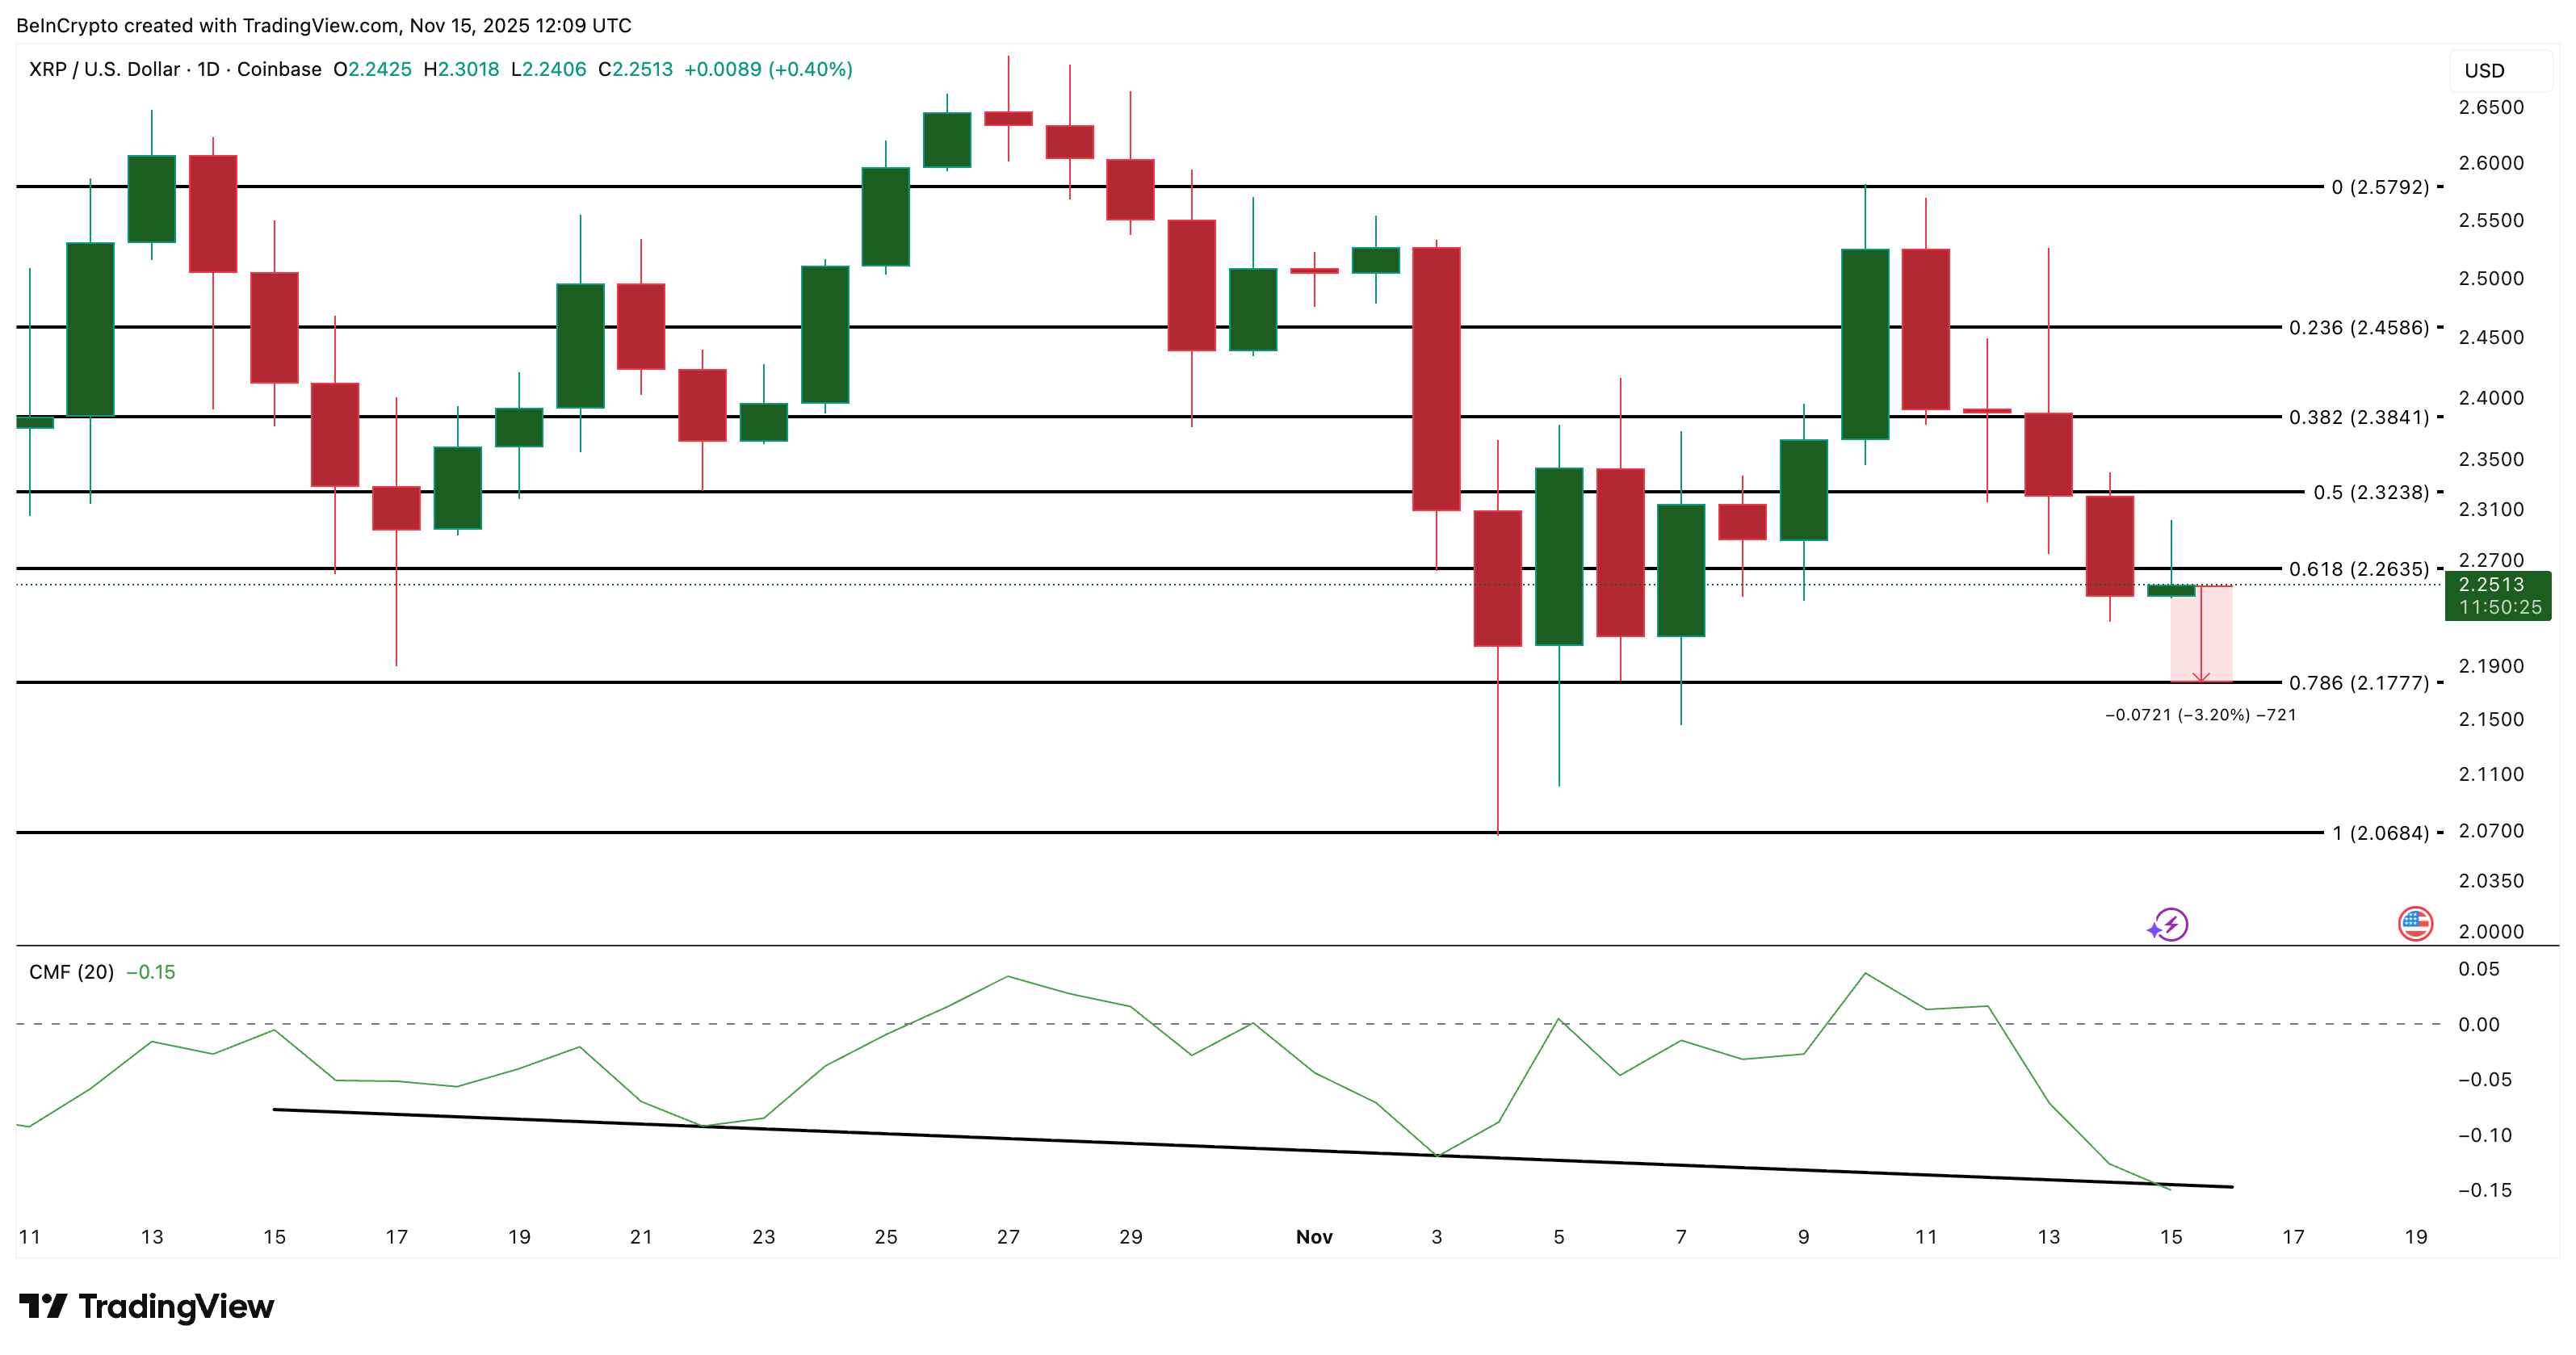
XRP Price Analysis: TradingView

If weakness continues, XRP risks losing $2.17, exposing a deeper move toward $2.06. A breakdown below $2.06 would invalidate any short-term bullish attempts.

The only way to regain momentum is a clean daily close above $2.38 — a level that has rejected the price multiple times this month. Clearing it could open a path toward $2.57 and flip the near-term structure bullish.

Disclaimer: For information purposes only. Past performance is not indicative of future results.
placeholder
What's Really Inside the AI Bubble? Decoding the Core Controversies Over Scale, Reliance and Valuation As ChatGPT nears its three-year anniversary, the AI boom has fueled a three-year U.S. equity rally. However, growing AI bubble concerns and investor fatigue now threaten to derail market
Author  TradingKey
Yesterday 10: 11
As ChatGPT nears its three-year anniversary, the AI boom has fueled a three-year U.S. equity rally. However, growing AI bubble concerns and investor fatigue now threaten to derail market
placeholder
Top 3 Price Prediction: Bitcoin, Ethereum, Ripple – BTC, ETH, and XRP flash deeper downside risks as market selloff intensifiesBitcoin (BTC), Ethereum (ETH) and Ripple (XRP) trade in red on Friday after correcting more than 5%, 10% and 2%, respectively, so far this week.
Author  FXStreet
Yesterday 08: 32
Bitcoin (BTC), Ethereum (ETH) and Ripple (XRP) trade in red on Friday after correcting more than 5%, 10% and 2%, respectively, so far this week.
placeholder
Gold Posts Biggest Weekly Gain in a Month as US Data Delays Fuel UncertaintyGold climbed higher on Friday, marking its strongest weekly performance in a month, as traders weighed the impact of a data backlog following the end of the US government's extended shutdown. Silver also moved upward.
Author  Mitrade
Yesterday 05: 48
Gold climbed higher on Friday, marking its strongest weekly performance in a month, as traders weighed the impact of a data backlog following the end of the US government's extended shutdown. Silver also moved upward.
placeholder
WTI rises to near $60.00 on supply risks due to US sanctionsWest Texas Intermediate (WTI) Oil price gains for the second successive session, trading around $59.90, up by more than 2%, during the Asian hours on Friday. Crude Oil prices receive support from supply risks linked to upcoming United States (US) sanctions.
Author  FXStreet
Yesterday 03: 47
West Texas Intermediate (WTI) Oil price gains for the second successive session, trading around $59.90, up by more than 2%, during the Asian hours on Friday. Crude Oil prices receive support from supply risks linked to upcoming United States (US) sanctions.
placeholder
Ethereum slides 5% as bears lean on $3,500 cap and put $3,150 support in focusEthereum (ETH) drops more than 5% after a failed push above $3,550, with price sliding to $3,153 and now holding below $3,350, the 100-hour SMA and a bearish trend line at $3,500; unless bulls reclaim the $3,350–$3,500 zone, the short-term bias stays bearish and a clean break under $3,150 could expose $3,050, $3,000 and even the $2,880–$2,850 support area.
Author  Mitrade
Yesterday 03: 41
Ethereum (ETH) drops more than 5% after a failed push above $3,550, with price sliding to $3,153 and now holding below $3,350, the 100-hour SMA and a bearish trend line at $3,500; unless bulls reclaim the $3,350–$3,500 zone, the short-term bias stays bearish and a clean break under $3,150 could expose $3,050, $3,000 and even the $2,880–$2,850 support area.
goTop
quote