

Bitcoin Inflows To Binance Surge: Daily Average Hits 7,500 BTC
Bitcoin is entering a consolidation phase, holding steady above the $100,000 mark but struggling to break past $105,000. The market appears to be stabilizing after weeks of volatility, yet on-chain data signals that profit-taking remains active. According to top analyst Darkfost, since the exceptional liquidation event in early October, many investors have started to secure profits and scale back their exposure as the current cycle nears its end.
Data from CryptoQuant reveals a notable uptick in Bitcoin inflows to Binance. The 30-day moving average of daily inflows has climbed sharply throughout October, showing that, on average, roughly 7,500 BTC are being transferred to Binance every day. This is the highest inflow rate since the March correction, indicating renewed selling pressure and cautious positioning among traders.
While such inflows often reflect profit realization and short-term selling, Bitcoin’s ability to consolidate near the $100K level suggests resilient underlying demand. Buyers continue to absorb the supply entering the market, preventing a deeper breakdown — at least for now. As the cycle matures, this phase may prove critical in determining whether Bitcoin stabilizes for another leg up or faces a more prolonged correction.
Short-Term Holders Add To Selling Pressure As Bitcoin Consolidates
Darkfost explains that the recent surge in Bitcoin inflows to Binance and other exchanges reflects growing selling pressure across the market. Despite this, Bitcoin’s price continues to consolidate relatively cleanly around the symbolic $100,000 level — a sign that existing demand remains strong enough to absorb the increased supply. This balance between distribution and accumulation indicates that the market is undergoing a structural reset rather than a full-blown capitulation.
Adding to this dynamic, short-term holders (STHs) have become a major contributor to the ongoing selling pressure. These participants are typically the most reactive segment of the market, responding quickly to volatility and sentiment shifts. With a realized price near $112,000, many STHs have been underwater for about a month, prompting them to send significant amounts of BTC to exchanges at a loss.
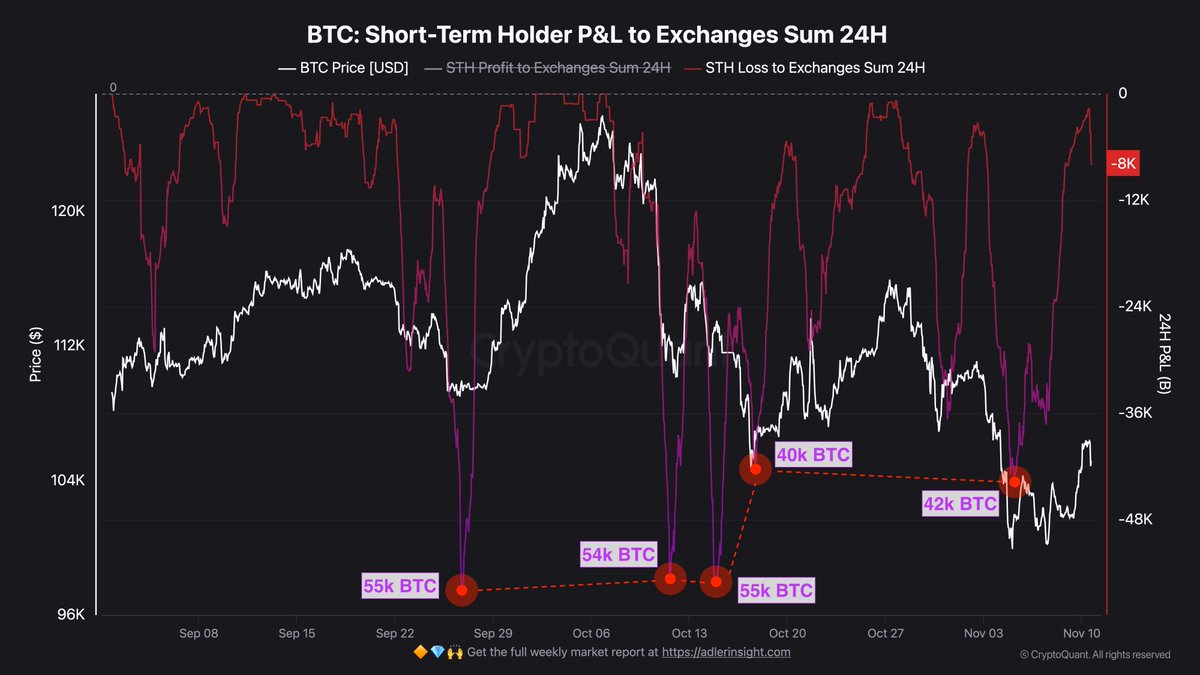
Historically, this type of behavior has coincided with late-stage corrections — what analysts often call a “cleansing phase.” During such phases, speculative capital exits the market while long-term investors quietly absorb the supply, setting the foundation for renewed stability and potential future growth.
If demand continues to offset this wave of short-term selling, Bitcoin could soon form a stronger base above $100,000 — paving the way for a gradual recovery as selling pressure fades and confidence returns.
Weekly Chart: Holding the Line Above Key Support
Bitcoin continues to consolidate within a tight range between $102,000 and $107,000, showing resilience around the critical $100K psychological level. On the weekly chart, BTC remains supported by the 50-week moving average (blue line), which is acting as a strong dynamic floor for price. Despite multiple retests over recent weeks, bulls have managed to defend this level, signaling that underlying demand remains intact even as profit-taking intensifies.

The broader structure still points to a healthy long-term uptrend. The 100-week (green) and 200-week (red) moving averages continue sloping upward, confirming that Bitcoin’s macro bias remains bullish. However, the lack of strong volume during recent rebounds suggests that market participants are cautious, awaiting confirmation of renewed momentum before adding to positions.
If Bitcoin manages to reclaim the $110K region, it could invalidate short-term bearish sentiment and trigger a recovery toward the $117K–$120K resistance zone. Conversely, a weekly close below $100K would mark a significant technical breakdown, potentially opening the door to a deeper retrace toward $92K–$95K.
Featured image from ChatGPT, chart from TradingView.com
Recommended Articles


