
Hedera Price Forecast: HBAR extends rally after ETF debut and bullish on-chain activity
- Hedera price continues to climb on Thursday, extending its gains by over 13% so far this week.
- The newly launched HBAR ETF on NYSE attracts $8 million in first-day trading volume.
- On-chain metrics remain bullish, with whale accumulation rising and momentum indicators showing strengthening upward traction.
Hedera (HBAR) price extends its gains, trading above $0.20 at the time of writing on Thursday after rallying over 13% so far this week. The recent launch of HBAR’s spot Exchange Traded Fund (ETF) on the NYSE further supported the bullish outlook, attracting $8 million in first-day trading volume. Moreover, on-chain data and the technical outlook suggest further gains, with whale accumulation rising and indicators hinting at bullish momentum.
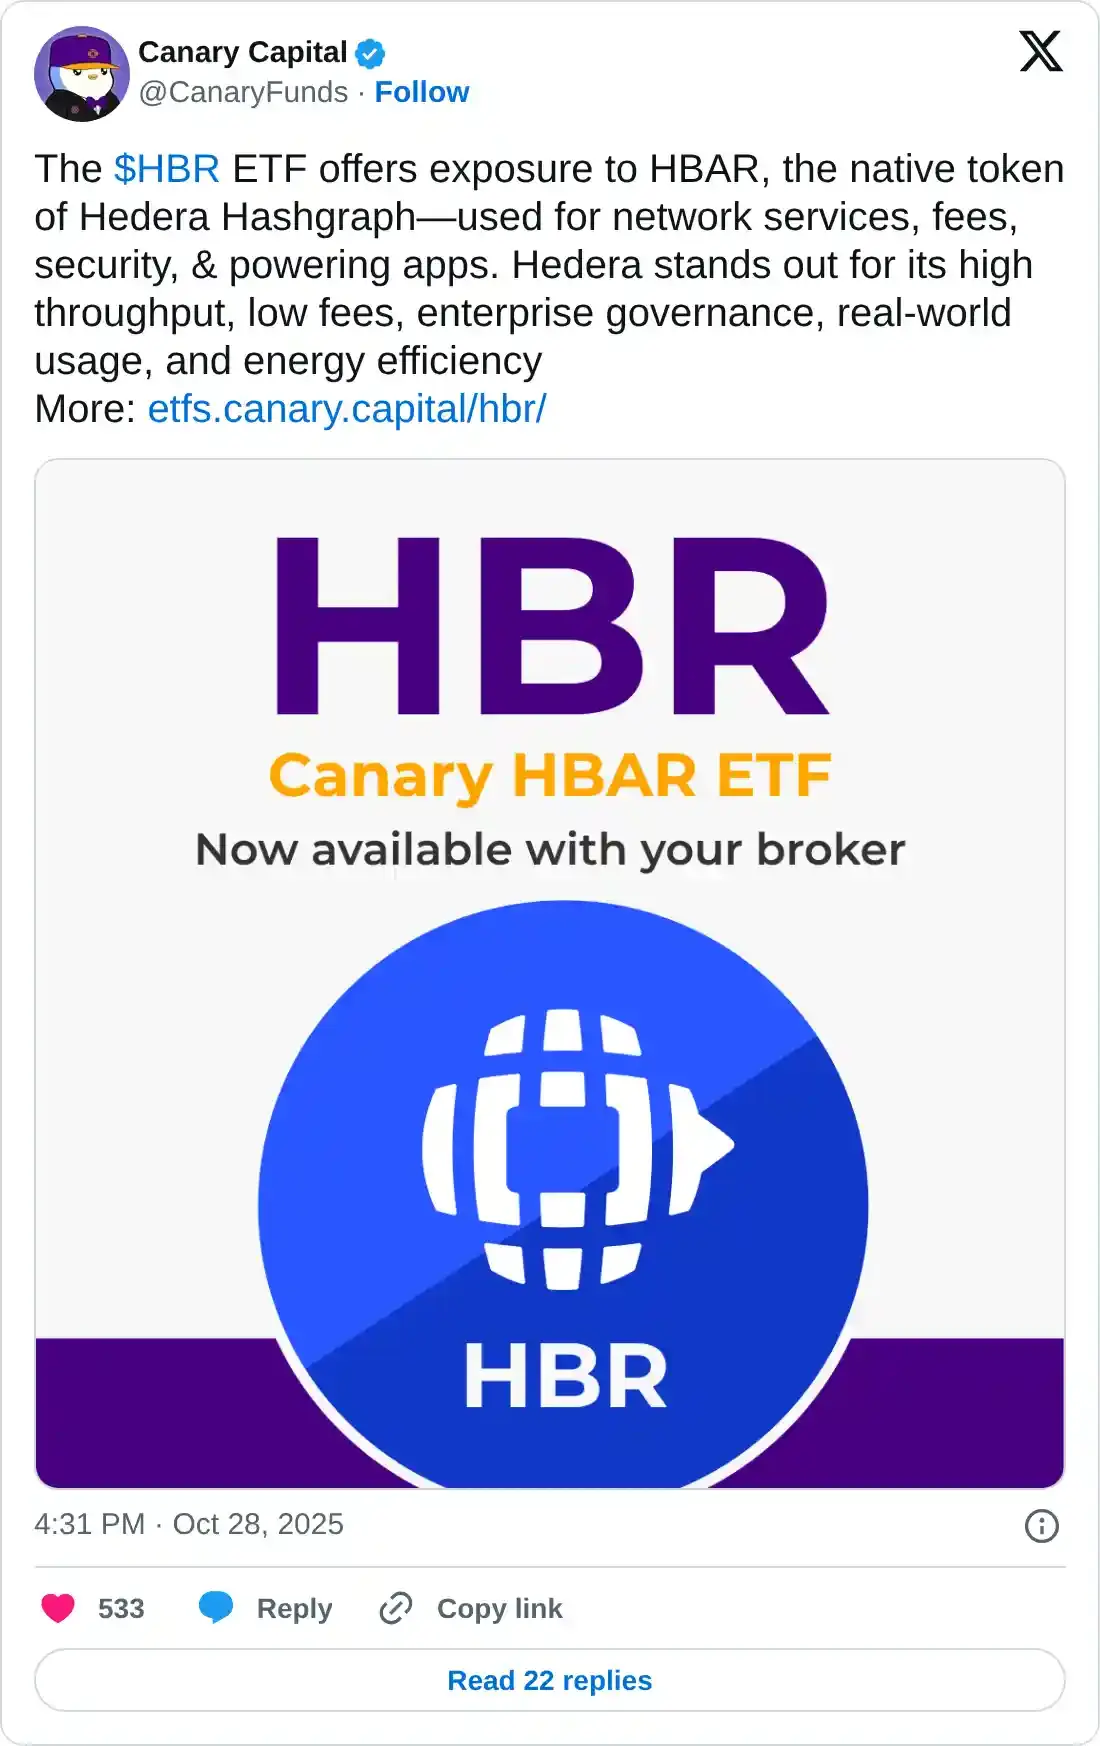
Hedera spot ETF debuts on NYSE
Canary Capital, an asset management company, announced on Tuesday that it has launched the Hedara spot ETF (HBR).
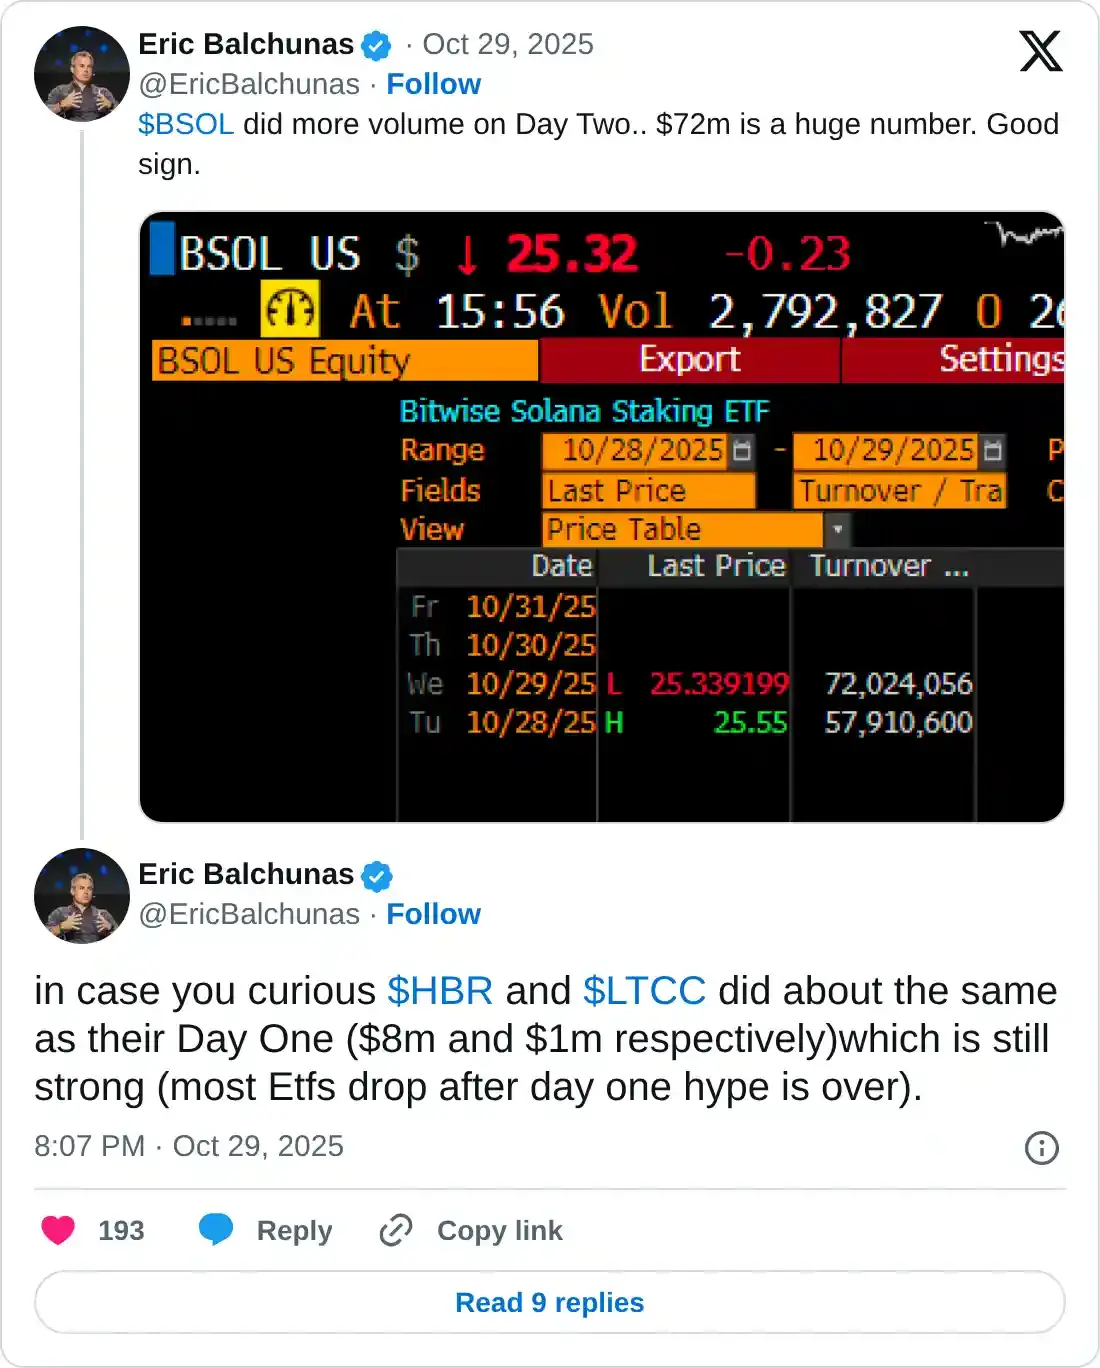
Eric Balchunas, Senior ETF Analyst for Bloomberg, confirmed on his X post on Thursday that the HBR attracted approximately $8 million in inflows on its first trading session, signaling robust institutional and retail demand for regulated exposure to Hedera’s ecosystem.
Hedera’s spot ETF is bullish for its native token, HBAR, in the long term, as it allows investors to gain exposure without directly holding HBAR while also enhancing liquidity, legitimacy, and overall adoption.
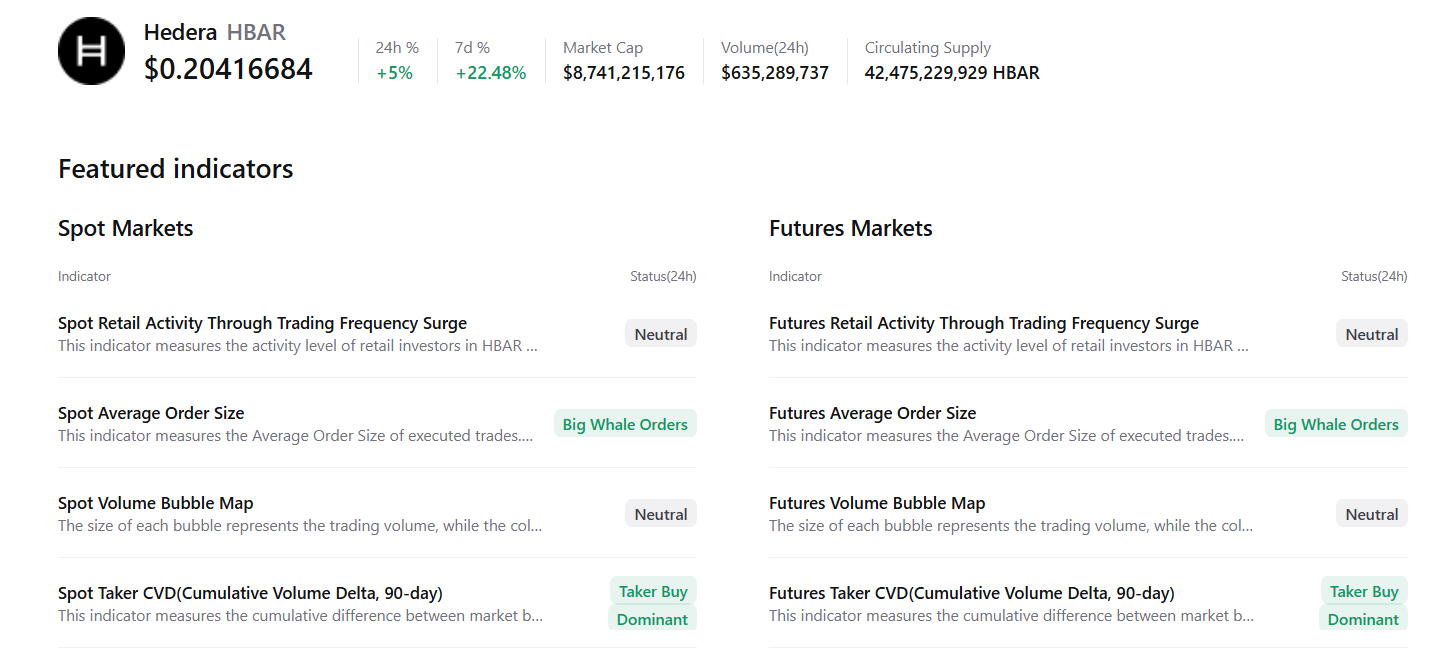
Hedera’s on-chain data supports further gains
CryptoQuant’s summary data supports the bullish outlook, as HBAR’s spot and futures markets show large whale orders and buy dominance, signaling a potential rally ahead.
Santiment data shows that Hedera’s transaction volume rose to $1.17 billion on Tuesday, the highest level since July 19 and steadied around $640 million on Thursday. This rising transaction volume indicates a recent surge in traders’ interest and liquidity in the HBAR chain, which bodes well for its price.
 [07-1761797600484-1761797600486.48.06, 30 Oct, 2025].png)
HBAR transaction volume chart. Source: Santiment
Hedera Price Forecast: HBAR bulls aiming for higher leg
Hedera price broke above the lower trendline of the falling wedge pattern on Tuesday and rose 8.62% by the next day, closing above the 50-day Exponential Moving Average (EMA) at $0.19. At the time of writing on Thursday, HBAR continues to trade higher above $0.20.
If HBAR continues its upward trend, it could extend the rally toward the July 31 high of $0.27.
The Relative Strength Index (RSI) on the daily chart reads 58, above the neutral level of 50, indicating bullish momentum gaining traction. Additionally, the Moving Average Convergence Divergence (MACD) showed a bullish crossover last week, providing a buy signal. Moreover, the rising green histogram bars above the neutral level support bullish momentum and suggest an upward trend.
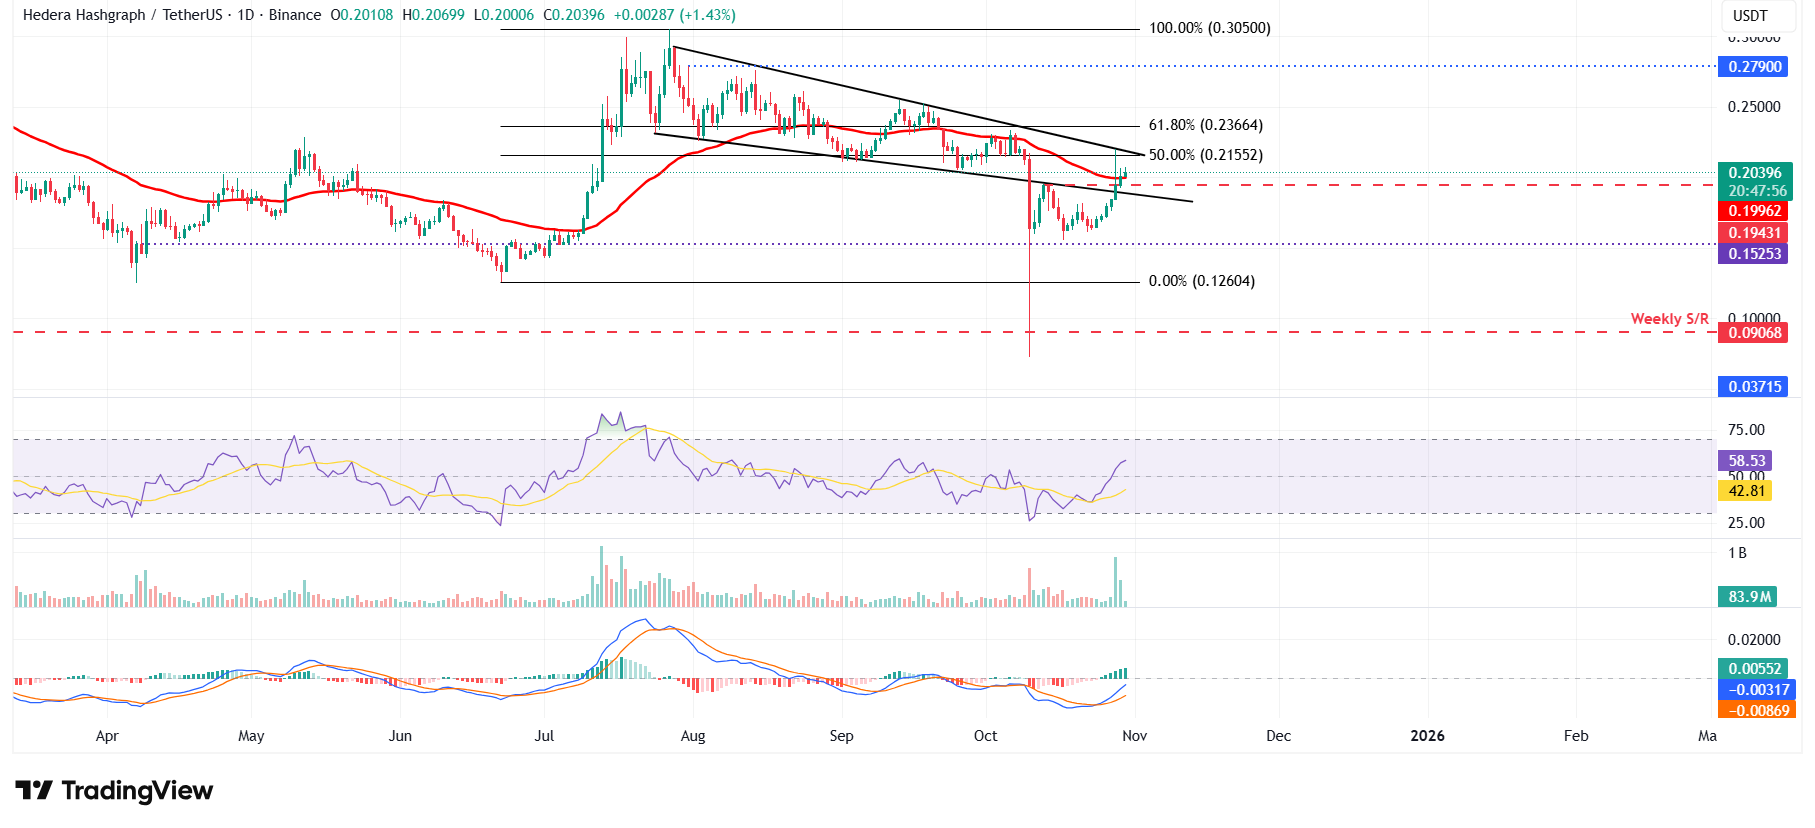
HBAR/USDT daily chart
On the other hand, if HBAR faces a correction, it could extend the decline toward the daily support at $0.19.
Recommended Articles


