


Is The Ethereum Bull Cycle Over? Analyst Identifies Potential ‘Double Top’ Pattern
The cryptocurrency market has not had its typical “Uptober” performance so far this month, with most large-cap assets falling to new local lows in the past few months. The Ethereum price, which was on the verge of hitting $5,000 a few weeks ago, is now languishing below the $4,000 mark.
While the “king of altcoins” had a stop-start performance over the past week, its price seems to be in a better place than it was seven days ago. However, an interesting outlook has emerged for the Ethereum price, with the altcoin believed to have already reached its peak in this cycle.
How Feasible Is A Double Top For ETH Price?
Popular crypto analyst Ali Martinez recently took to the social media platform X to share insights into the current setup of the Ethereum price. According to the market pundit, the second-largest cryptocurrency could be in for an extended bearish period over the next few weeks.
This evaluation revolves around the potential formation of the “double top” pattern on the 3-day timeframe of the Ethereum chart. For context, the double top formation is a technical analysis pattern suggesting a possible bearish trend reversal after an asset’s price touches a resistance level without breaking through.
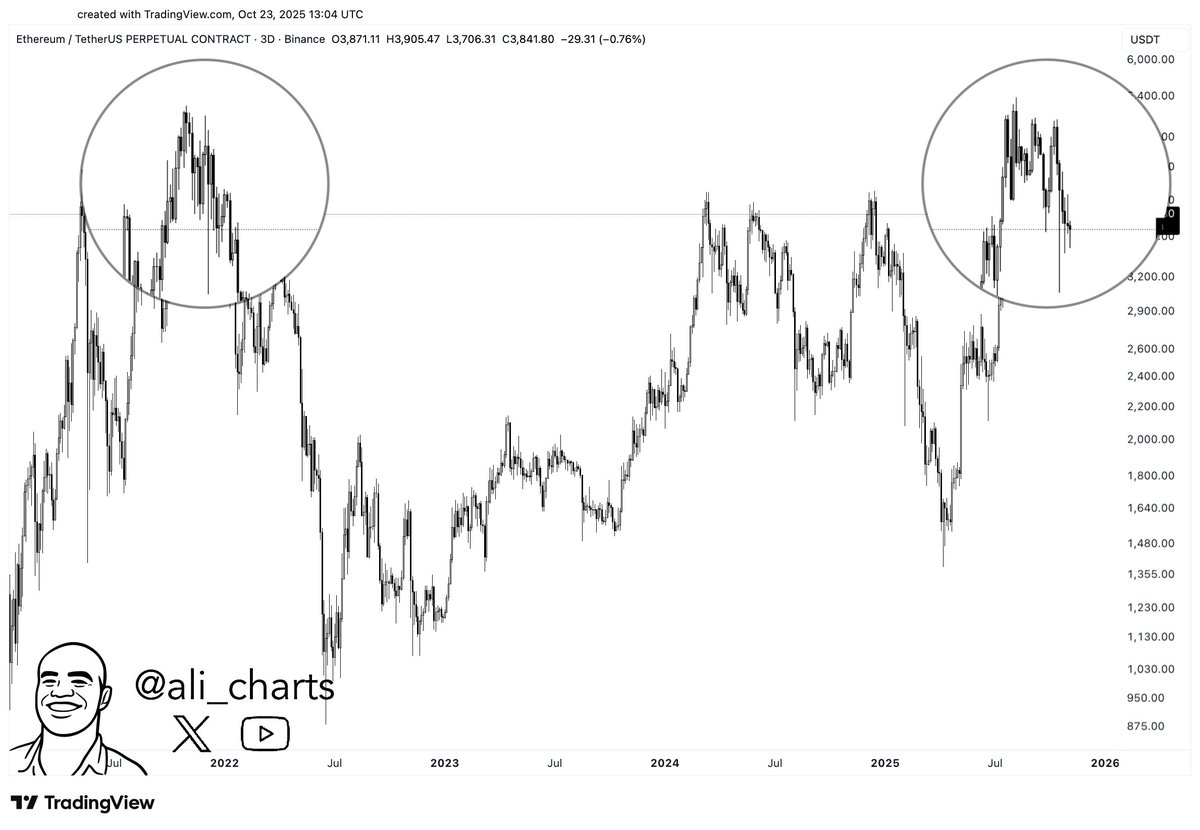
As observed in the chart above, the initial top came around late 2021 during the altcoin season when the price of ETH rose to the then-all-time high of above $4,800. This price peak was followed by a market crash, which saw the value of Ethereum drop to around the $1,000 mark by mid-2026.
Meanwhile, the purported second top of this Ethereum price setup is the current all-time high of $4,946, reached earlier in August 2025. According to data from CoinGecko, the altcoin’s value is currently more than 20% adrift from this record high.
While the two tops (nearly four years) look somewhat identical, the price action between them makes it tricky to definitively call them a “double top” pattern. Moreover, the double top can only be confirmed when the price drops below the support level, which typically is the lowest point between the two peaks. This support level would then be at around $1,000, which is a significant distance from the current price point.
Nevertheless, it is important to pay attention to the price movement of ETH over the next few weeks, as it could provide insight into the coin’s future relative to this setup.
Ethereum Price At A Glance
As of this writing, the price of ETH stands at around $3,983, reflecting an almost 3% jump in the past 24 hours.

Recommended Articles


