
Crypto Today: Bitcoin, Ethereum, XRP rise amid renewed risk-on sentiment
- Bitcoin reclaims its position above $111,000 despite $1.23 billion in ETF outflows last week.
- Ethereum rises above the $4,000 key level, supported by the 100-day EMA.
- XRP eyes $3.00 breakout, but low retail interest risks dampening momentum.
Bitcoin (BTC) extends its recovery trading above $111,000 on Monday. The rebound, mirrored across the cryptocurrency market, follows last week’s volatility, which saw the price of BTC correct to $103,528 on Friday.
Altcoins, including Ethereum (ETH) and Ripple (XRP), are showcasing recovery potential at the time of writing, suggesting a gradual shift toward risk-on sentiment.
Data spotlight: Bitcoin, Ethereum ETF outflows persist
Bitcoin spot Exchange Traded Funds (ETFs) operating in the United States (US) cumulatively experienced net outflows of $1.23 billion last week. This marked the highest weekly outflow since late February and underscores the risk-off sentiment that engulfed the crypto market.
Macroeconomic uncertainty, the trade standoff between the US and China, and lack of catalysts in the crypto market are some of the factors that triggered the sell-off.
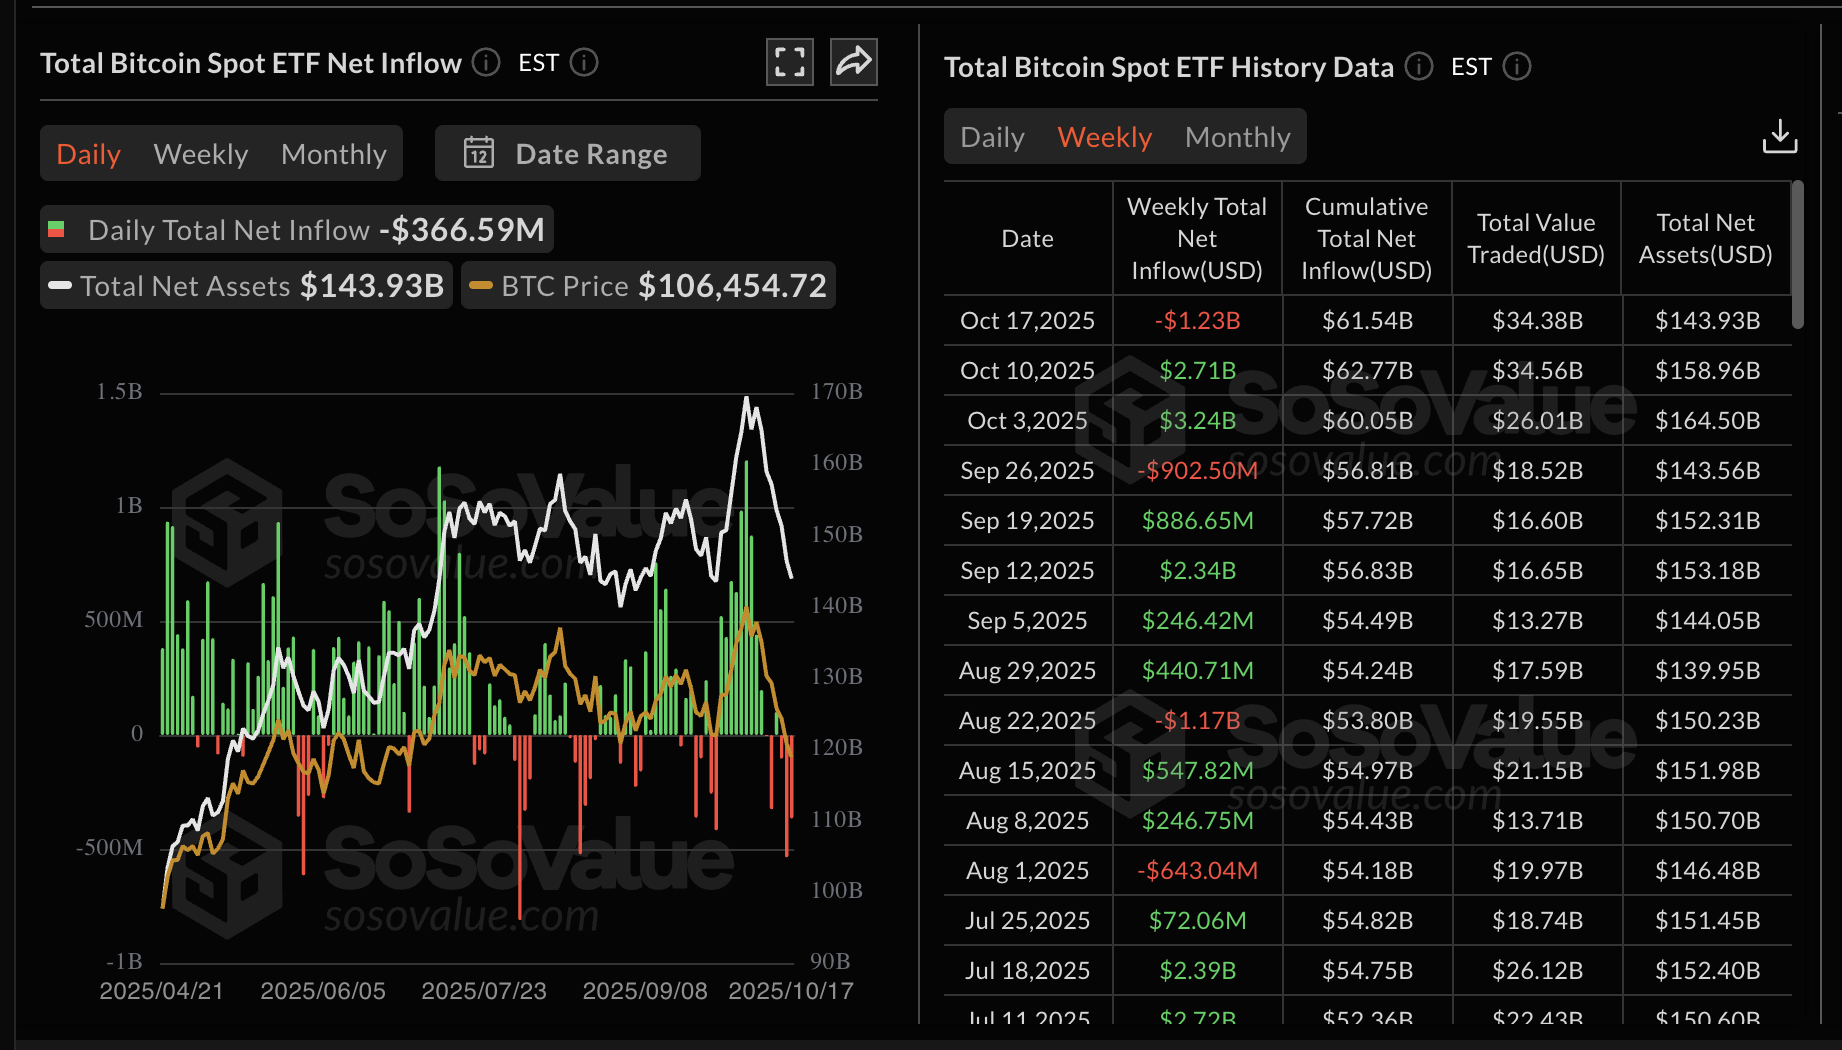
Bitcoin ETF stats | Source: SoSoValue
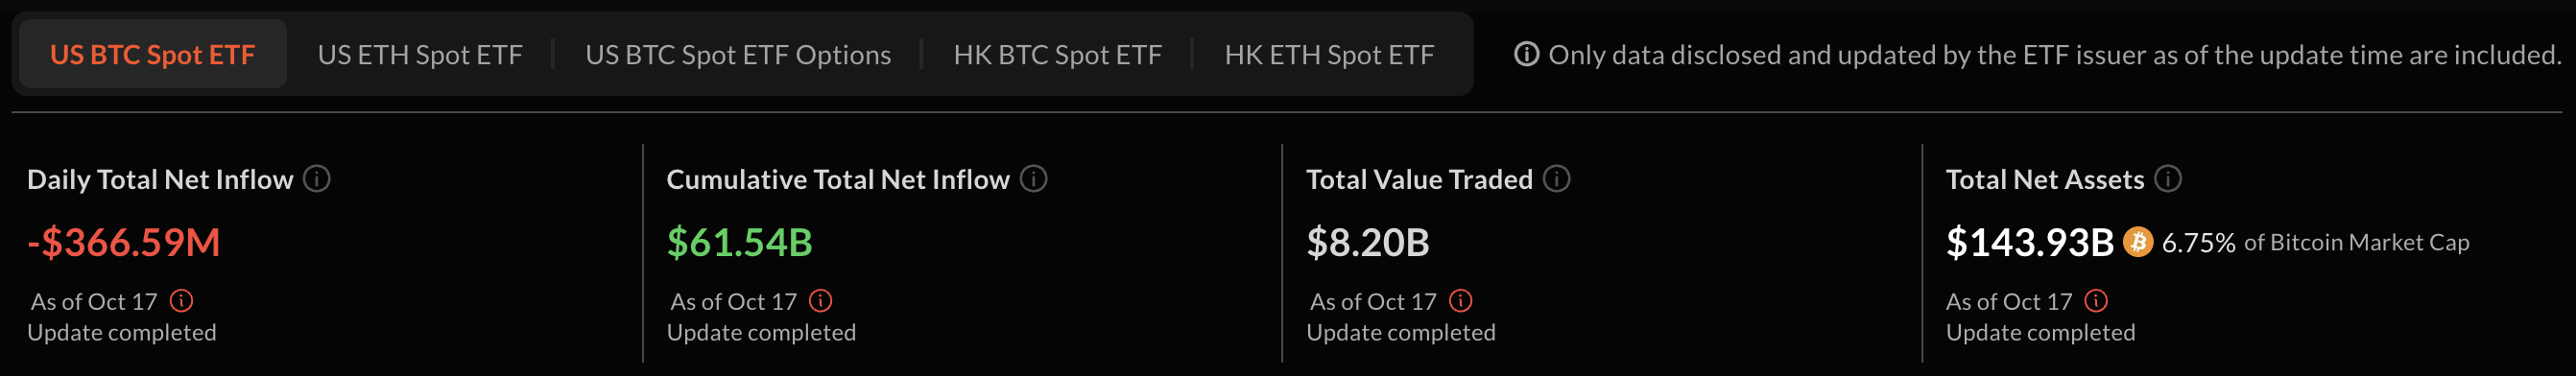
Bitcoin ETFs boast $61.54 billion total net inflow volume, with net assets averaging at $143.93 billion by last Friday. If the ongoing increase in price steadies, it will imply stability in the market, making crypto-related investments attractive. Steady ETF inflows often signal positive market sentiment, bolstering price recovery.
Bitcoin ETF stats | Source: SoSoValue
Ethereum spot ETFs, on the other hand, experienced outflows of $311.8 million last week, reflecting the risk-averse sentiment in the broader crypto market. The total outflow on Friday averaged $232 million, bringing the cumulative total net inflow volume to $14.6 billion, with the net assets at $25.98 billion.
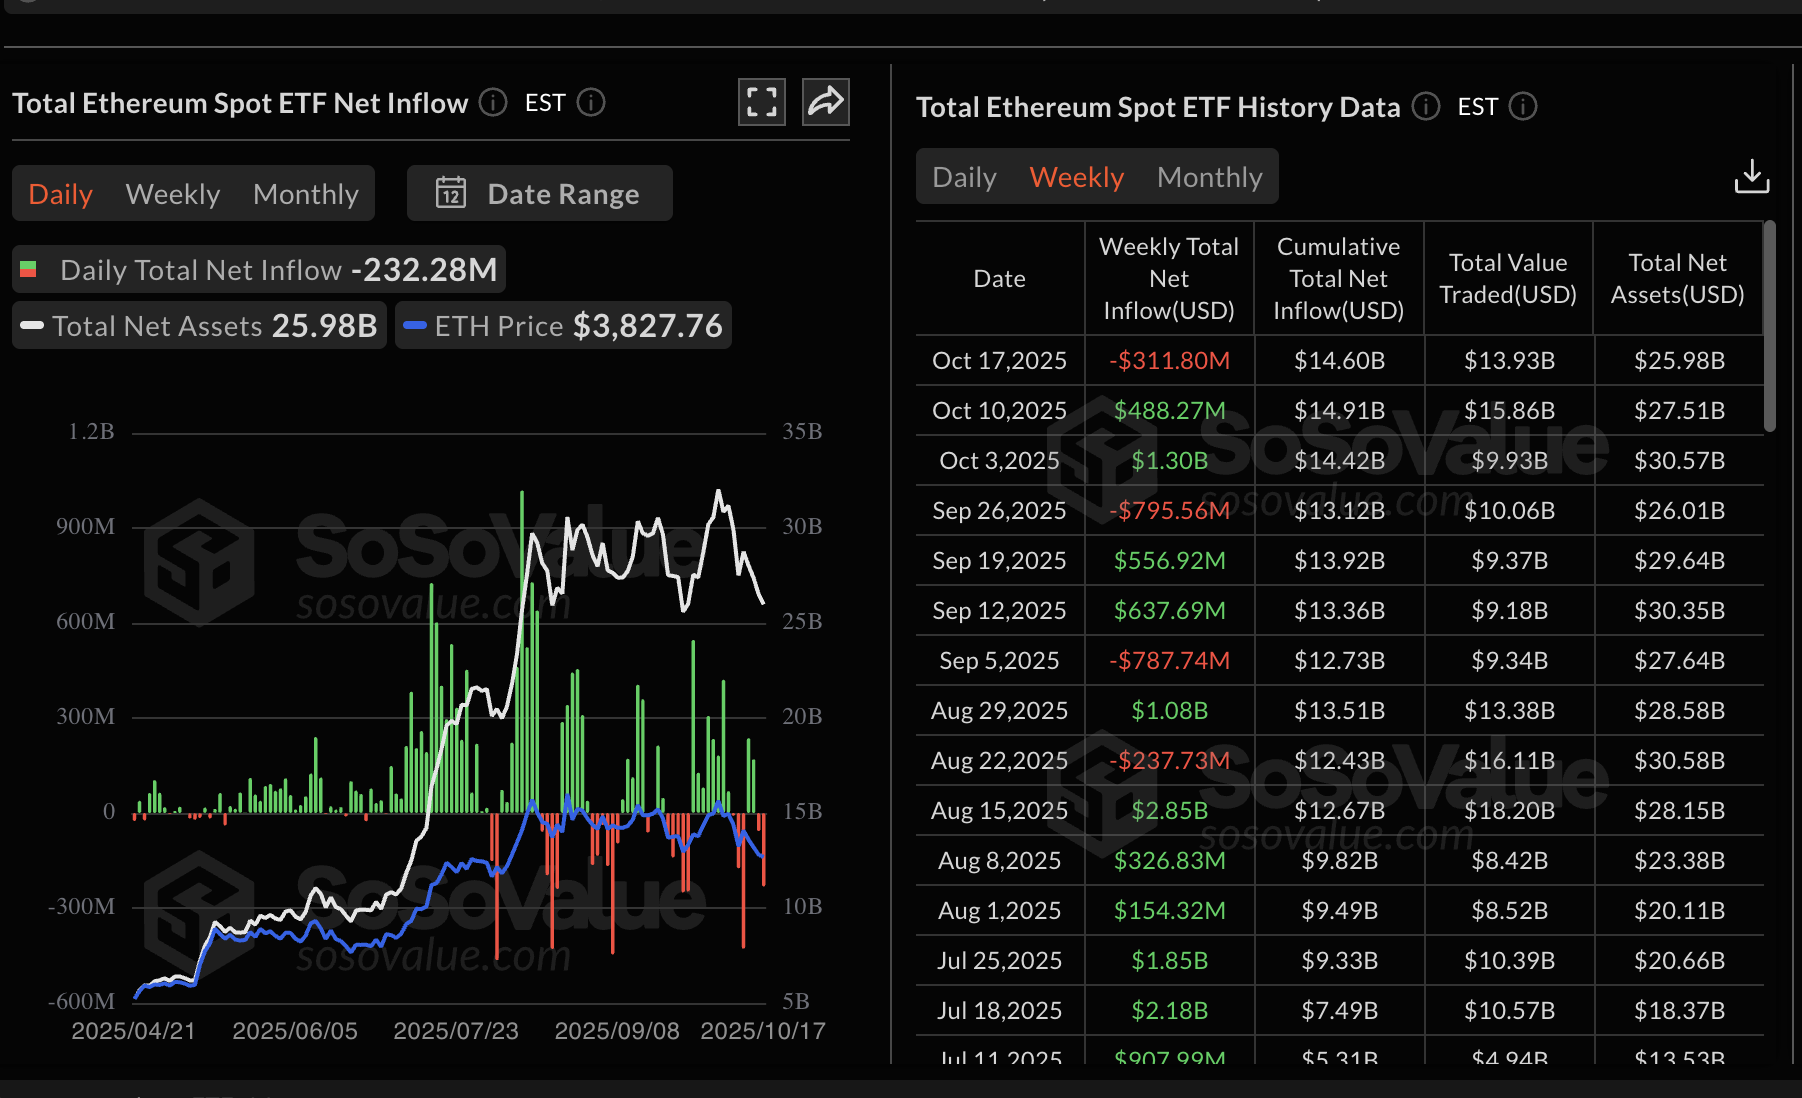
Ethereum ETF stats | Source: SoSoValue
Meanwhile, retail demand for XRP remains suppressed, as evidenced by a massive drop in the futures Open Interest (OI), which averages $3.53 billion on Monday.
OI is a measure of the notional value of outstanding futures contracts. It peaked at $10.94 billion after XRP achieved a new record high of $3.66 in mid-July, according to CoinGlass data. This persistent decline in OI suggests that the pool of XRP buyers is shrinking amid increasing bearish pressure. Monitoring the XRP futures OI would help traders gauge risk-on sentiment and the state of retail demand.
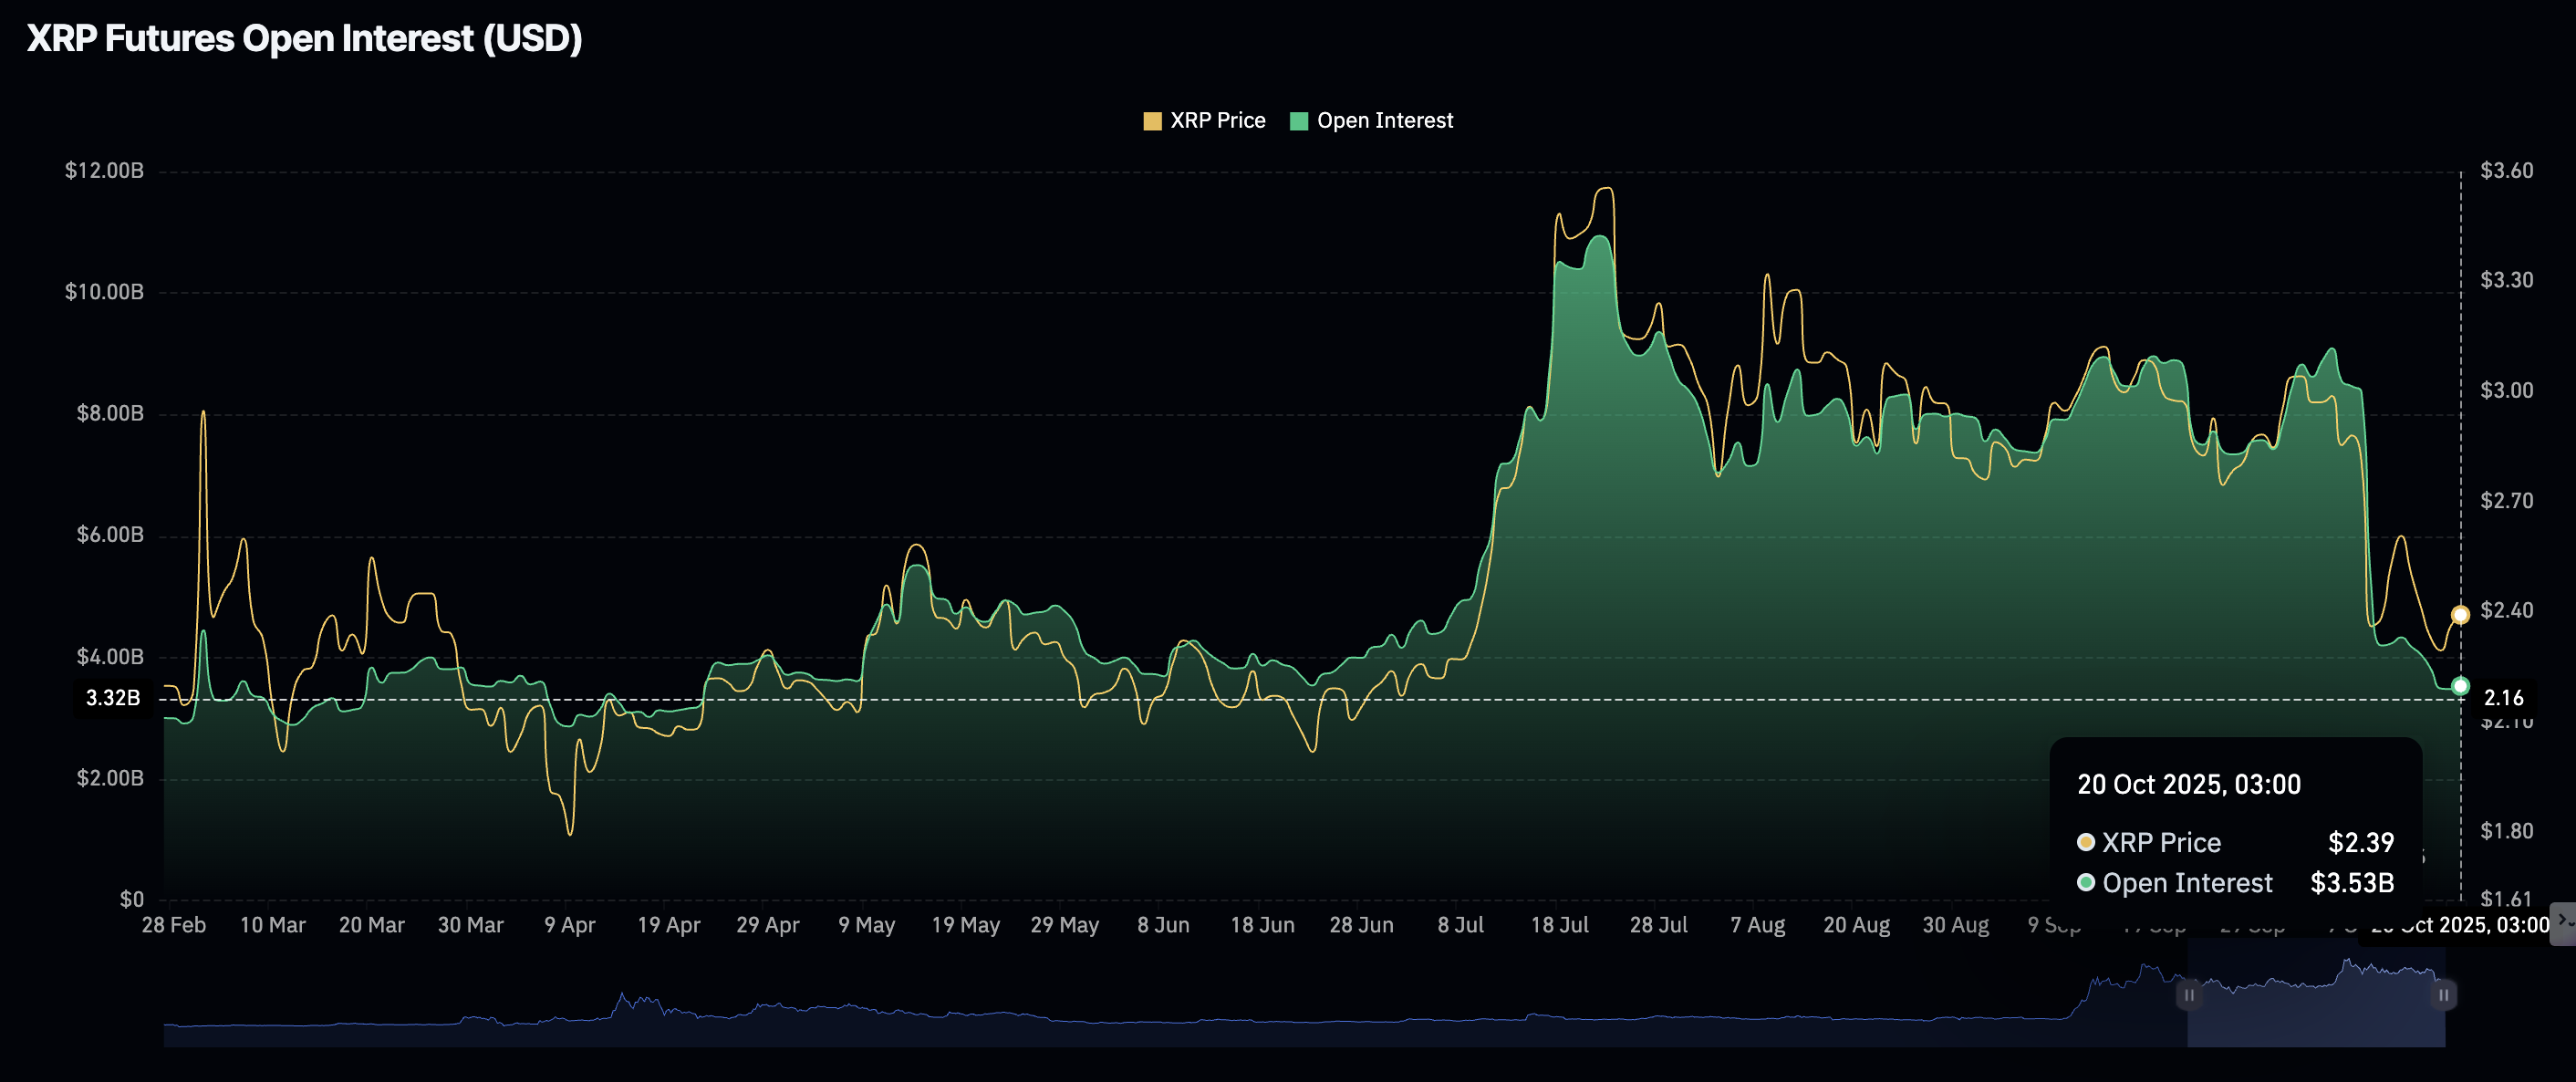
XRP Futures Open Interest | Source: CoinGlass
Chart of the day: Can Bitcoin uphold bullish outlook?
Bitcoin is trading above $111,000 at the time of writing on Monday. Sentiment has shifted positively since the sharp decline to $103,528 on Friday, buoyed by an uptrending Relative Strength Index (RSI) at 45 on the daily chart. Traders will look out for a bullish divergence and RSI’s potential crossovers above the midline to ascertain that bullish momentum is increasing.
Although the Moving Average Convergence Divergence (MACD) indicator in the same daily time frame has upheld a sell signal since October 10, there is the potential for a buy signal to occur with the blue MACD line crossing above the red signal line. Such a signal could encourage investors to increase risk exposure, contributing to buying pressure.
Key areas of interest for traders are the detected ascending trendline, which should be accepted as support, the resistance at the 100-day Exponential Moving Average (EMA) currently at $112,966 and the 50-day EMA at $114,071.
If investors book early profits, contributing to selling pressure, the path of least resistance could flip downward, paving the way for declines below the $110,000 level. The 200-day EMA at $108,070 is in line to absorb selling pressure.
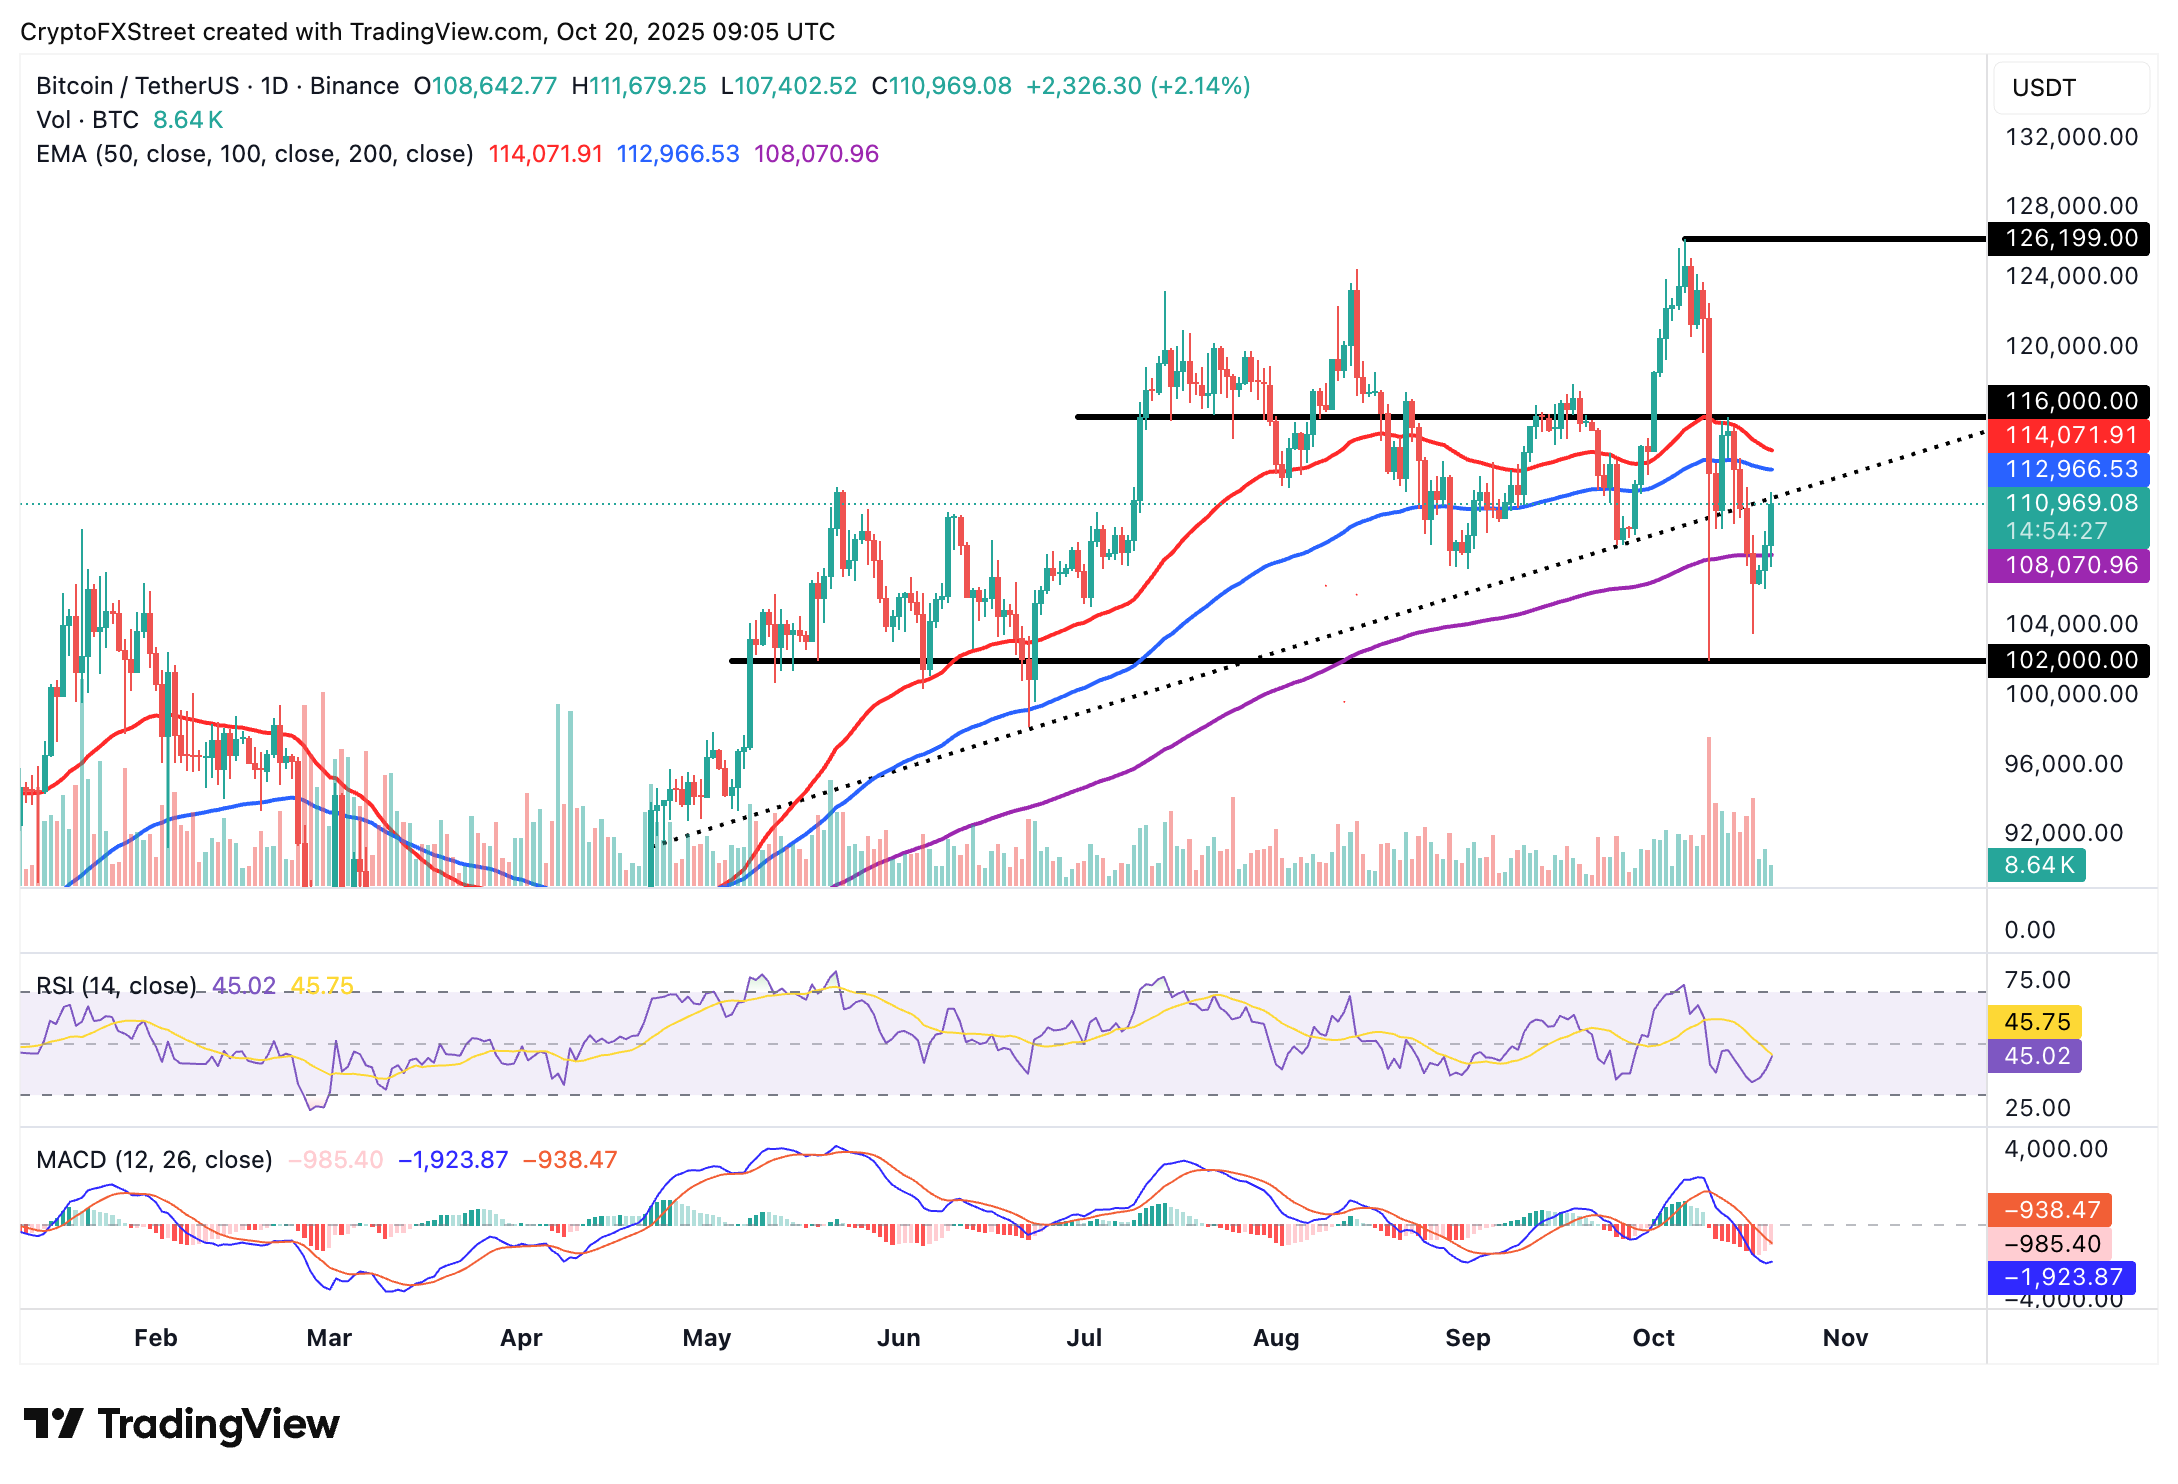
BTC/USDT daily chart
Altcoins update: Ethereum, XRP steady recovery
Ethereum remains above the $4,000 critical level, buoyed by positive sentiment in the wider crypto market. This marks roughly a 10% increase since Friday, when the price of ETH dropped to $3,674.
The RSI highlights a bullish divergence, crossing above the signal line. This underlines an increasing bullish momentum. Traders may also watch out for a buy signal from the MACD indicator, which will manifest when the blue line crosses above the red signal line.
Key milestones for Ethereum will include breaking above the 50-day EMA at $4,180, the round-number hurdle at $4,500 and the descending trendline that has been in place since Ethereum achieved a new record high of $4,956 in late August.
Despite the bullish outlook, it is too early to rule out a potential pullback below the $4,000 level, especially if risk-on sentiment persists due to macroeconomic factors and trade uncertainty. The 100-day EMA at $3,973 and the 200-day EMA at $3,564 are in line to absorb selling pressure.
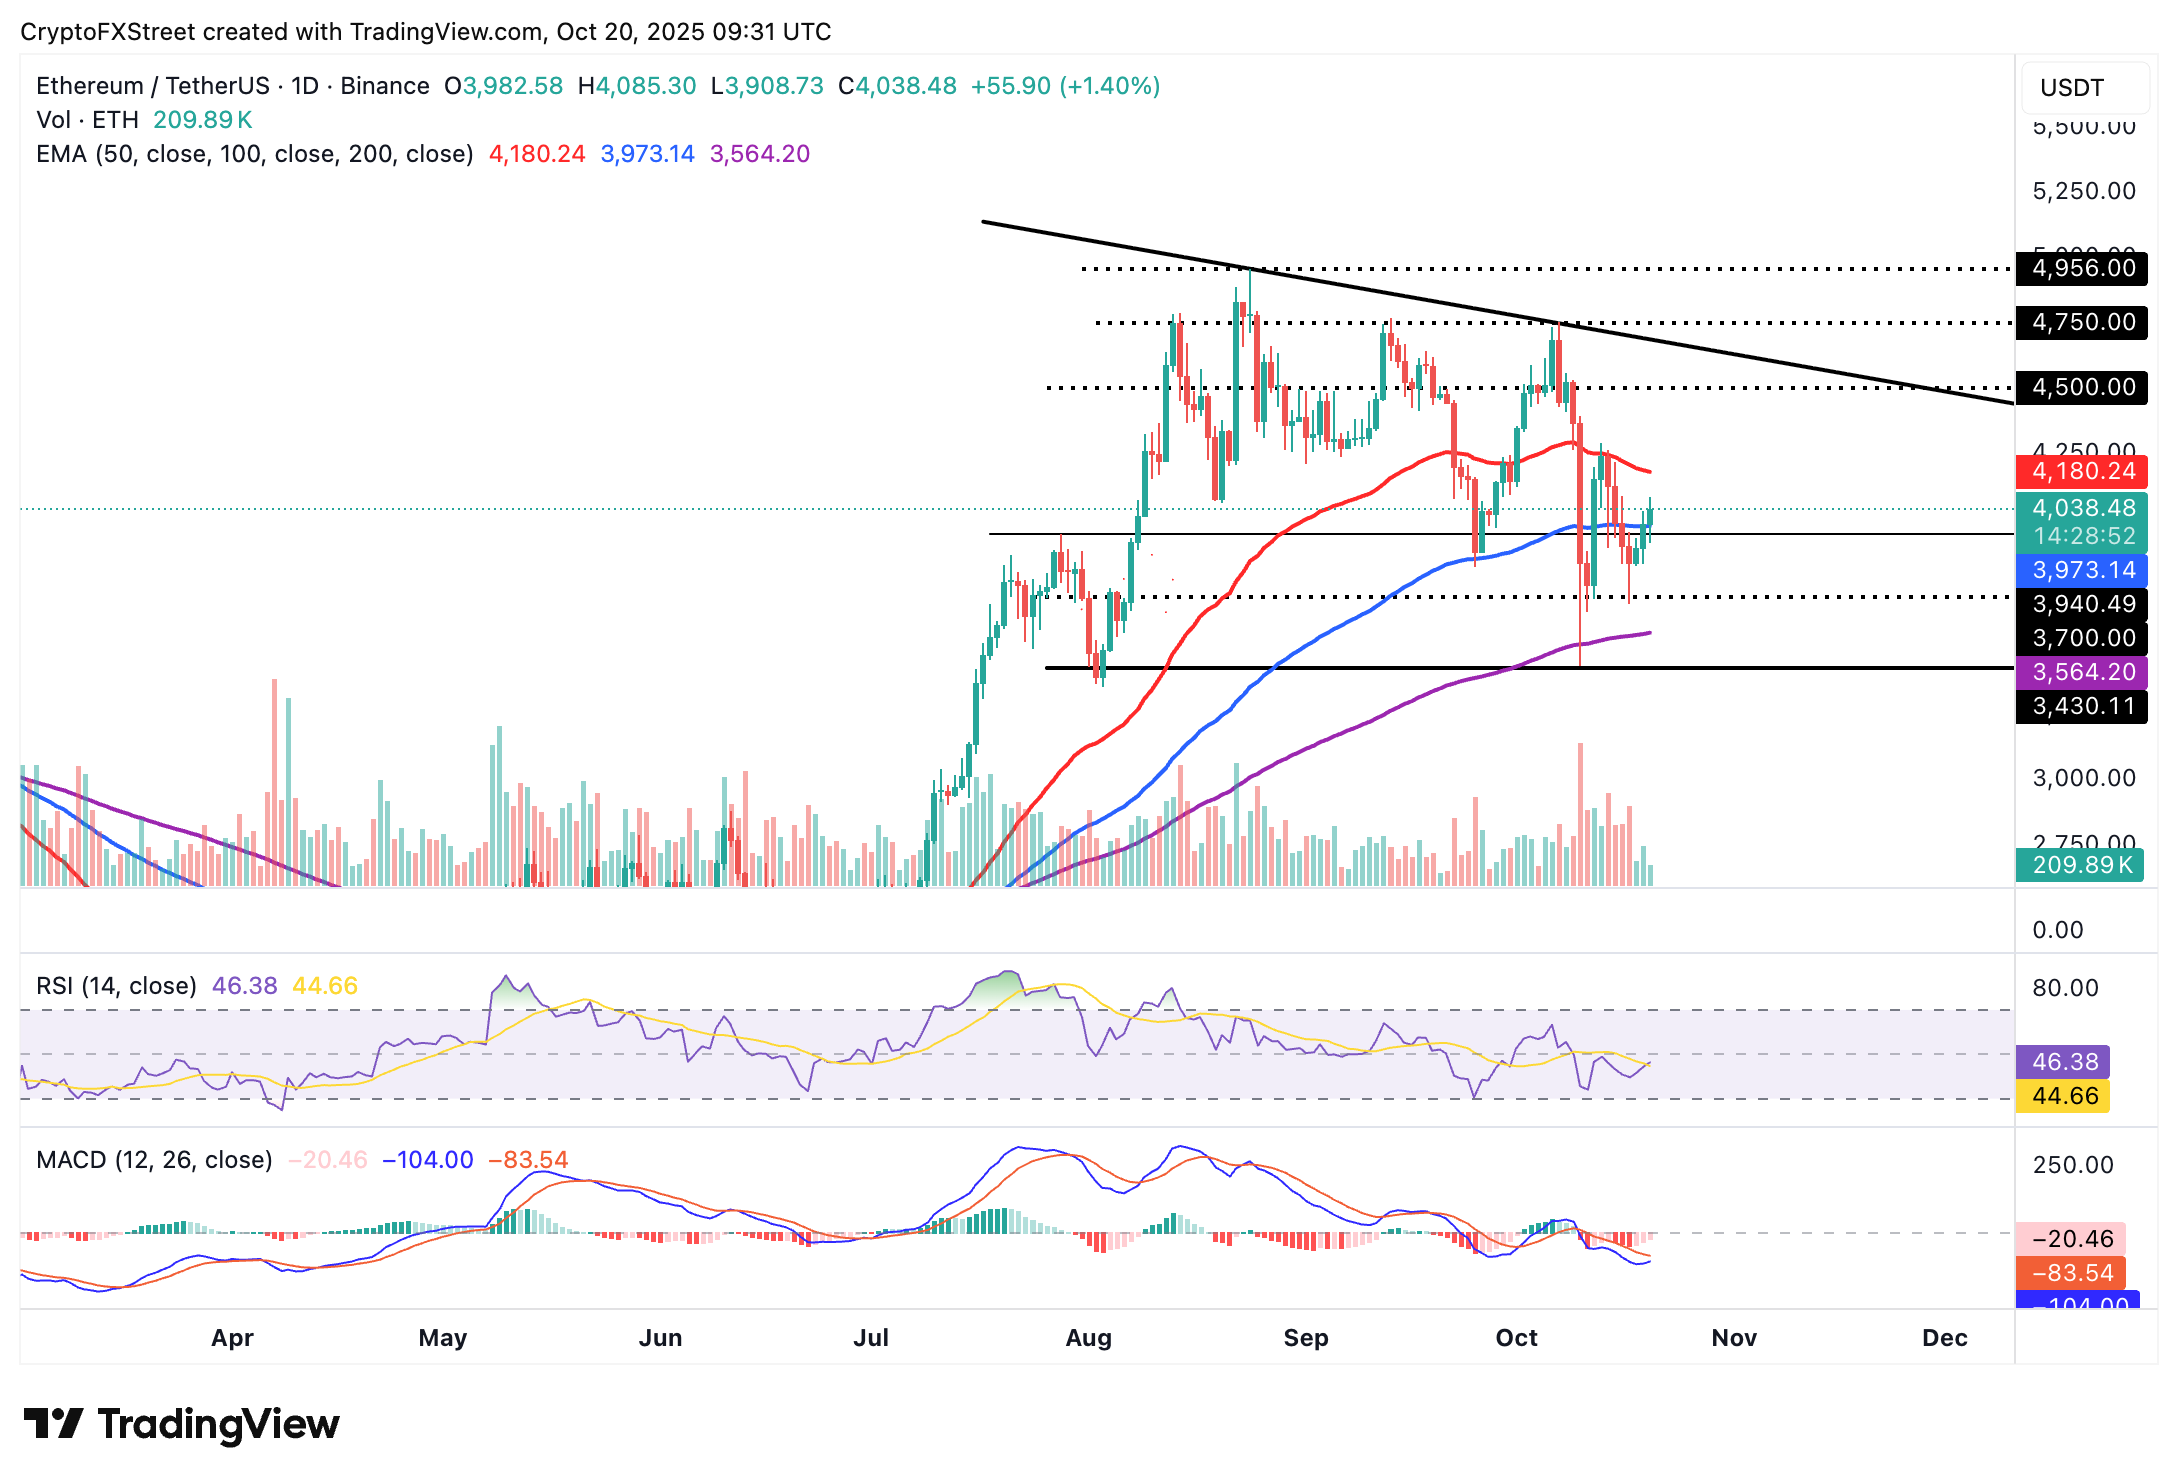
ETH/USDT daily chart
As for XRP, bulls seem ready to tighten their grip and push for a rebound toward the critical $3.00 level. The cross-border money remittance token currently holds above $2.45 at the time of writing on Monday.
The RSI backs the bullish outlook as it lifts above 40 on the daily chart. A potential break above the midline will affirm the bullish momentum, increasing the odds of a significant breakout. The 200-day EMA hurdle at $2.61 could mark a major shift from bearish to bullish.
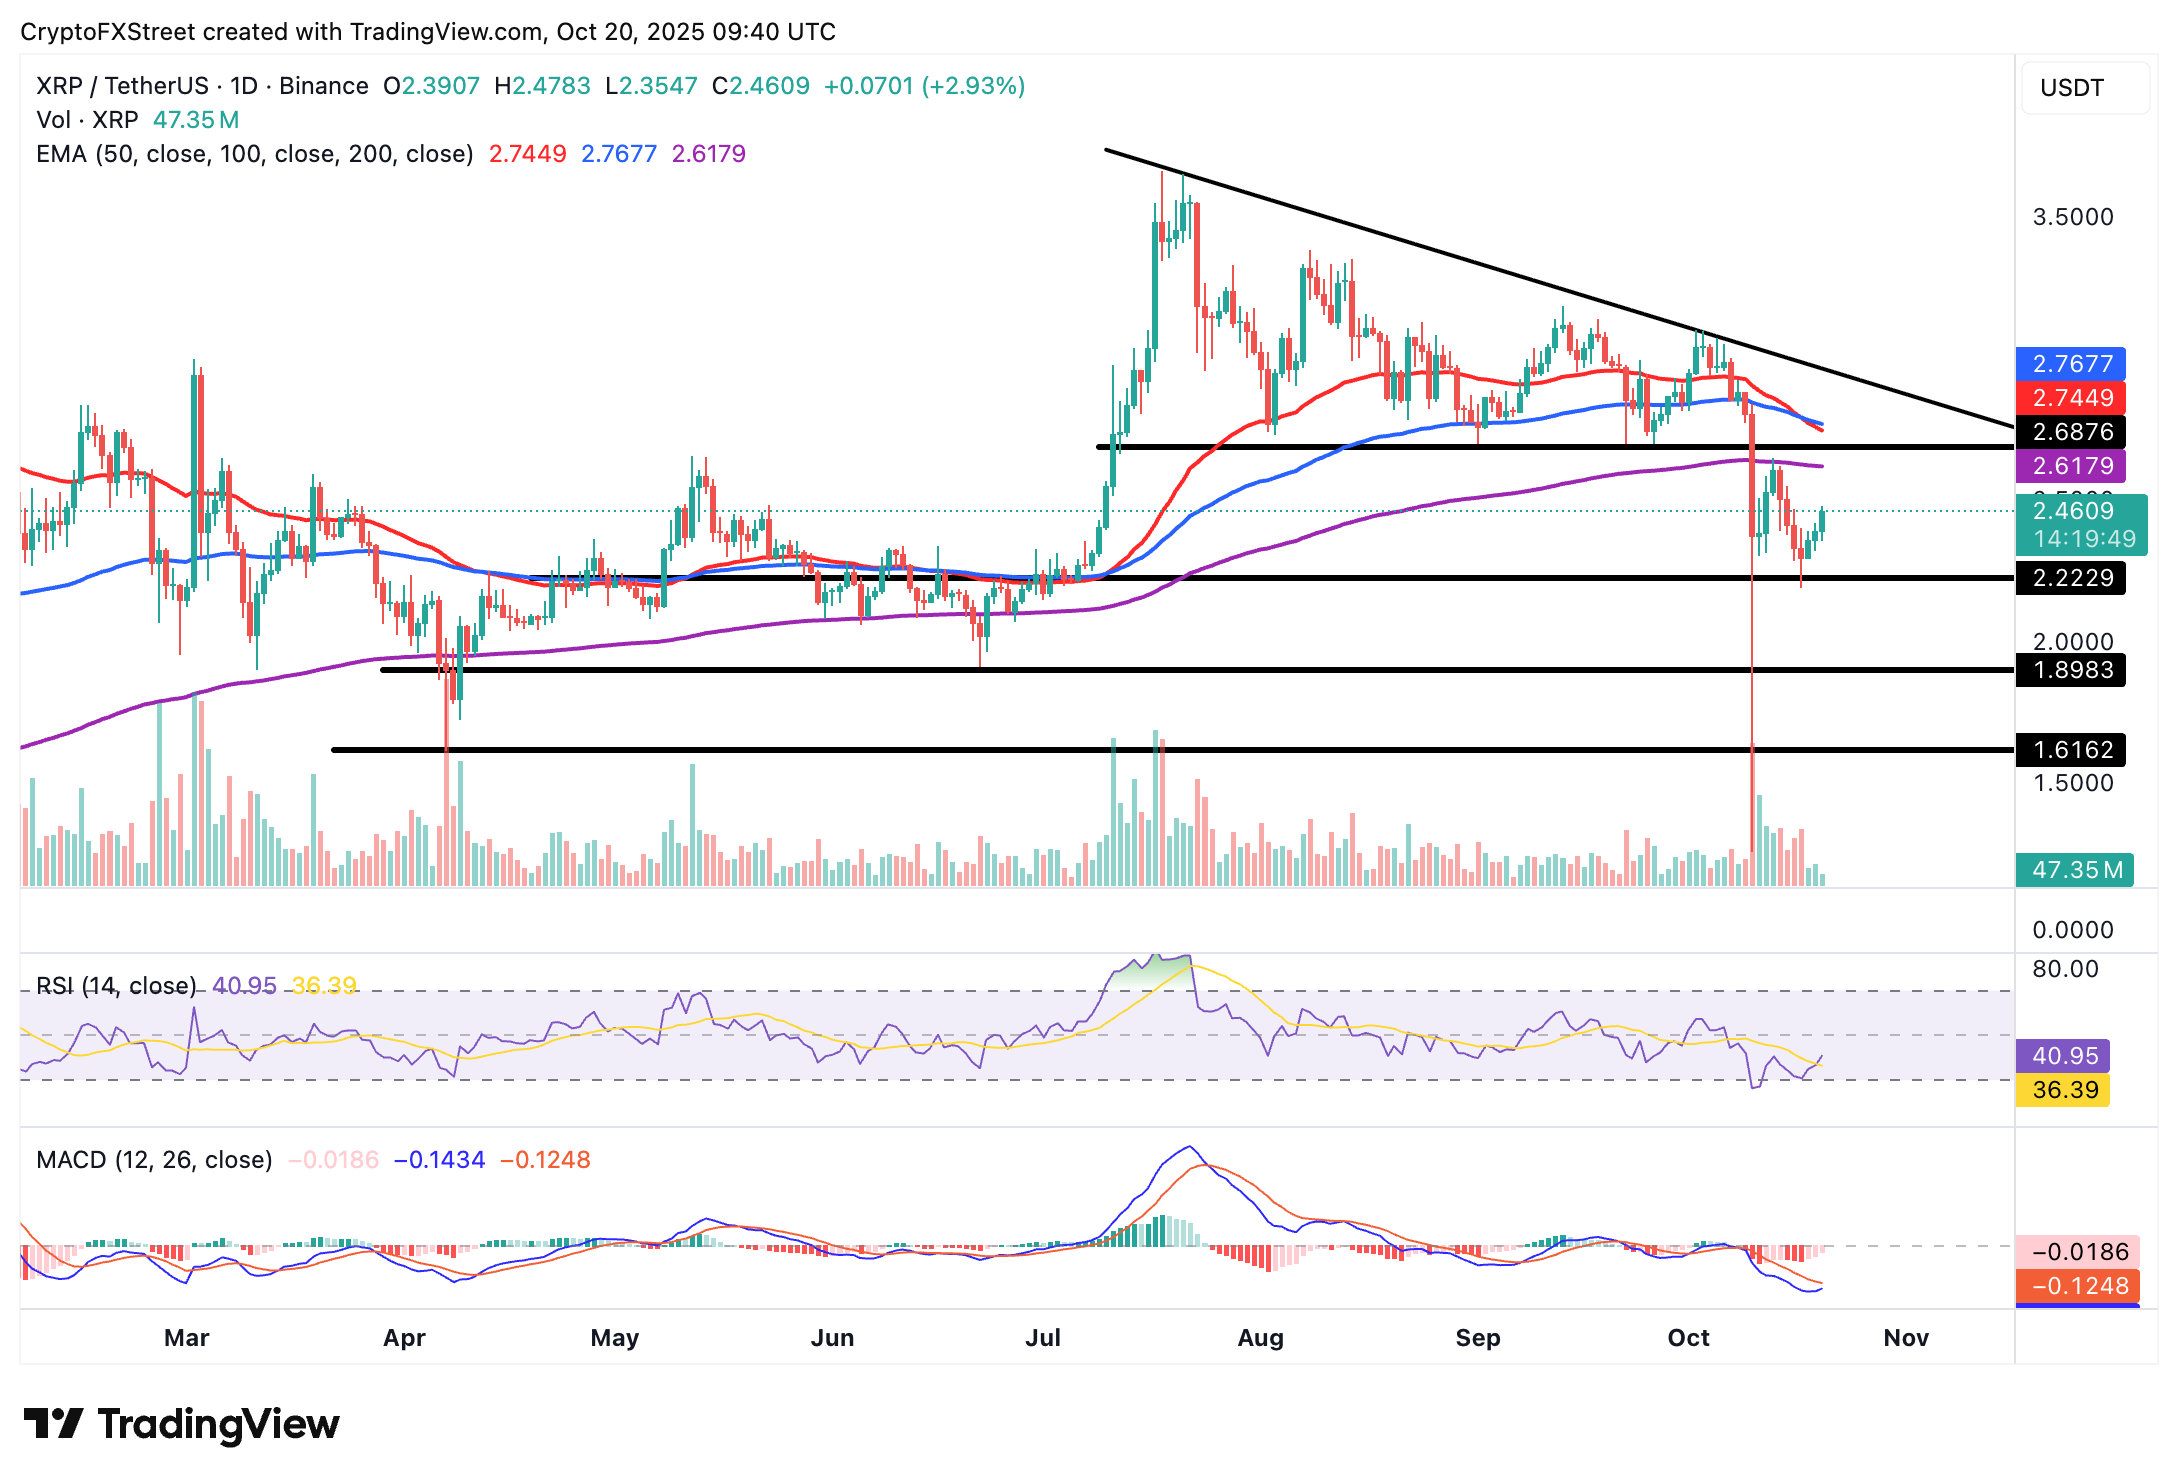
XRP/USDT daily chart
Still, short-term profit-taking could keep the XRP price suppressed. The demand at $2.22 highlights a major support that should be defended to prevent the down leg from the risk of stretching below $2.00.
Crypto ETF FAQs
An Exchange-Traded Fund (ETF) is an investment vehicle or an index that tracks the price of an underlying asset. ETFs can not only track a single asset, but a group of assets and sectors. For example, a Bitcoin ETF tracks Bitcoin’s price. ETF is a tool used by investors to gain exposure to a certain asset.
Yes. The first Bitcoin futures ETF in the US was approved by the US Securities & Exchange Commission in October 2021. A total of seven Bitcoin futures ETFs have been approved, with more than 20 still waiting for the regulator’s permission. The SEC says that the cryptocurrency industry is new and subject to manipulation, which is why it has been delaying crypto-related futures ETFs for the last few years.
Yes. The SEC approved in January 2024 the listing and trading of several Bitcoin spot Exchange-Traded Funds, opening the door to institutional capital and mainstream investors to trade the main crypto currency. The decision was hailed by the industry as a game changer.
The main advantage of crypto ETFs is the possibility of gaining exposure to a cryptocurrency without ownership, reducing the risk and cost of holding the asset. Other pros are a lower learning curve and higher security for investors since ETFs take charge of securing the underlying asset holdings. As for the main drawbacks, the main one is that as an investor you can’t have direct ownership of the asset, or, as they say in crypto, “not your keys, not your coins.” Other disadvantages are higher costs associated with holding crypto since ETFs charge fees for active management. Finally, even though investing in ETFs reduces the risk of holding an asset, price swings in the underlying cryptocurrency are likely to be reflected in the investment vehicle too.
Recommended Articles


