
3 Made In USA Coins To Watch For the End of October
As US markets brace for a pivotal week — with fresh CPI data expected soon, a likely Fed rate cut towards the end of October, and Jerome Powell’s remarks expected to steer global sentiment — traders are watching how crypto reacts to shifting policy signals.
Among the assets in focus are Made in USA coins, which often move sharply around major US events. Some now hint at early recoveries, while others risk deeper pullbacks, but not with twists.
Solana (SOL)
Among Made in USA coins, Solana continues to stand out as one of the more resilient altcoins despite recent volatility. The token is down 23% month-on-month, mainly due to the October 10 “Black Friday” crash.
Yet, it has gained over 2% in the past week, signaling steady recovery efforts.
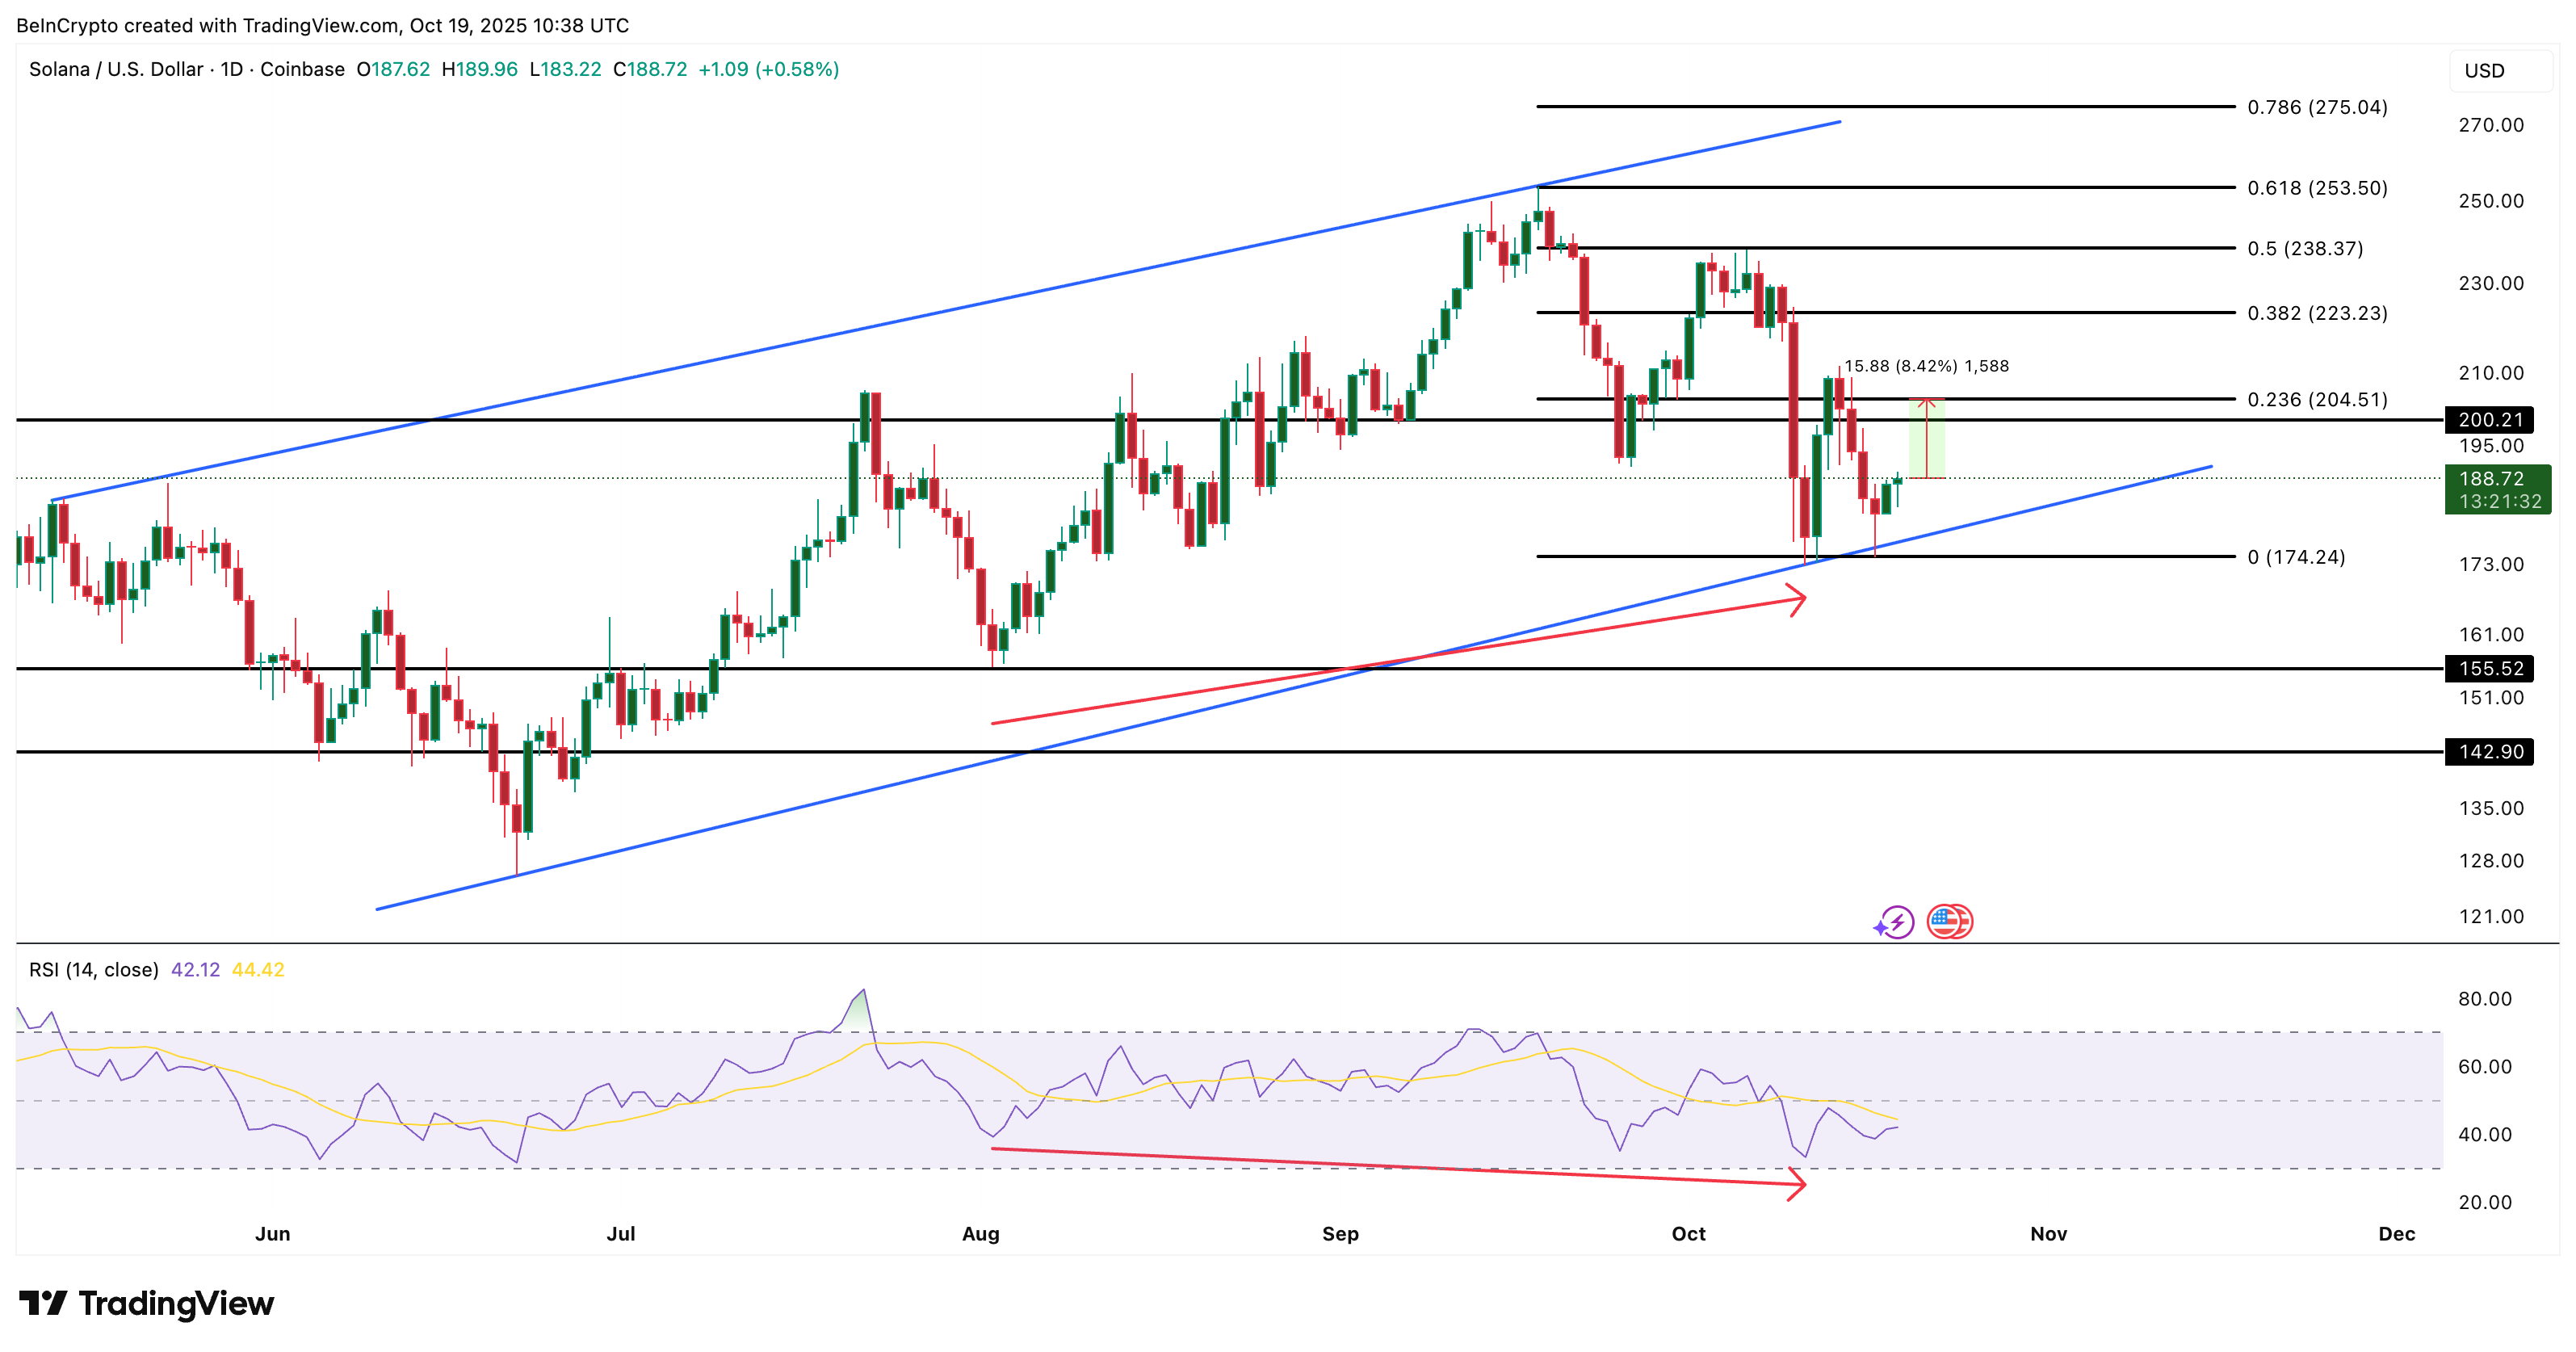
The broader structure still looks bullish. Solana has been moving inside an ascending channel pattern since May — a setup that often supports continuation trends.
If the Solana price breaks above $204 (an 8.4% rise), it could target $223 and $238 next. A clean move above $253 could potentially open the path toward new highs in the short to mid-term.
 Solana Price Analysis: TradingView
Want more token insights like this? Sign up for Editor Harsh Notariya’s Daily Crypto Newsletter here.
The Relative Strength Index (RSI) — which tracks how fast and strong price movements are — adds more weight to this view. Between August 7 and October 11, Solana’s price made a higher low, while RSI made a lower low.
This hidden bullish divergence usually confirms that the larger uptrend remains intact, even during short-term dips.
However, a daily close below $174 (the lower trendline of the channel) would weaken the pattern. It could send the Solana price toward $155 or even $142, marking a temporary loss of structure for one of the leading altcoins in focus this October.
Chainlink (LINK)
The next on the list of Made in USA coins is Chainlink, one of the few altcoins showing early signs of recovery despite sharp losses this month.
LINK has fallen over 30% in the past 30 days, hit by October’s market-wide crash, but it has managed to close the past 24 hours in green, hinting at early buying interest.
Part of this renewed momentum comes from strong on-chain accumulation. Whaler Talk data shows that over 270,000 LINK tokens (worth more than $4.6 million) were recently moved out of Binance wallets — a sign that large holders are possibly preparing for long-term positions.
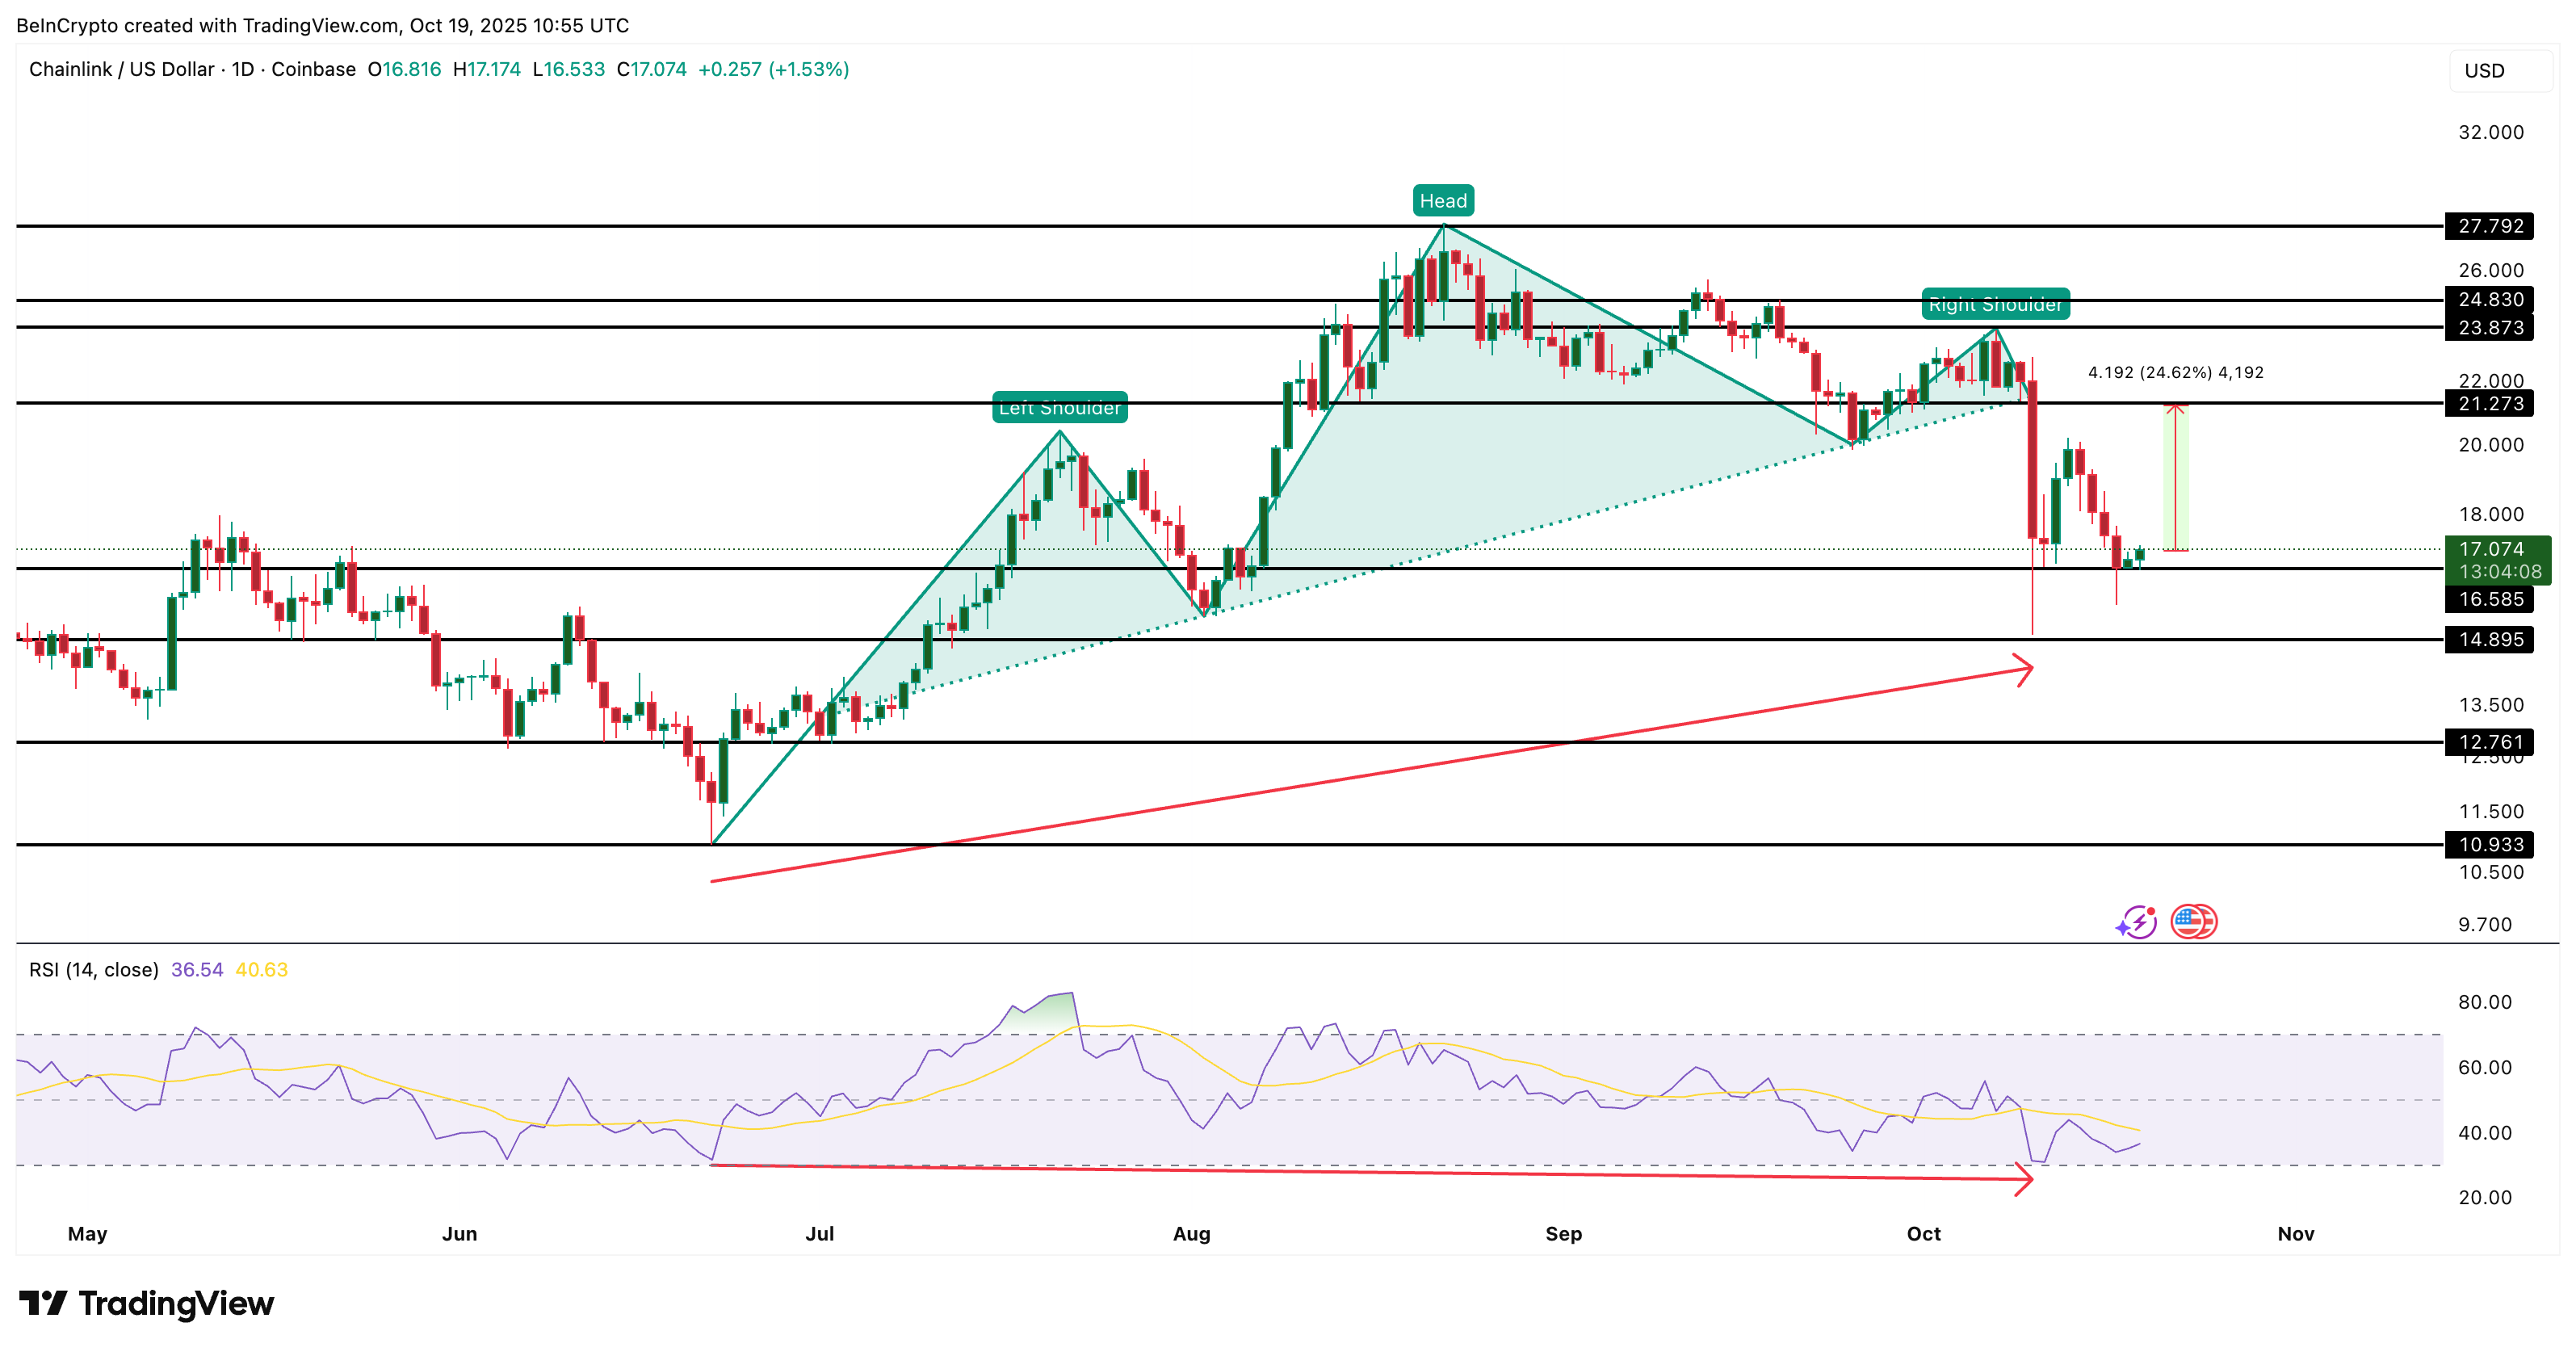
Technically, Chainlink broke below a head-and-shoulders pattern on October 10, with a neckline near $21, which led to a steep correction toward $14.
However, LINK has since rebounded, taking support at $16, a level that’s now proving to be a critical base for potential recovery.
Between June 22 and October 10, LINK’s price made a higher low while the Relative Strength Index (RSI) made a lower low. This hidden bullish divergence suggests that the larger uptrend, supported by LINK’s 50% yearly gain, remains intact despite recent weakness.
 LINK Price Analysis: TradingView
If LINK can close a daily candle above $21, it could trigger a move toward $24 and even $27. That could mark a minimum potential 24% near-term rally.
However, if the price dips below $16, the bullish structure could weaken. That would open a path to $14 and even $12, once again.
Stellar (XLM)
Among the Made in USA coins, Stellar (XLM) stands out for its growing real-world asset (RWA) focus. Yet, it is currently flashing a more complex setup, making it one of the more volatile altcoins in focus for October end.
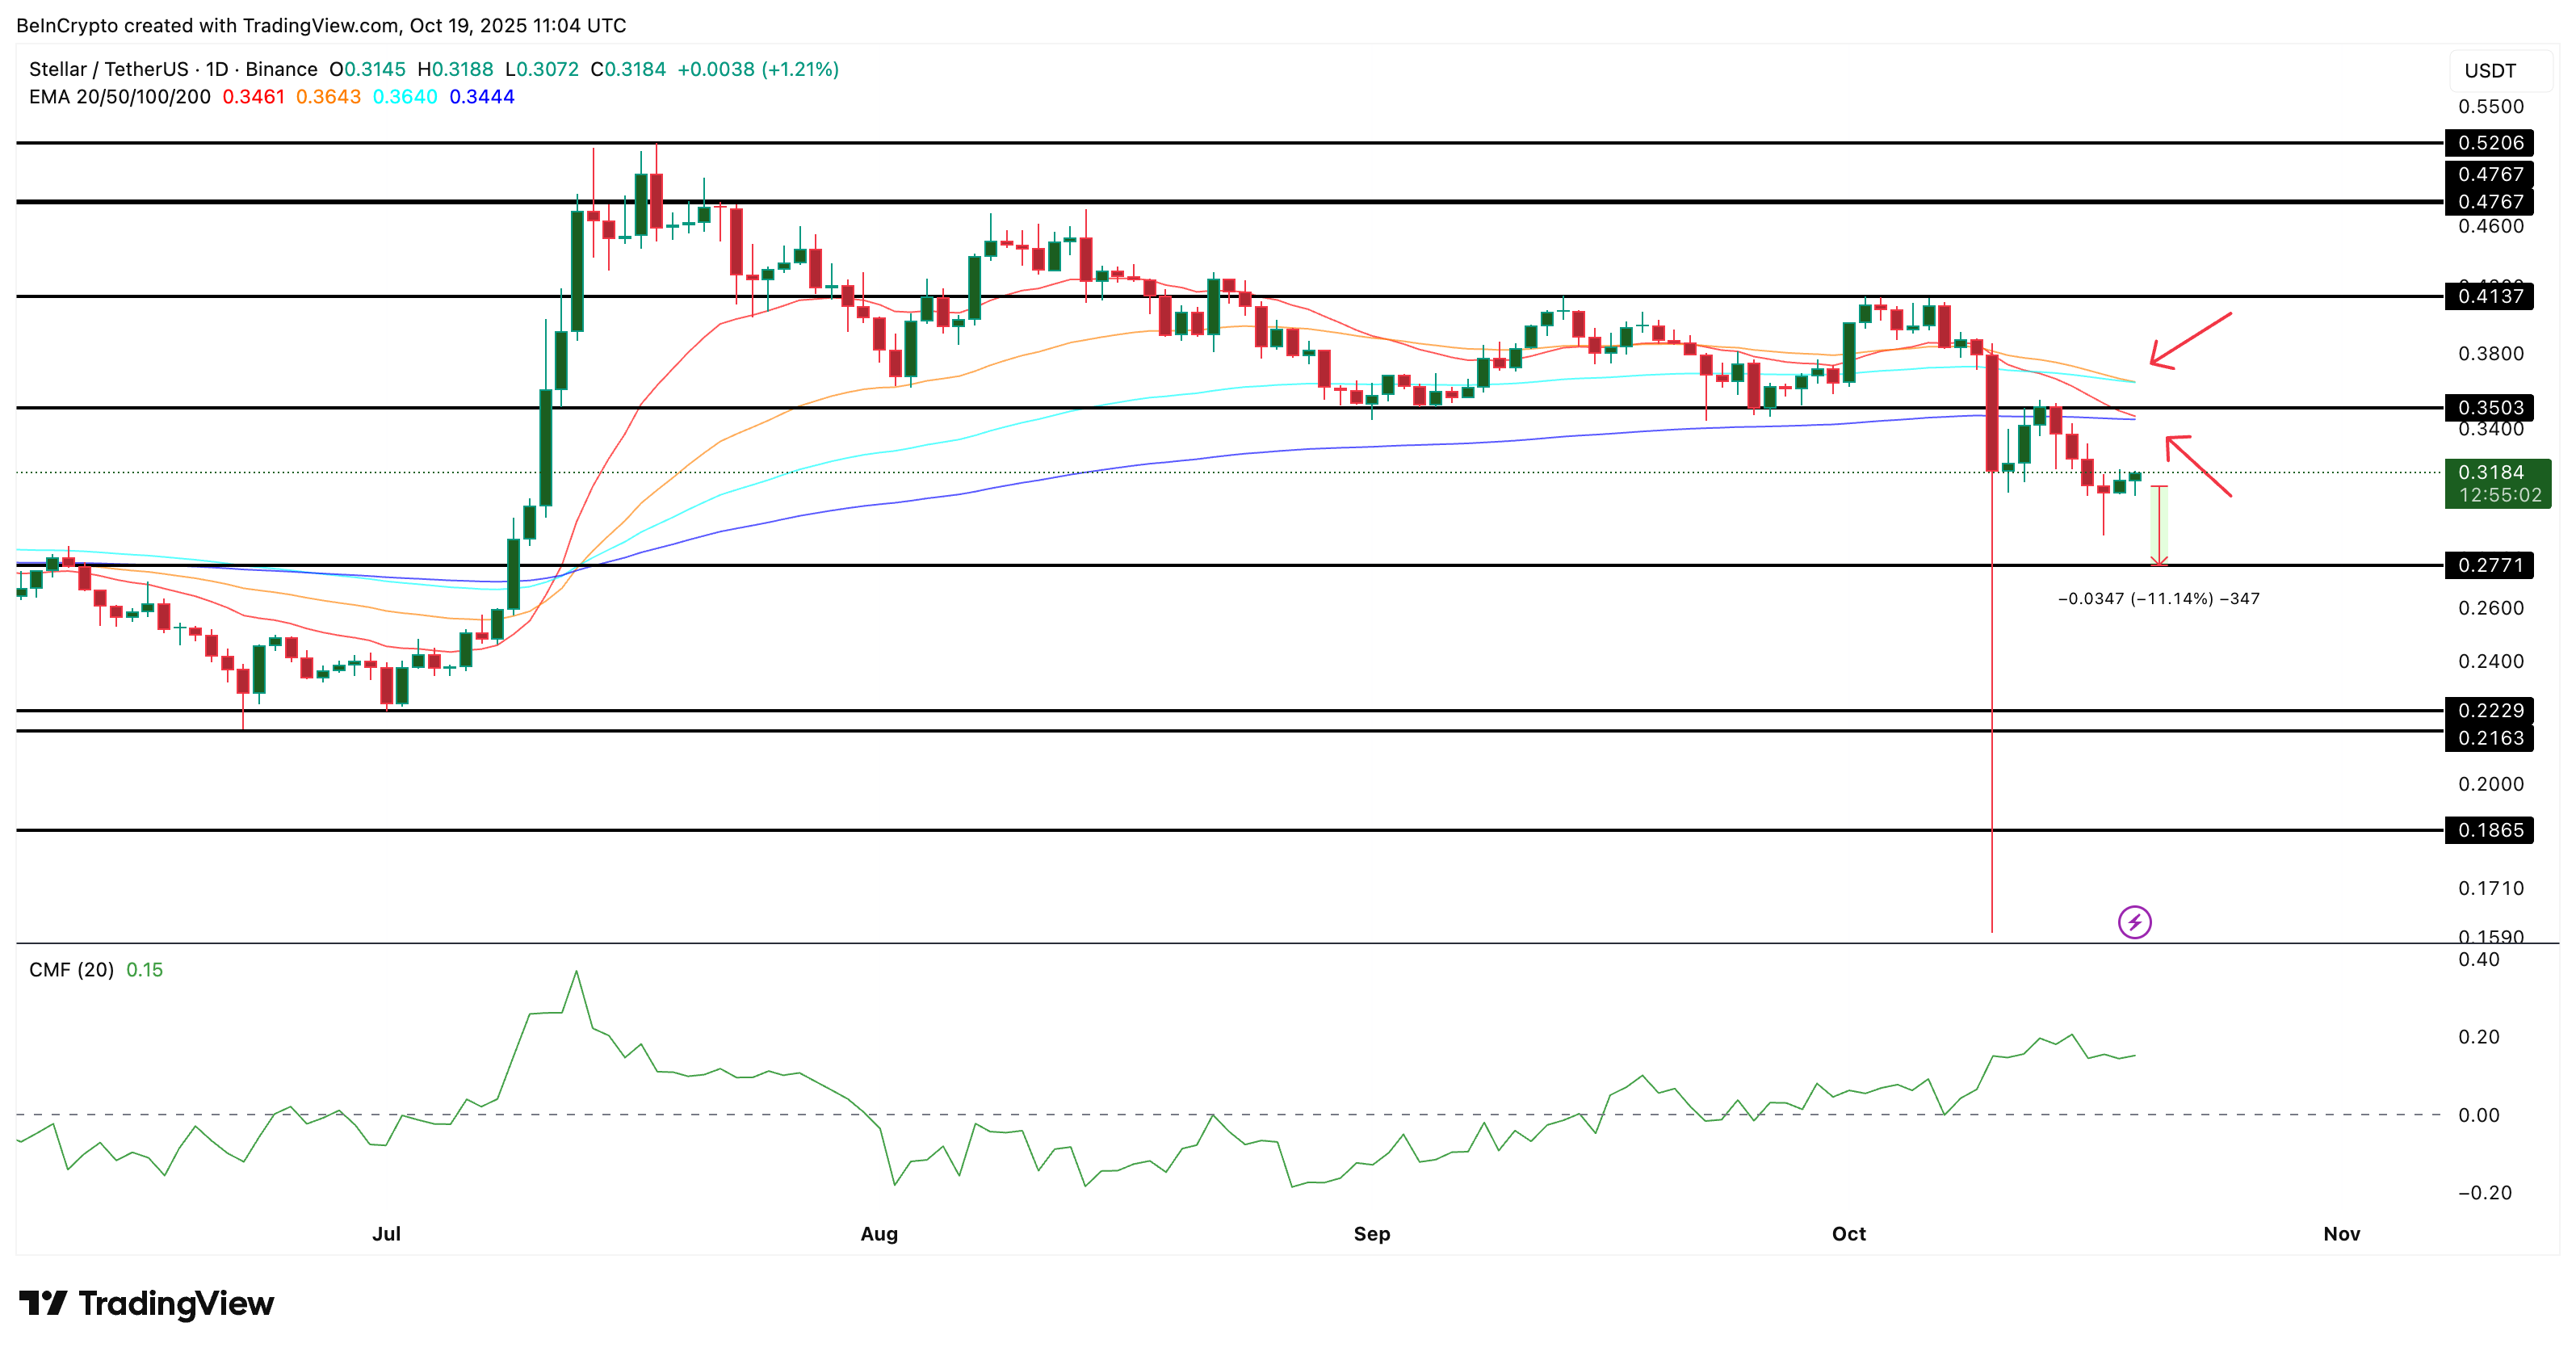
XLM trades near $0.31 and continues to see steady whale inflows. The Chaikin Money Flow (CMF), which measures money entering or leaving a token, has stayed above zero since October 7, showing that large investors are still adding positions despite the crash.
However, their optimism may be tested soon. On the daily chart, the 20-day Exponential Moving Average (EMA), the red line — a line that smooths short-term price data — is close to crossing below the 200-day EMA (deep blue line), while the 50-day EMA (orange) is nearing a crossover under the 100-day EMA (sky blue). These crossovers usually signal that sellers are gaining control.
If these two death crossovers take shape, it could reinforce bearish momentum, pushing XLM toward key support at $0.27 (an 11.4% dip).
A break below this level could expose $0.22 and even $0.18. But then, the bearish momentum could lose steam if the XLM price breaks $0.35 first.
 Stellar Price Analysis: TradingView
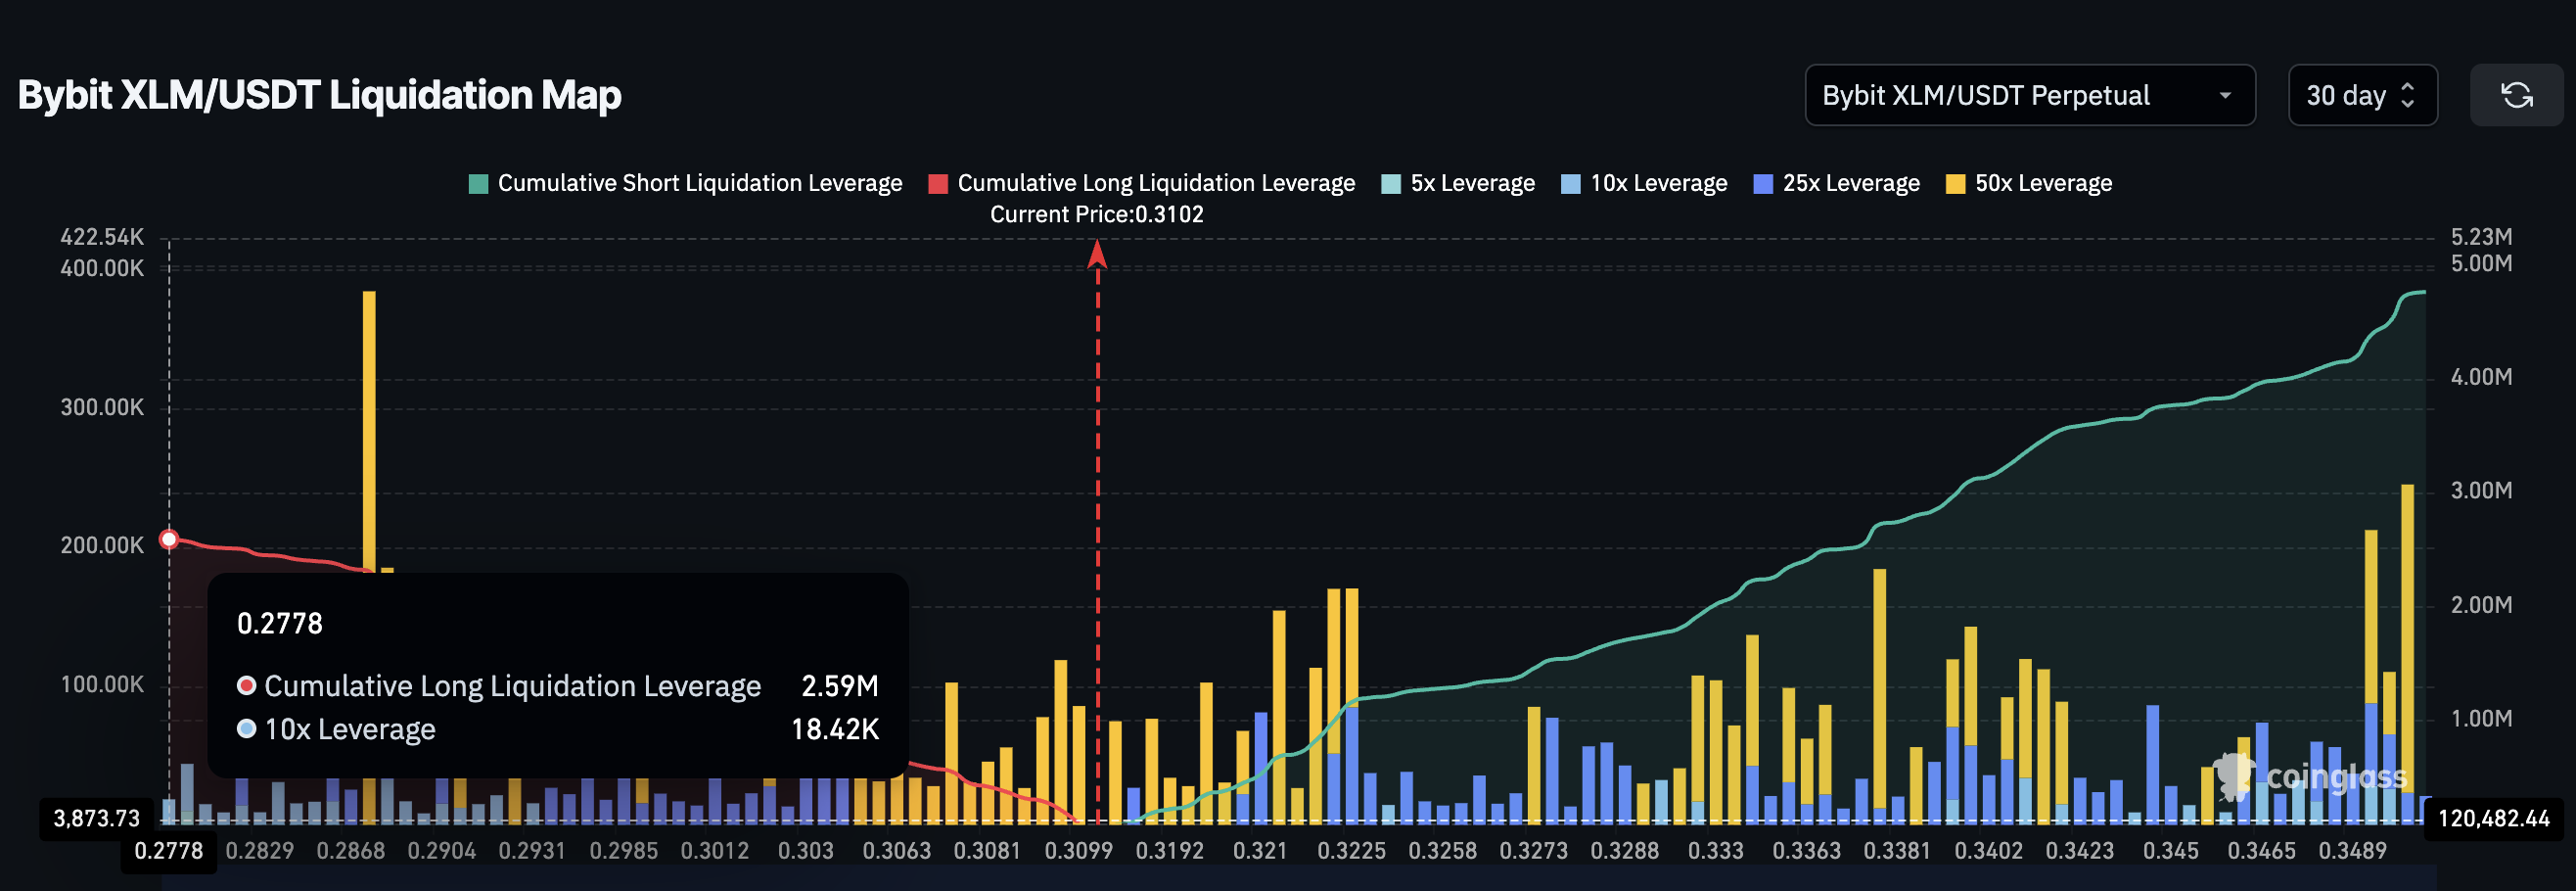
The twist lies in the derivatives market. Bybit’s liquidation map shows $4.74 million in short leverage against XLM, signaling that most traders are betting on a decline.
But there’s also $2.59 million in long leverage still active. If prices drop slightly, those long positions could get wiped out, invalidating whale optimism.
 XLM Liquidation Map: Coinglass
Meanwhile, if prices bounce and shorts start liquidating, a sharp squeeze could push XLM higher — especially if rate cuts come in.
For now, Stellar (XLM) remains the wild card among Made in USA coins. It is a token walking a fine line between misplaced confidence and a potential short squeeze.
Recommended Articles


