


Top 3 Price Prediction: Bitcoin, Ethereum, Ripple – BTC, ETH and XRP dip on profit taking
- Bitcoin price steadies around $121,000 on Wednesday after sliding more than 2.6% the previous day.
- Ethereum closes below the key support at $4,488, with bears targeting the next support at $4,232.
- XRP fails to find support around the previously broken bullish pattern, signaling a further correction ahead.
Bitcoin (BTC) price holds around $121,000 on Wednesday, following a drop the previous day. At the same time, Ethereum (ETH) and Ripple (XRP) followed BTC’s footsteps and corrected 5% and 4%, respectively, trading below their key support levels, hinting at further downside pressure.
This correction in the top three cryptocurrencies comes amid holders realizing profits. Santiments’ Network Realized Profit/Loss (NPL), which computes a daily network-level Return On Investment (ROI) based on the coin’s on-chain transaction volume. Strong spikes in a coin’s NPL indicate that its holders are, on average, selling their bags at a significant profit. On the other hand, strong dips imply that the coin’s holders are, on average, realizing losses, suggesting panic sell-offs and investor capitulation.
The metric showed a spike on Monday for BTC, ETH and XRP, indicating that holders are, on average, selling their bags at a significant profit and increasing the selling pressure.
 [07-1759892403332-1759892403334.49.27, 08 Oct, 2025].png)
NPL chart for BTC, ETH and XRP. Source: Santiment
Bitcoin dips after reaching a record high
Bitcoin reached a new all-time high of $126,199 on Monday after surging more than 10% in the previous week. However, BTC failed to continue its rally and corrected by 2.67% on Tuesday. At the time of writing on Wednesday, BTC hovers around $121,000.
If BTC continues its correction and closes below $120,000, it could extend the decline toward the next daily support level at $116,000.
The Relative Strength Index (RSI) on the daily chart reads 63 after falling from the overbought conditions on Monday, indicating a potential slowdown in bullish momentum and the likelihood of short-term consolidation.
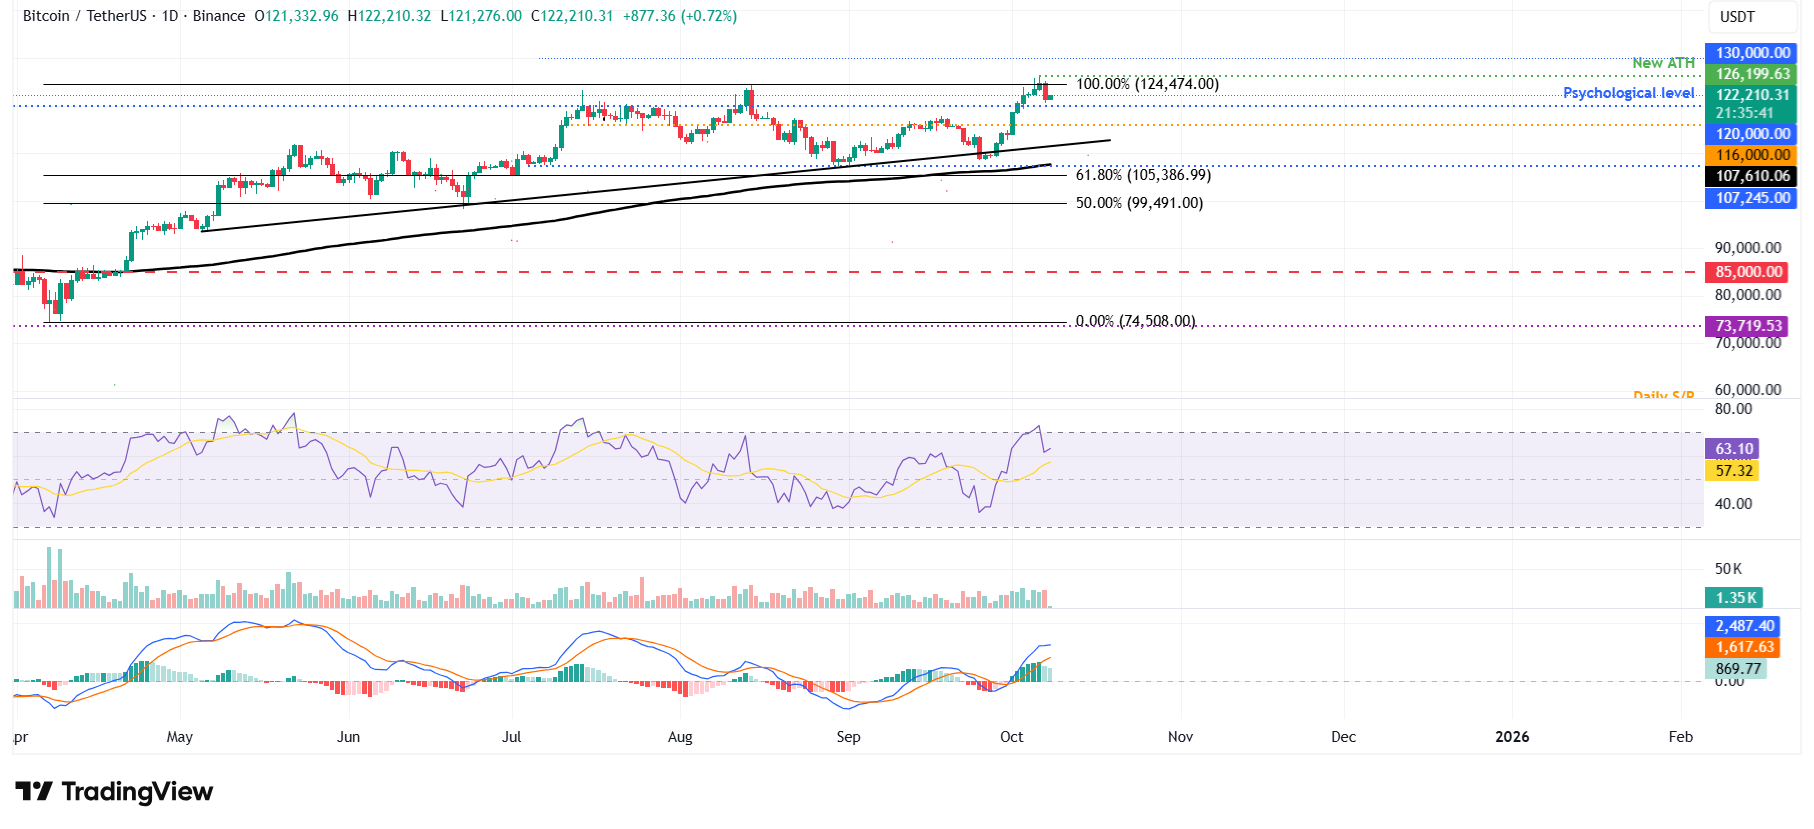
BTC/USDT daily chart
However, if BTC maintains its upward momentum, it could extend the rally toward the record high of $126,199.
Ethereum closes below the $4,488 support level
Ethereum price broke above the daily resistance of $4,488 on Friday, found support around it and rose by 4.5% in the next three days. However, on Tuesday, ETH corrected 5% and closed below the $4,488 level. At the time of writing on Wednesday, it hovers at around $4,491.
If ETH continues its pullback, it could extend the decline toward the next daily support at $4,232.
The RSI on the daily chart reads 54 and points downward toward the neutral level of 50, indicating a slowdown in bullish momentum.
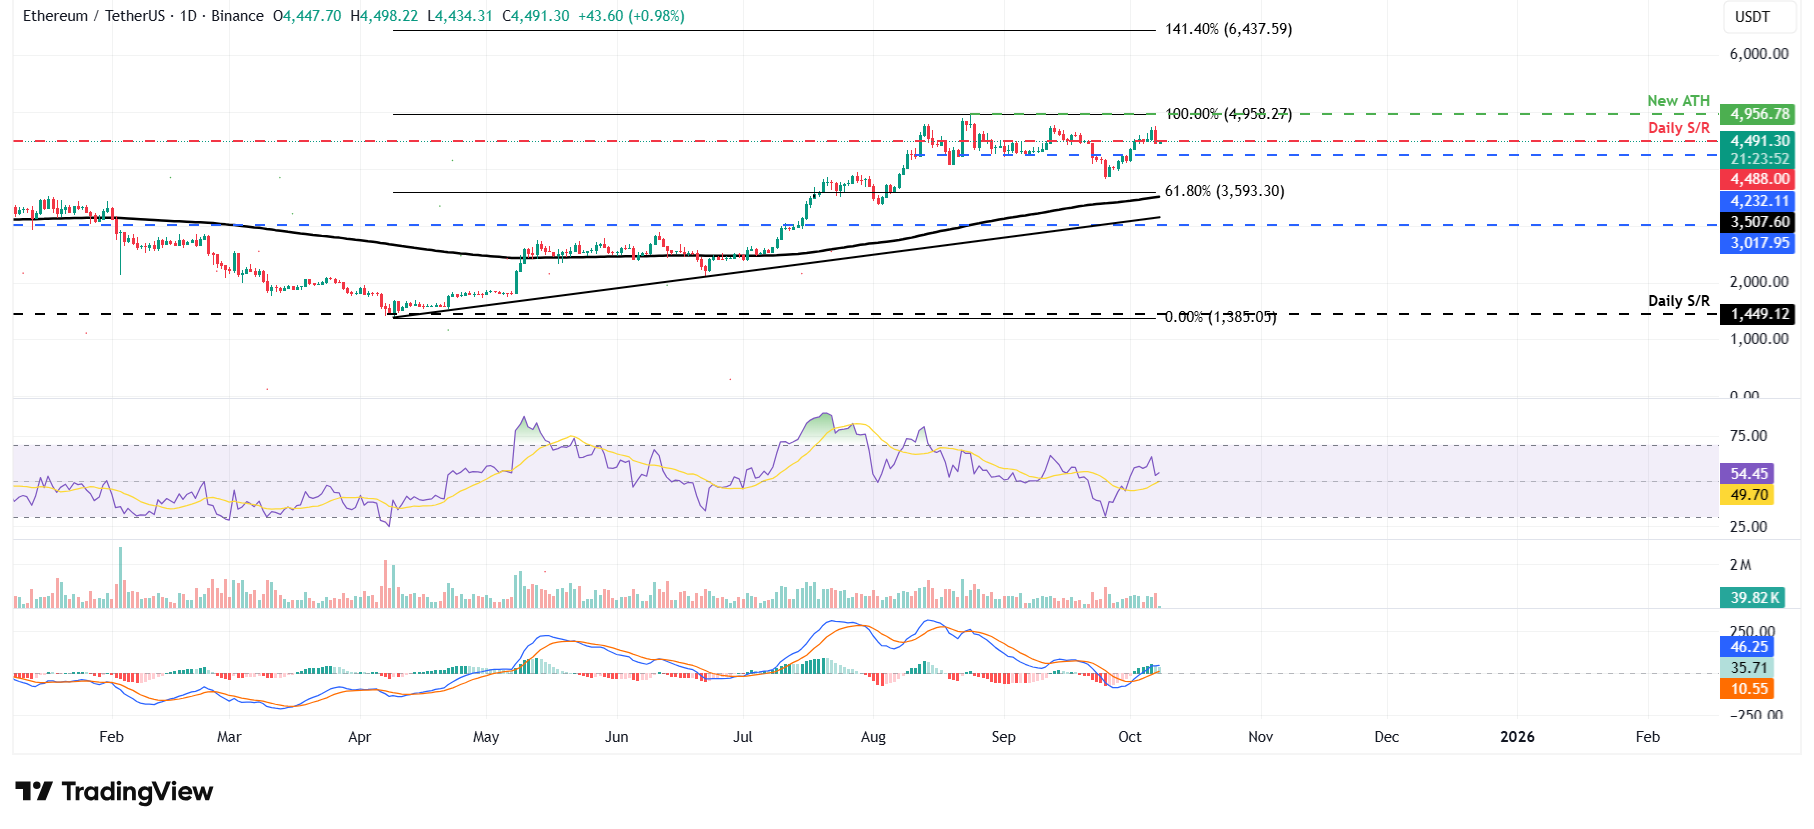
ETH/USDT daily chart
However, if ETH breaks above the $4,488 level and finds support around it, the rally could extend toward the all-time high at $4,956.
XRP fails to find support around the key level
XRP price breaks above the falling wedge pattern (drawn by joining multiple lows and highs with two trendlines since mid-July) on Thursday. However, XRP retested and found support around the upper trendline boundary in the next three days. On Tuesday, XRP corrected nearly 5% and closed below this support level. At the time of writing on Wednesday, it hovers around $2.87.
If XRP continues its correction, it could extend the decline toward the daily support level at $2.72.

XRP/USDT daily chart
However, if XRP recovers, it could extend the rally toward the daily resistance at $3.40.
Bitcoin, altcoins, stablecoins FAQs
Bitcoin is the largest cryptocurrency by market capitalization, a virtual currency designed to serve as money. This form of payment cannot be controlled by any one person, group, or entity, which eliminates the need for third-party participation during financial transactions.
Altcoins are any cryptocurrency apart from Bitcoin, but some also regard Ethereum as a non-altcoin because it is from these two cryptocurrencies that forking happens. If this is true, then Litecoin is the first altcoin, forked from the Bitcoin protocol and, therefore, an “improved” version of it.
Stablecoins are cryptocurrencies designed to have a stable price, with their value backed by a reserve of the asset it represents. To achieve this, the value of any one stablecoin is pegged to a commodity or financial instrument, such as the US Dollar (USD), with its supply regulated by an algorithm or demand. The main goal of stablecoins is to provide an on/off-ramp for investors willing to trade and invest in cryptocurrencies. Stablecoins also allow investors to store value since cryptocurrencies, in general, are subject to volatility.
Bitcoin dominance is the ratio of Bitcoin's market capitalization to the total market capitalization of all cryptocurrencies combined. It provides a clear picture of Bitcoin’s interest among investors. A high BTC dominance typically happens before and during a bull run, in which investors resort to investing in relatively stable and high market capitalization cryptocurrency like Bitcoin. A drop in BTC dominance usually means that investors are moving their capital and/or profits to altcoins in a quest for higher returns, which usually triggers an explosion of altcoin rallies.
Recommended Articles


