


What To Expect From HBAR Price In October 2025
Historically, Hedera Hashgraph’s native token HBAR has delivered a mixed performance in October. Over the past six years, its track record has been evenly split between gains and losses.
The standout was 2021, when HBAR rallied 20.3%, followed by smaller gains of 3.98% in 2022 and 5.40% in 2023. On the downside, October has also brought steep declines, including a 19.4% dip in 2024 and a back-to-back decline in 2019 and 2020. As downside risks grow, the question remains: how will HBAR perform in October 2025?
HBAR Struggles After Early September Gains
September started on a positive note for HBAR, driven by the broader market uptrend that lifted its price to a monthly peak of $0.2551 on September 13.
However, as market sentiment cooled, the token entered a consolidation phase between September 14 and 18 before bears regained control.
Since then, HBAR has slipped nearly 16%, erasing most of its earlier gains. On the daily chart, readings from the Moving Average Convergence Divergence (MACD) indicator confirm that the token is firmly in a bearish phase.
At press time, the MACD line (blue) rests below the signal line (orange), showing that the bears have the upper hand.
For token TA and market updates: Want more token insights like this? Sign up for Editor Harsh Notariya’s Daily Crypto Newsletter here.
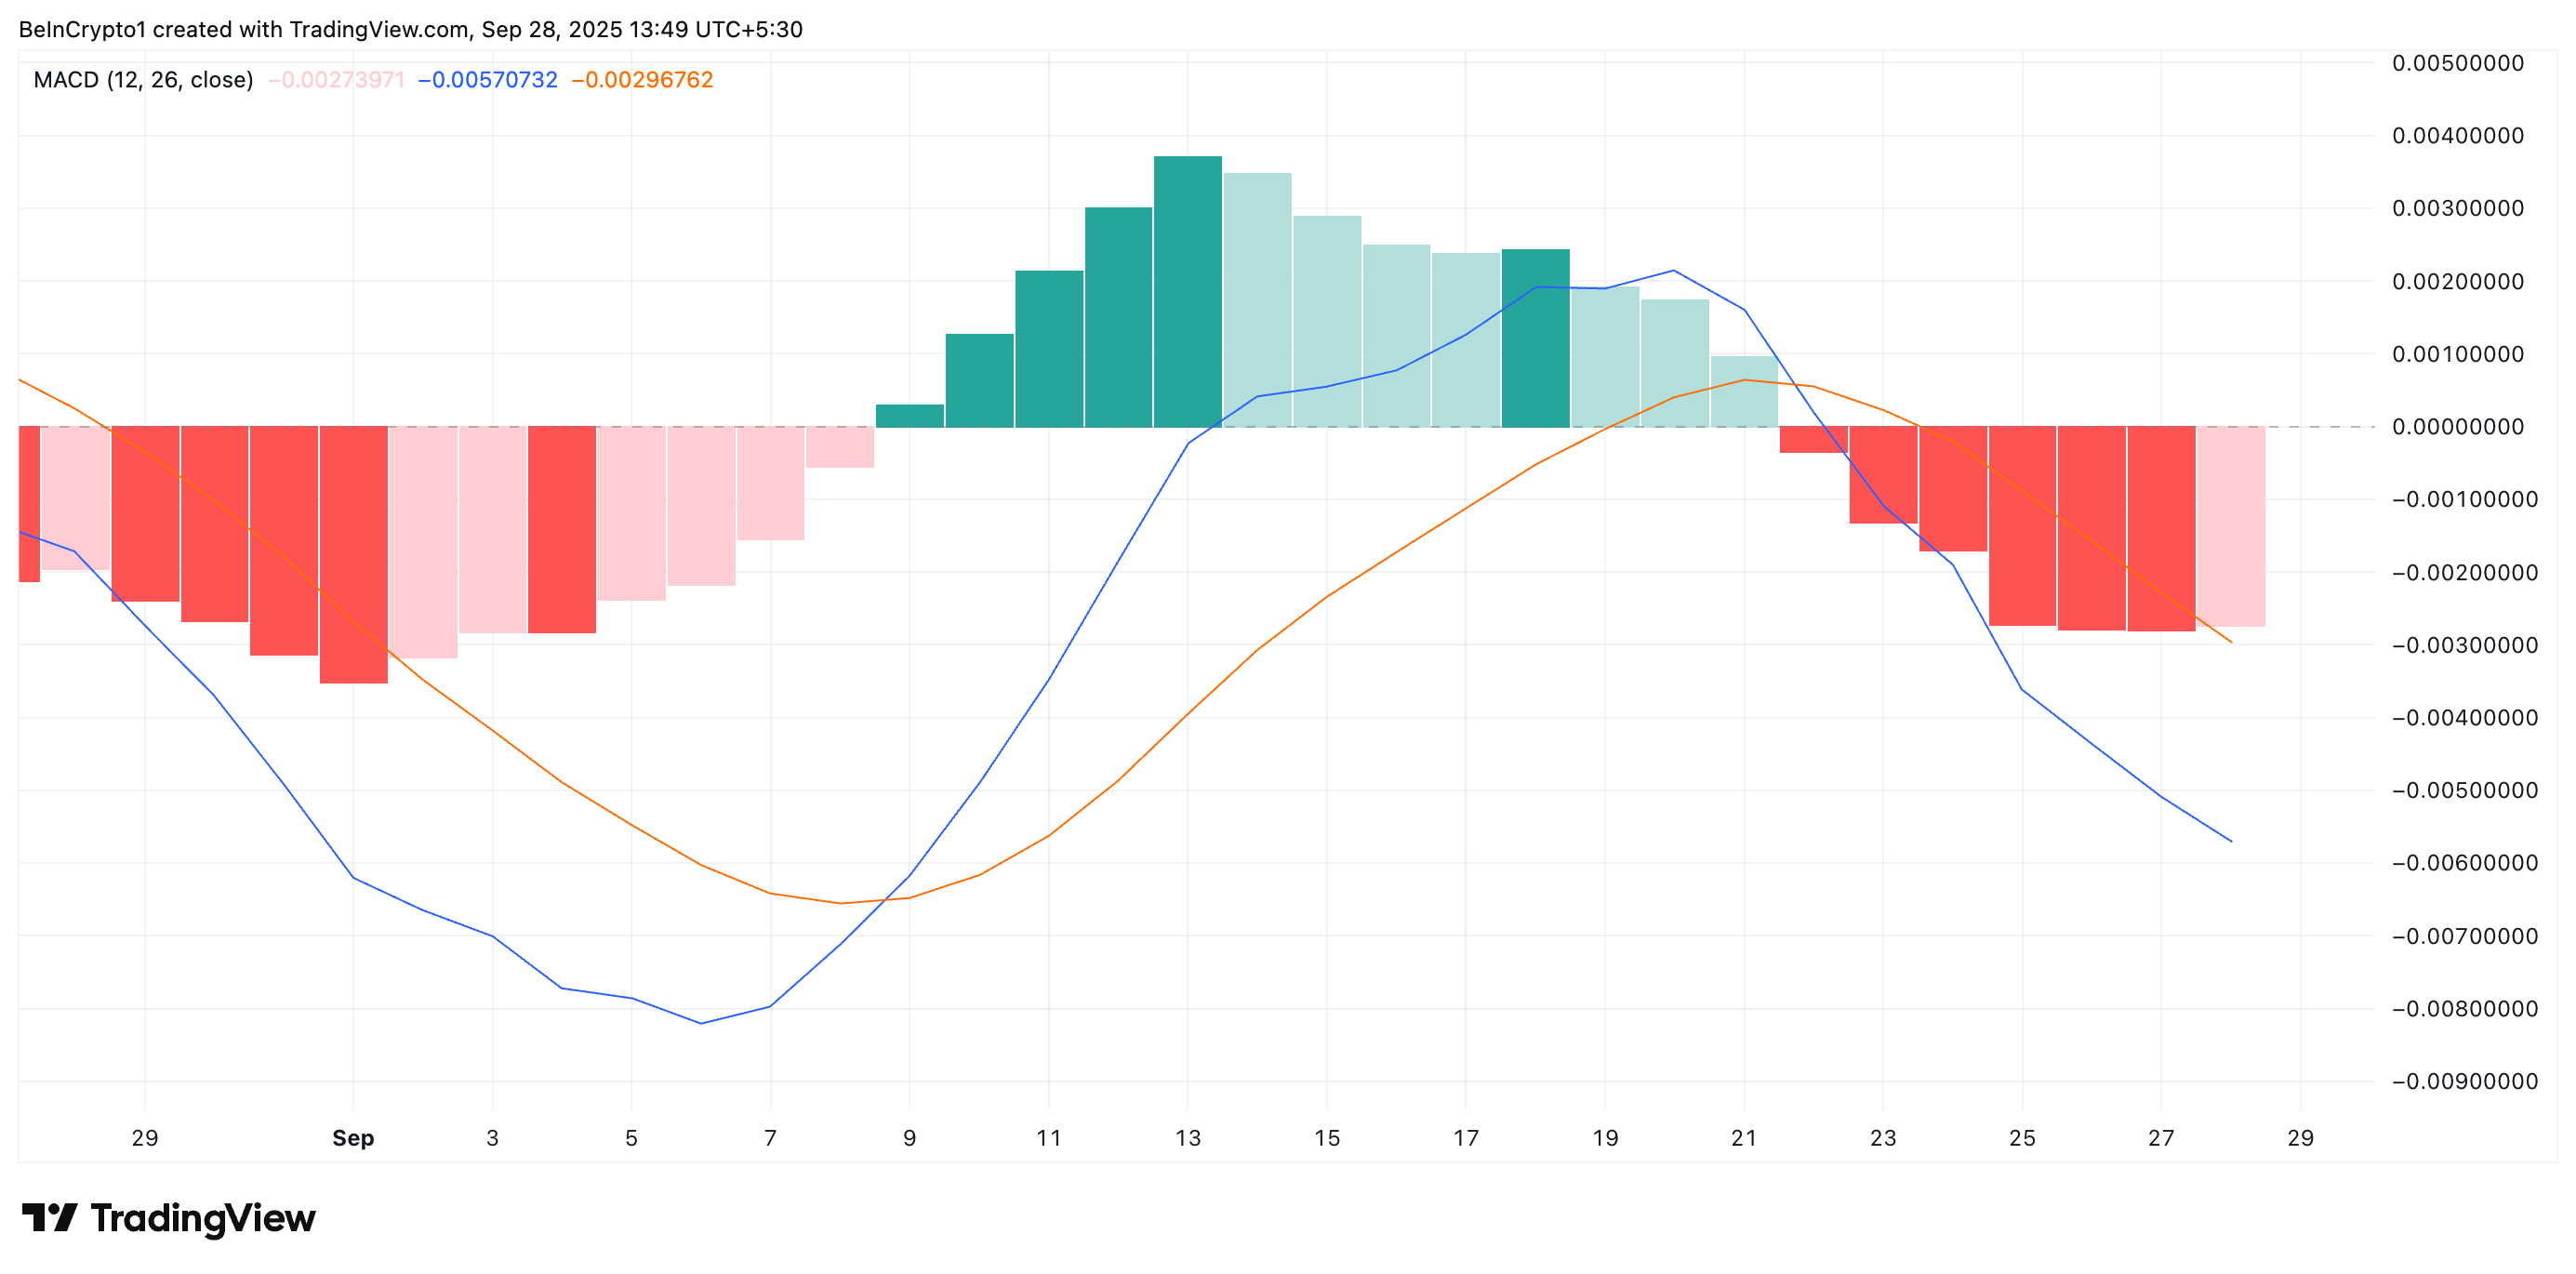 HBAR MACD. Source: TradingView
The MACD indicator identifies trends and momentum in its price movement. It helps traders spot potential buy or sell signals through crossovers between the MACD and signal lines.
When the MACD line crosses above the signal line, it indicates bullish momentum and the possibility of upward price action. Conversely, when the MACD line rests below the signal line—as is the case for HBAR—it signals that bearish momentum is dominant.
This setup suggests that without a bullish catalyst, the selling pressure observed through late September could extend well into October.
Adding to this pressure, market sentiment around HBAR remains decisively negative. According to Santiment’s data, it currently stands at -0.719.
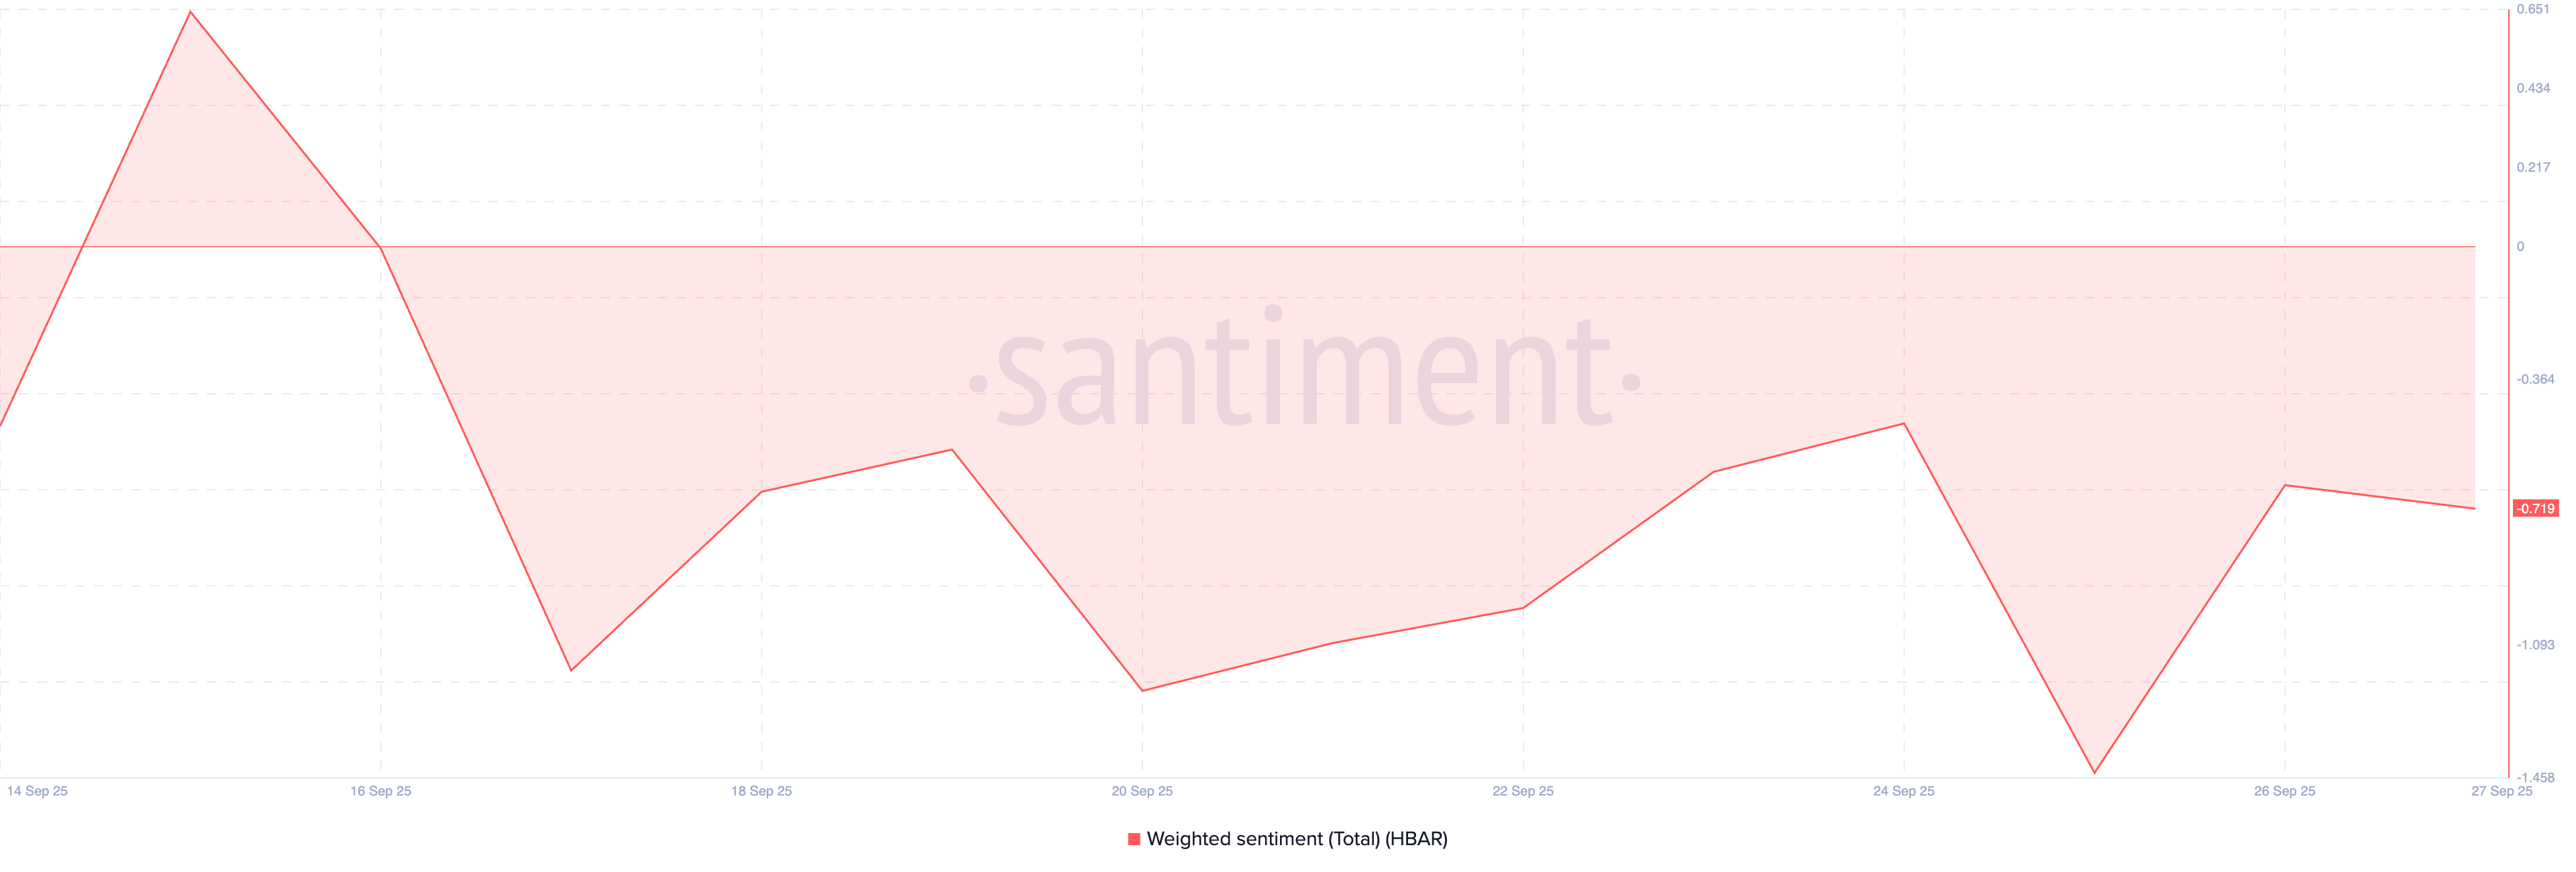 HBAR Weighted Sentiment. Source: Santiment
Weighted sentiment tracks discussions about a cryptocurrency across social media and online platforms. It measures the volume of mentions and the balance of positive versus negative comments.
When weighted sentiment is above zero, it indicates more positive comments and discussions about the cryptocurrency than negative ones, suggesting a favorable public perception.
On the other hand, a negative reading indicates more criticism than support, reflecting bearish sentiment. Hence, HBAR’s sustained negative weighted sentiment reflects the broader market bias against the token heading into October. This may cause its price troubles to persist.
HBAR Futures Traders Turn Bearish
Among futures traders, the token’s plunging long/short ratio supports this bearish outlook. At press time, it is 0.84 and remains in a downtrend.
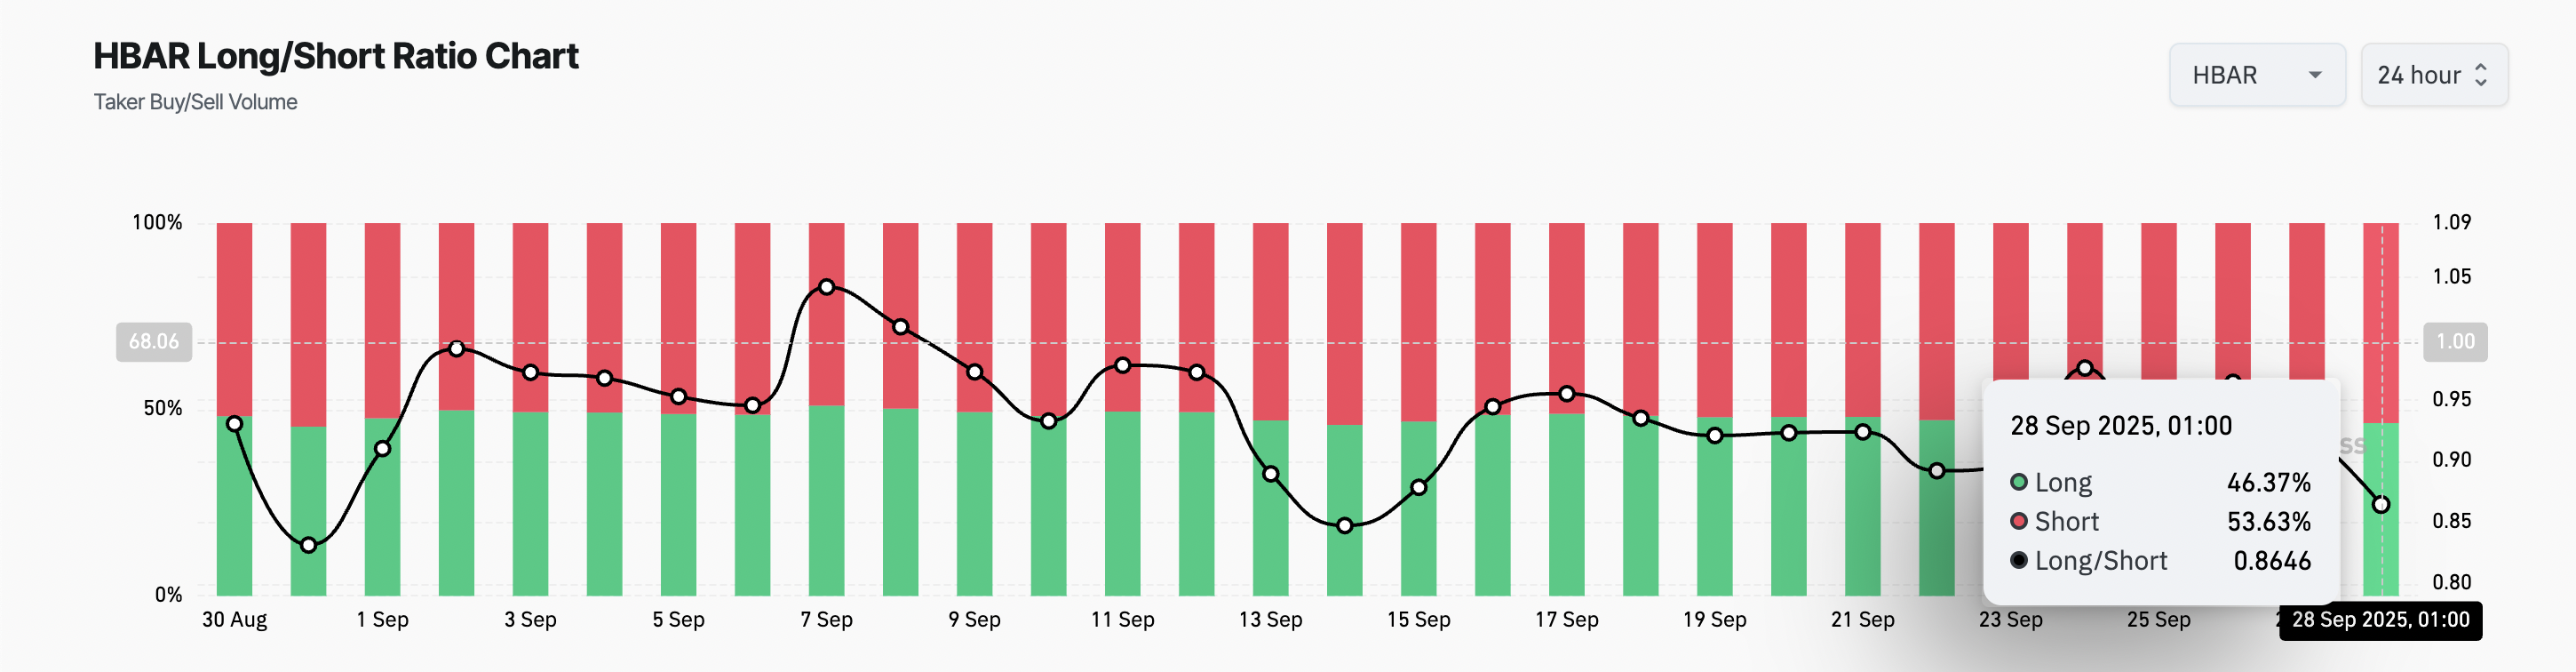 HBAR Long/Short Ratio. Source: Coinglass
The long/short ratio measures the balance between bullish and bearish positions in an asset’s futures market. A value above 1 indicates that more traders are betting on price gains (longs) than declines (shorts), reflecting positive sentiment.
Conversely, a ratio below 1 shows that bearish bets outweigh bullish ones, signaling that traders expect further downside. With HBAR’s ratio well under 1, its futures traders are overwhelmingly positioned for losses rather than recovery.
HBAR Faces October Test
These trends add to the bearish pressure already weighing on the token, making it more likely that October will continue HBAR’s losing streak unless a significant shift in sentiment emerges.
HBAR could extend its weekly decline and fall toward $0.1654 if bearish sentiment grows.
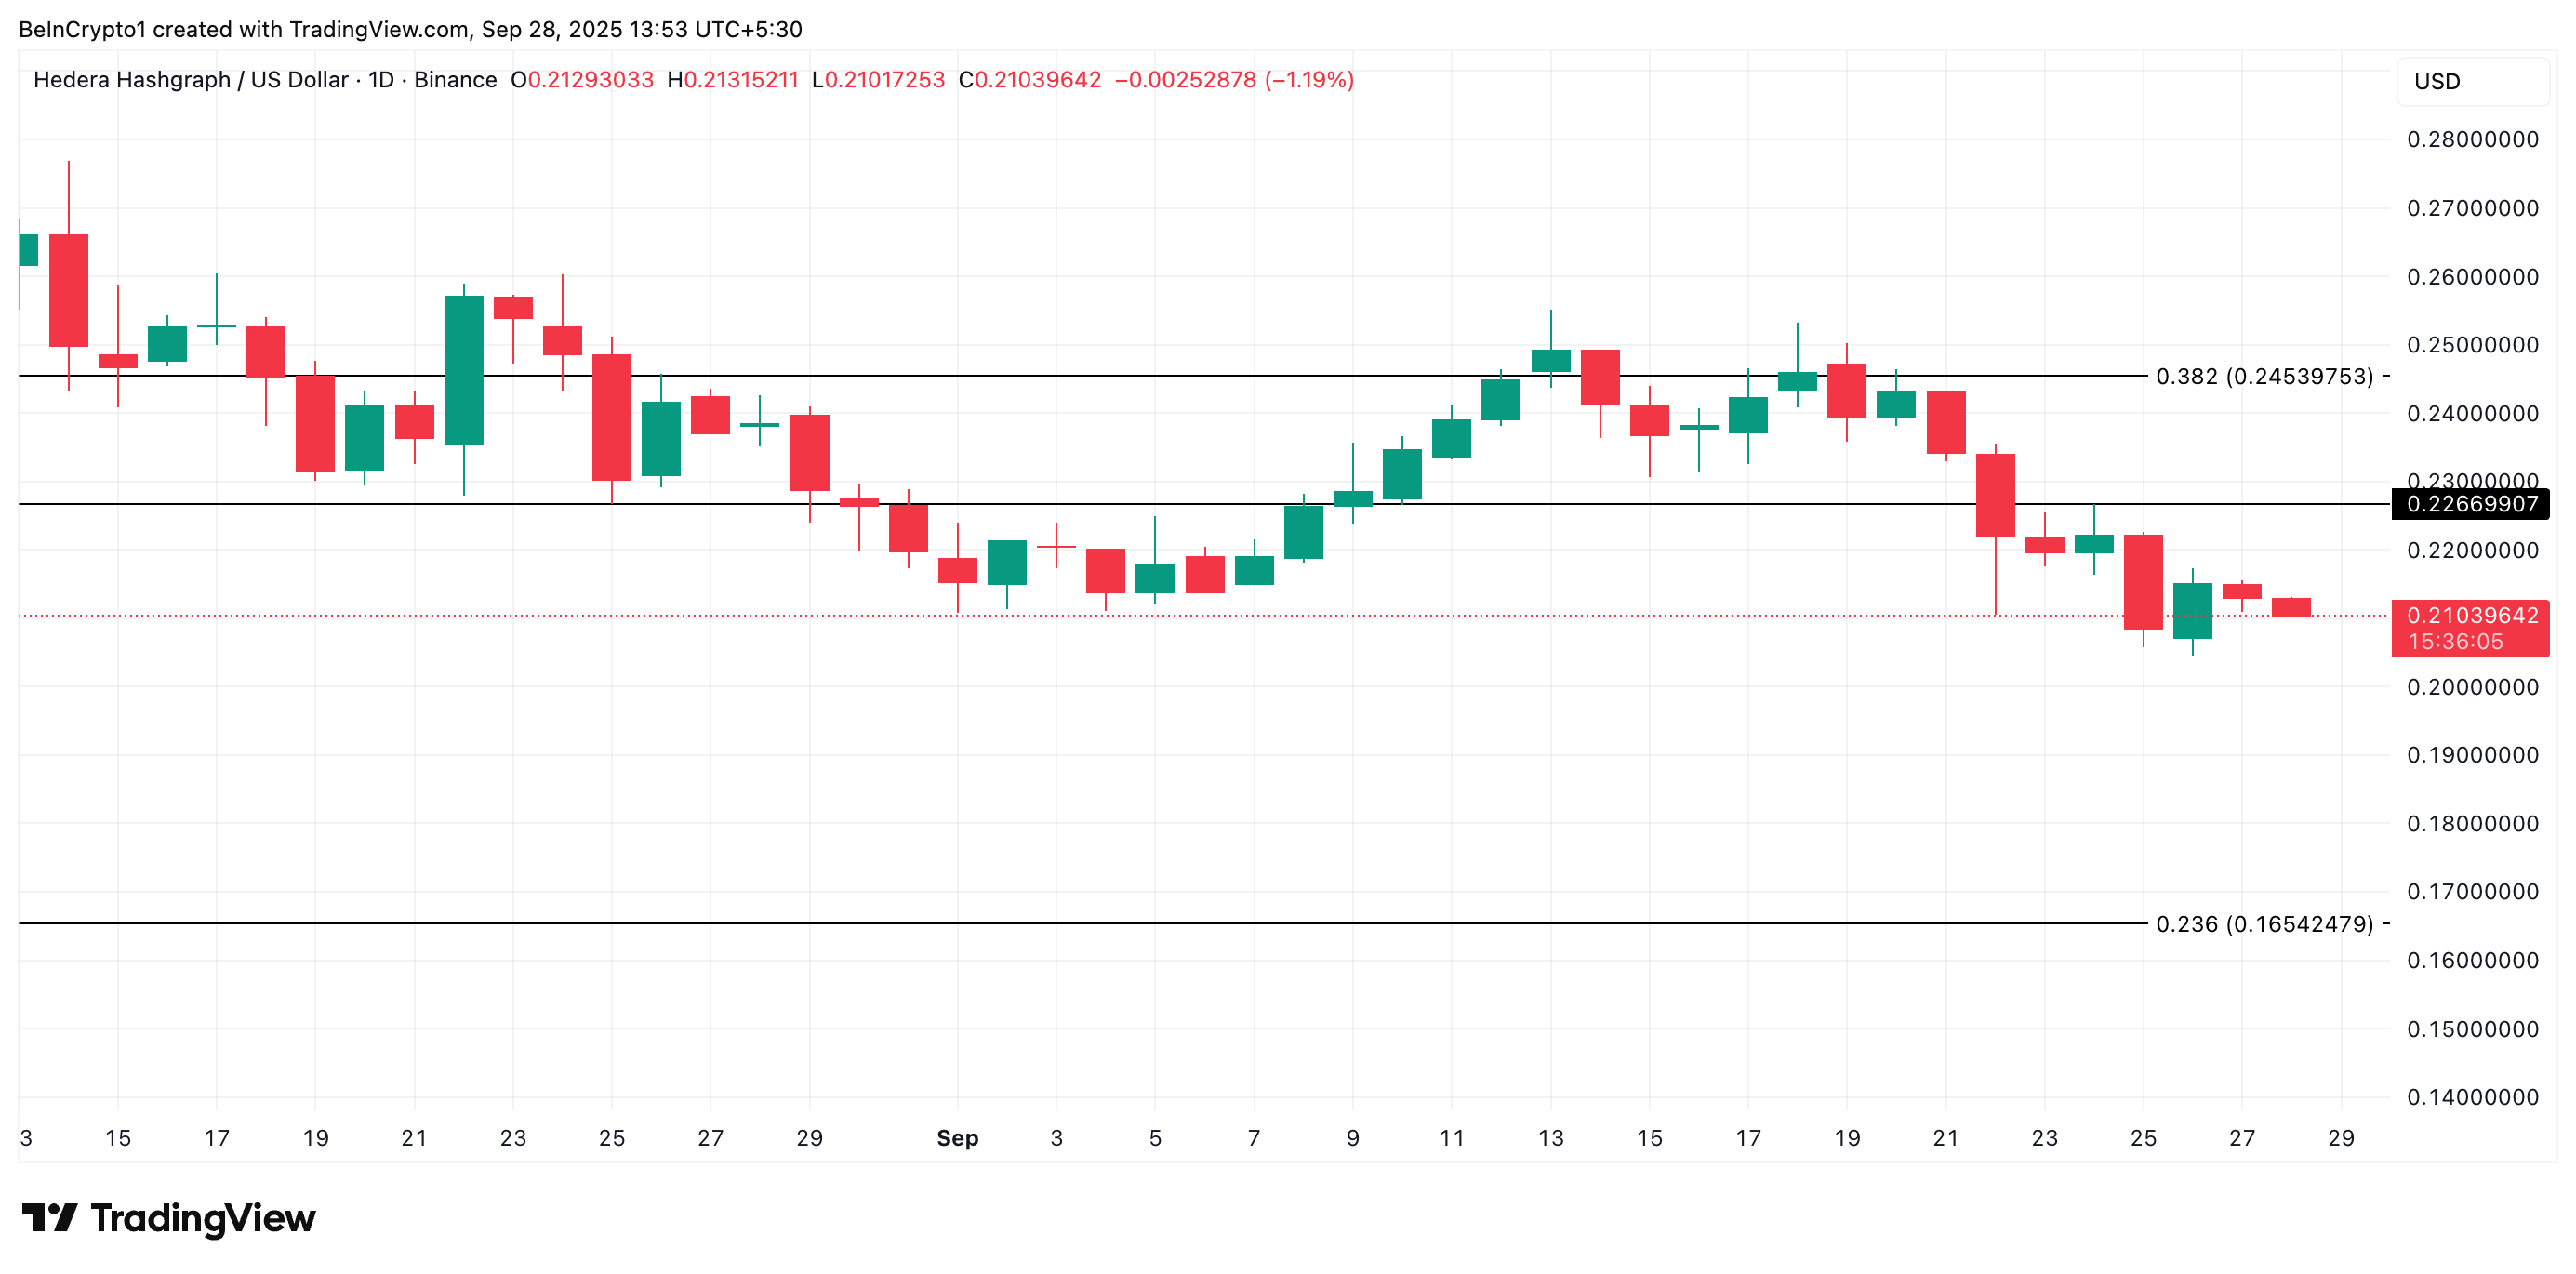 HBAR Price Analysis. Source: TradingView
On the other hand, a reversal in sentiment and renewed buying activity could provide the catalyst needed for a short-term recovery. In that scenario, HBAR’s price could push above $0.2266 and surge toward $0.2453.
Recommended Articles


