
Fed’s October Rate Cut: Easing Cycle Continues, Gold Likely to Keep Rising
1. Introduction
On 21 October, gold prices plummeted, with the largest drop exceeding 8%. The decline was driven by four main factors: first, technical overbought conditions triggered profit-taking; second, easing global trade tensions; third, expectations of a resolution to the U.S. government shutdown; and fourth, a strengthening U.S. dollar index. However, two days later, gold prices stabilized and rebounded due to deteriorating U.S.-Russia relations and the dollar index's inability to sustain further gains.
Looking ahead, the Federal Reserve's interest rate meeting on 29 October will be a pivotal event shaping gold price trends. The market widely anticipates a 25-basis-point rate cut, bringing the benchmark interest rate to 4%. Furthermore, we expect the Fed to implement at least another 25-basis-point cut at its December meeting (Figure 1). In an environment of sustained rate cuts, we remain optimistic about gold's performance over the next 12 months.
Figure 1: Fed Policy Rate (%)
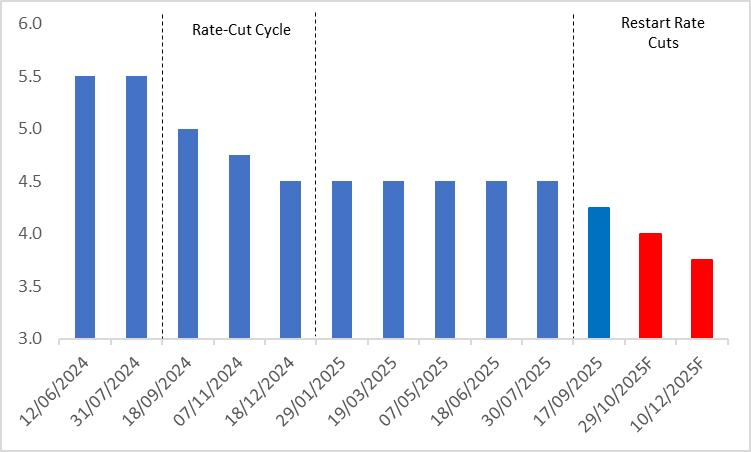
Source: Refinitiv, TradingKey
2. Market Liquidity
The Federal Reserve's interest rate cuts influence gold market trends through two primary channels: first, by enhancing market liquidity, and second, by suppressing real interest rates. Gold, with its dual attributes as a safe-haven asset and a non-interest-bearing commodity, is closely tied to fluctuations in market liquidity. Market liquidity typically reflects the degree of monetary policy easing or tightening and the abundance of capital within the economic system, directly impacting investors' allocation decisions toward assets like gold.
When market liquidity becomes significantly abundant, such as during substantial Federal Reserve rate cuts or the implementation of quantitative easing, the money supply increases, and the cost of capital decreases. Such an accommodative monetary environment typically drives inflation expectations higher, primarily due to excess liquidity potentially causing price level increases. In this context, investors often increase their gold holdings to hedge against inflation risks and currency depreciation pressures. This behaviour directly boosts gold demand, supporting prices and potentially triggering significant upward trends.
During the global pandemic outbreak in 2020, central banks, particularly in the United States, aggressively cut interest rates and relaunched quantitative easing policies. In August of that year, gold prices surged past the critical $2,000 per ounce threshold, reaching the highest level since 2011. In summary, market liquidity significantly influences gold prices through its impact on monetary policy, capital flows, and investor sentiment. This effect is particularly pronounced in environments marked by heightened economic uncertainty.
3. Real Interest Rates
As previously noted, gold is a non-interest-bearing asset, and its market appeal is largely determined by its relative yield compared to other investment assets, particularly fixed-income securities like bonds. Real interest rates, calculated as nominal interest rates minus inflation, serve as a key indicator of the true returns on fixed-income assets. Consequently, real interest rates significantly influence gold price trends.
When real interest rates decline, the yields on fixed-income assets like bonds decrease correspondingly, lowering investors' return expectations. In this environment, the opportunity cost of holding gold significantly diminishes, amplifying its appeal as a safe-haven and inflation-hedging asset. This effect is particularly pronounced when real interest rates turn negative, as holding gold not only effectively hedges against inflation risks but also offers the potential for capital appreciation. Consequently, investors are more inclined to increase their gold holdings, driving up demand and supporting gold prices, potentially sparking an upward trend.
From September to December 2024, the Federal Reserve reduced its benchmark interest rate from 5% to 4.5%. This led to a decline in short-term Treasury yields, boosting investors' interest in gold allocations. Consequently, this trend drove increased gold demand and price appreciation. During this period, gold prices rose from approximately $2,493 per ounce to $2,718 per ounce, reflecting a gain of over 9%.
4. Historical Evidence
Historical data provide strong support for the economic theories discussed above. Since the 1970s, several notable instances demonstrate significant gold price surges driven by Federal Reserve interest rate cuts, including the following examples:
4.1 The Great Gold Bull Market of the 1970s to Early 1980s
Prior to the 1970s, the U.S. dollar was pegged to gold. However, escalating military expenditures led to excessive dollar issuance, prompting President Nixon to announce the decoupling of the dollar from gold in August 1971, ending the fixed price of gold. Over the subsequent decade, two oil crises triggered a period of "stagflation" in the U.S., characterized by stagnant economic growth, high inflation, and declining dollar purchasing power. To address these economic challenges, the Federal Reserve adopted an accommodative monetary policy, implementing multiple interest rate cuts. During this period, gold prices surged approximately 19-fold, rising from $35 per ounce to $660 per ounce by 1980, making gold one of the most attractive assets of that era.
4.2 Gold Price Surge from 2001 to 2008
The bursting of the dot-com bubble in 2000 and the 11 September terrorist attacks in 2001 dealt significant blows to the U.S. economy. To stimulate economic recovery, the Federal Reserve began aggressively cutting interest rates in January 2001, implementing 13 rate reductions over the next two and a half years, lowering the federal funds rate from 6.5% to 1%. This accommodative policy fuelled a substantial rise in gold prices, with prices increasing by over 61% from March 2001 to the end of 2003.
4.3 Gold Price Booming from 2008 to 2011
Following the outbreak of the U.S. subprime mortgage crisis, the Federal Reserve initiated an interest rate cutting cycle in September 2007, reducing rates by a total of 500 basis points to 0.25% by the end of 2008, while also introducing quantitative easing to support the economy. The low-interest-rate environment drove real interest rates into negative territory, significantly enhancing the appeal of gold as a non-interest-bearing asset. As a result, gold prices soared, with London spot gold rising from $651 per ounce in June 2007 to $1,814 per ounce by August 2011, a nearly 1.5-fold increase, marking a historic peak for that period.
4.4 Gold Price Rally from 2019 to 2020
In 2019, signs of U.S. economic weakness emerged, with the manufacturing PMI consistently declining. In response, the Federal Reserve initiated a series of interest rate cuts in the second half of the year. The onset of the COVID-19 pandemic in early 2020 prompted the Fed to implement emergency rate cuts and expand its balance sheet, driving interest rates to near-zero levels. The persistent decline in real interest rates fuelled a sharp rise in gold prices. From September 2018 to July 2020, London spot gold surged from $1,187 per ounce to $1,965 per ounce, reflecting a gain of approximately 65%.
5. Conclusion
All in all, historical evidence demonstrates that gold's major bull markets have consistently been driven by sustained Federal Reserve interest rate cuts. Mechanistically, accommodative monetary policy boosts gold prices through two primary channels: increasing market liquidity and suppressing real interest rates. Although U.S. inflation has shown signs of rising, the Federal Reserve continues to prioritize a weakening labour market in its monetary policy decisions. This dynamic suggests that the ongoing rate-cutting cycle is likely to persist, increasing the probability of a continued gold bull market over the next 12 months. From an investment strategy perspective, we recommend seizing opportunities to increase gold holdings during periods of technical price pullbacks.
Recommended Articles


