


EUR/GBP Price Forecast: Sellers dominate as momentum turns decisively bearish
- EUR/GBP trades on the back foot as the British Pound remains broadly supported after the UK Autumn Budget.
- Technicals lean bearish as EUR/GBP holds below key short-term SMAs, with downside risk building toward the 100-day SMA.
- Momentum indicators reinforce the bearish tone, with the MACD turning negative and the RSI holding below 50.
EUR/GBP remains under pressure on Friday as the Euro (EUR) continues to soften against a broadly supported British Pound (GBP). Sterling has held firm since the UK Autumn Budget, even as markets maintain strong expectations for a Bank of England (BoE) interest rate cut at the December 18 meeting.
At the time of writing, EUR/GBP is trading around 0.8729, hovering near its lowest level since late October and on track for a third straight weekly decline.
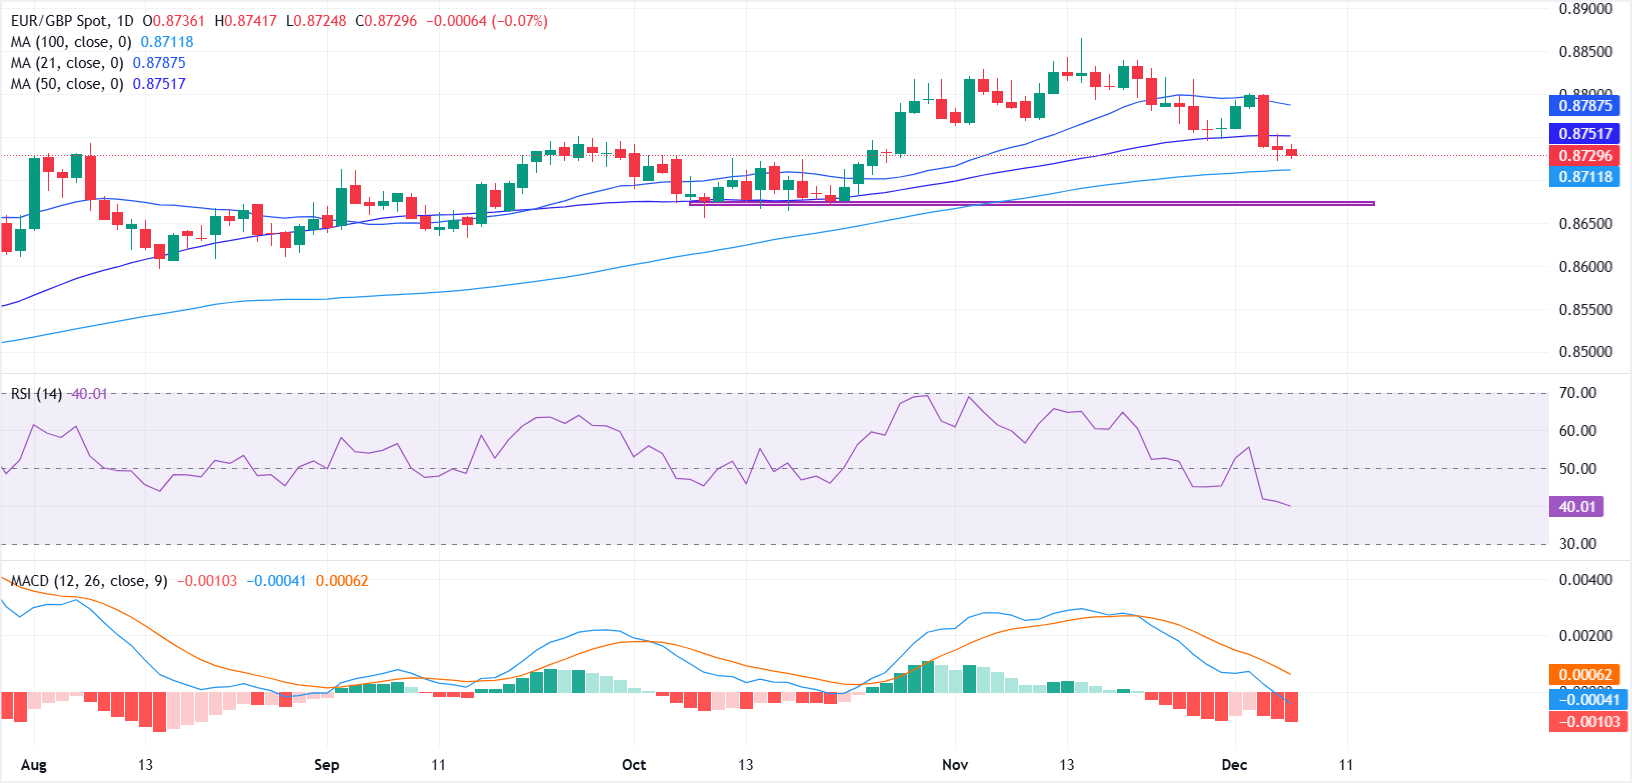
From a technical perspective, EUR/GBP has been under steady downward pressure since topping out near 0.8865 in mid-November, a level that marked the year-to-date high and the strongest reading since April 2023. The pair has since fallen below the 21-day and 50-day Simple Moving Averages (SMAs), showing a shift toward a softer near-term structure as sellers continue to dominate.
However, prices are still holding above the 100-day SMA around 0.8711, which serves as an important immediate support zone. A clear break below this region would increase the risk of a deeper pullback toward 0.8670-0.8650.
Momentum indicators also support the bearish tone. The Moving Average Convergence Divergence (MACD) histogram has slipped into negative territory near the zero line, pointing to fading upside momentum. The Relative Strength Index (RSI) stands at 39.83, below the midline and signalling weakening traction but staying above oversold conditions.
On the upside, the 50-day SMA near 0.8751 acts as the first hurdle, followed by the 21-day SMA around 0.8787. A break above both moving averages would help restore bullish momentum and open the door for a move back toward the 0.8865 peak and beyond.
Pound Sterling Price Today
The table below shows the percentage change of British Pound (GBP) against listed major currencies today. British Pound was the strongest against the Japanese Yen.
| USD | EUR | GBP | JPY | CAD | AUD | NZD | CHF | |
|---|---|---|---|---|---|---|---|---|
| USD | -0.06% | -0.14% | 0.09% | -0.60% | -0.47% | -0.25% | -0.03% | |
| EUR | 0.06% | -0.08% | 0.11% | -0.54% | -0.42% | -0.17% | 0.04% | |
| GBP | 0.14% | 0.08% | 0.19% | -0.45% | -0.33% | -0.11% | 0.12% | |
| JPY | -0.09% | -0.11% | -0.19% | -0.66% | -0.55% | -0.33% | -0.10% | |
| CAD | 0.60% | 0.54% | 0.45% | 0.66% | 0.11% | 0.33% | 0.58% | |
| AUD | 0.47% | 0.42% | 0.33% | 0.55% | -0.11% | 0.23% | 0.46% | |
| NZD | 0.25% | 0.17% | 0.11% | 0.33% | -0.33% | -0.23% | 0.22% | |
| CHF | 0.03% | -0.04% | -0.12% | 0.10% | -0.58% | -0.46% | -0.22% |
The heat map shows percentage changes of major currencies against each other. The base currency is picked from the left column, while the quote currency is picked from the top row. For example, if you pick the British Pound from the left column and move along the horizontal line to the US Dollar, the percentage change displayed in the box will represent GBP (base)/USD (quote).
Recommended Articles


