

GBP/USD rises towards 1.3200 as US reopening weigh on USD, BoE cut bets mount
- GBP/USD hits two-day high at 1.3197 as traders react to renewed US government funding and improved sentiment.
- UK GDP contracts 0.1% MoM in September, raising 80% odds of a BoE rate cut at next month’s meeting.
- Political tensions around PM Starmer and looming budget uncertainty keep Sterling’s medium-term outlook fragile.
The Pound Sterling advances on broad US Dollar weakness amid the US government's reopening, which would unveil a tranche of economic data for traders and the Federal Reserve. The GBP/USD trades at a two-day high of 1.3197, up 0.46%.
Sterling climbs on Dollar weakness after US government reopens, though soft UK GDP and political uncertainty weigh on outlook
Economic data releases in the US remain scarce but it is expected that it will pick up next week. Fox’s Lawrence said that September’s Nonfarm Payrolls report is expected to come out next week, citing sources.
The US government reopening releases funds to government’s offices but traders remain doubtful with the Trump administration having to face another threat of a shutdown late in January.
Federal Reserve officials continued to grab the headlines with Cleveland’s Beth Hammack saying that she’s worried about the labor market but expects high inflation to stick round. San Francisco’s Mary Daly commented that uncertainty had eased, added that it is premature to say a cut or no cut in December.
In the UK, Gross Domestic Product shows the economy is deteriorating, increasing the chances of a rate cut by the Bank of England at next month’s meeting. Preliminary growth figures in September contracted -0.1% MoM, beneath forecasts of 0% down two tenths from 0.1%. In the twelve months to September, rose 1.3%, missing estimates and the previous month print of 1.4% YoY.
After the data release, bets that the BoE would cut 25 bps the Bank Rate are near 80%. Traders are also expecting 50 bps of easing in 2026, though they’re waiting for November 26, the release of the Autumn’s Budget.
Analysts cited by Reuters noted “We expect the pound to weaken further if the market moves to price in a higher political risk premium,” as political turmoil surrounds Prime Minister Starmer, amid rumors of a plot to oust him.
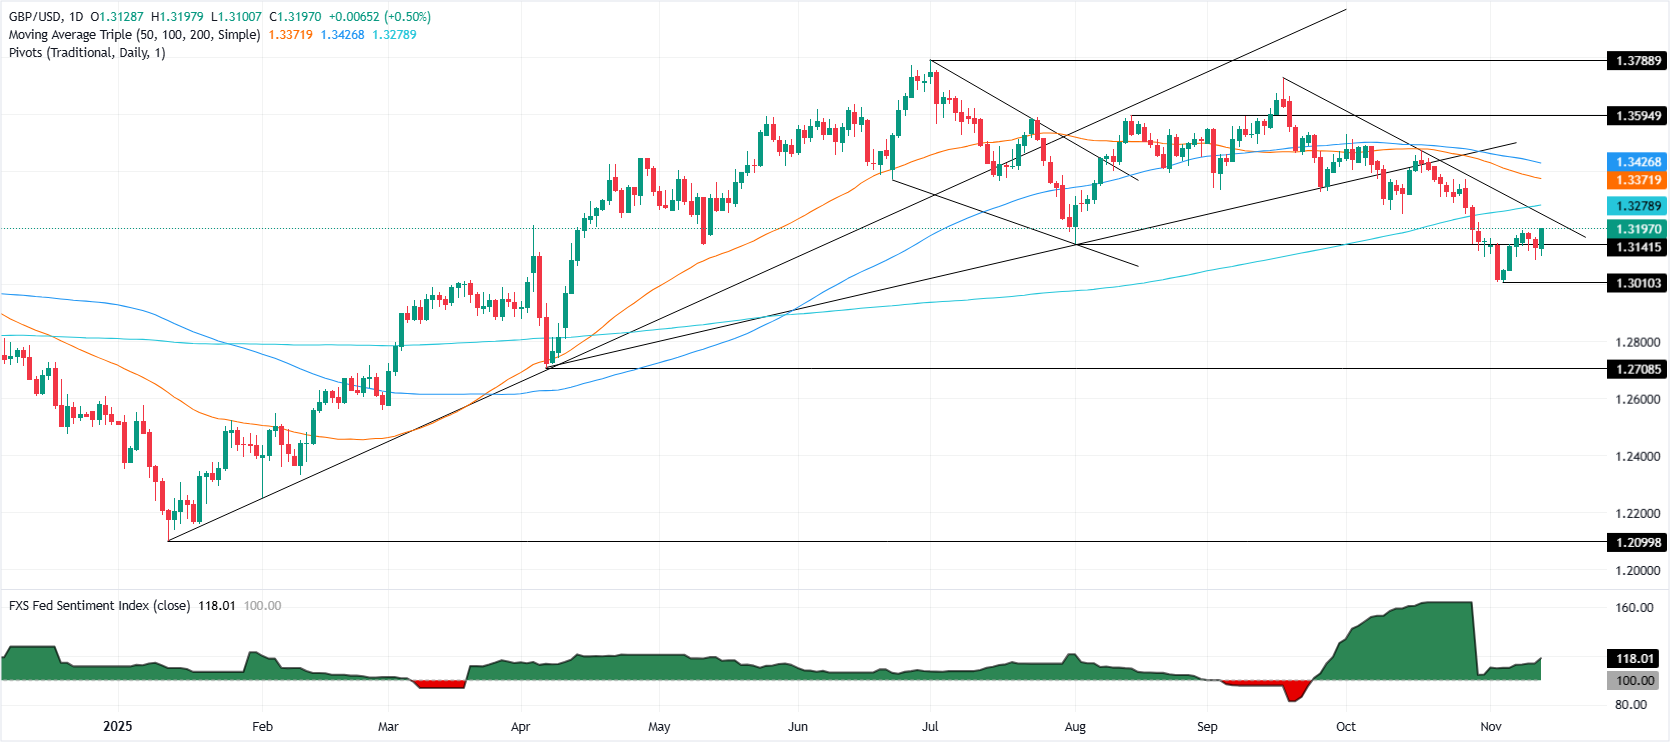
GBP/USD Price Forecast: Technical outlook
The GBP/USD technical picture shows that the ongoing upward correction will face stir resistance at 1.3200, followed by the 20-day SMA at 1.3221. A daily close above those levels clear the path to reclaim the 200-day SMA at 1.3275. Nevertheless, bearish momentum looms as depicted by the Relative Strength Index (RSI). For a bearish resumption, sellers must clear 1.3100 so they could threaten the 1.3000 milestone.
Pound Sterling Price This week
The table below shows the percentage change of British Pound (GBP) against listed major currencies this week. British Pound was the strongest against the Japanese Yen.
| USD | EUR | GBP | JPY | CAD | AUD | NZD | CHF | |
|---|---|---|---|---|---|---|---|---|
| USD | -0.72% | -0.36% | 0.23% | -0.35% | -0.90% | -0.93% | -1.58% | |
| EUR | 0.72% | 0.35% | 0.99% | 0.35% | -0.21% | -0.24% | -0.90% | |
| GBP | 0.36% | -0.35% | 0.69% | 0.00% | -0.56% | -0.59% | -1.24% | |
| JPY | -0.23% | -0.99% | -0.69% | -0.63% | -1.16% | -1.19% | -1.89% | |
| CAD | 0.35% | -0.35% | -0.00% | 0.63% | -0.46% | -0.59% | -1.31% | |
| AUD | 0.90% | 0.21% | 0.56% | 1.16% | 0.46% | -0.04% | -0.69% | |
| NZD | 0.93% | 0.24% | 0.59% | 1.19% | 0.59% | 0.04% | -0.66% | |
| CHF | 1.58% | 0.90% | 1.24% | 1.89% | 1.31% | 0.69% | 0.66% |
The heat map shows percentage changes of major currencies against each other. The base currency is picked from the left column, while the quote currency is picked from the top row. For example, if you pick the British Pound from the left column and move along the horizontal line to the US Dollar, the percentage change displayed in the box will represent GBP (base)/USD (quote).
Recommended Articles


