
Australian Dollar declines following employment data
- Australian Dollar loses ground as Employment Change fell to -5.4K in August, against the expected 22.0K.
- Australia’s Unemployment Rate held steady at 4.2% in August, in line with expectations.
- The US Dollar strengthens as strong inflation projections limit expectations of deeper FOMC rate cuts.
The Australian Dollar (AUD) extends its losses against the US Dollar (USD) on Thursday following the release of domestic labor market data. The AUD/USD pair is also under pressure, as the US Dollar (USD) gains support from strong inflation projections that have curbed expectations of more aggressive Federal Open Market Committee (FOMC) rate cuts.
Australia’s seasonally adjusted Employment Change arrived at -5.4K in August from 26.5K in July (revised from 24.5K), compared with the consensus forecast of 22.0K. Meanwhile, the Unemployment Rate steadied at 4.2% in August, as expected.
The United States (US) and China, a key trading partner of Australia, reached a commercial agreement on Monday to transfer TikTok into US ownership. Traders now await further developments, with final approval expected during a Friday call between US President Donald Trump and Chinese President Xi Jinping.
Australian Dollar declines as US Dollar edges higher ahead of Fed decision
- The US Dollar Index (DXY), which measures the value of the US Dollar against six major currencies, is gaining ground and trading around 97.10 at the time of writing. Traders will likely observe weekly US Initial Jobless Claims later in the day.
- The Federal Reserve (Fed) lowered the funds rate by 25 basis points (bps), marking the first cut of the year, and signaled a further 50 bps of easing before year-end, slightly above its June projections.
- Fed Chair Jerome Powell pointed to growing signs of weakness in the labor market to explain why officials decided it was time to cut rates after holding them steady since December amid concerns over tariff-driven inflation.
- US Retail Sales increased by 0.6% month-over-month in August, following the 0.6% increase (revised from 0.5%) recorded in July, and came in better than the market expectation of 0.2%. Retail Sales Control Group and Retail Sales ex Autos both rose 0.7%, exceeding the expected 0.4% increase.
- The National Bureau of Statistics (NBS) showed on Monday that China’s Retail Sales rose 3.4% year-over-year (YoY) in August vs. 3.8% expected and 3.7% in July. Chinese Industrial Production increased 5.2% YoY in the same period, compared to the 5.8% forecast and 5.7% seen previously.
- The NBS said during its press conference on Monday that economic operation was generally steady in August, but domestic demand will expand and promote a rebound in prices. Some firms are having difficulties in operations as the external environment is very severe, NBS added.
- Reserve Bank of Australia (RBA) Assistant Governor Sarah Hunter said on Tuesday that the central bank is “close to getting inflation to target.” Hunter noted that risks to the outlook are balanced and emphasized the need for a forward-looking approach given the delayed impact of monetary policy. She added that the RBA is closely monitoring the underlying strength of consumer spending and aims to keep the economy near full employment.
- The Aussie Dollar found support on the fading likelihood of further Reserve Bank of Australia (RBA) rate cuts. Swaps now price in a 70% likelihood of unchanged policy in September, bolstered by Australia’s strong July trade surplus, solid Q2 GDP, and hotter July inflation. Consumer Inflation Expectations also climbed in September, signaling stronger domestic demand and raising concerns about renewed inflationary pressures.
Australian Dollar slips below 0.6650 after retreating from 11-month highs
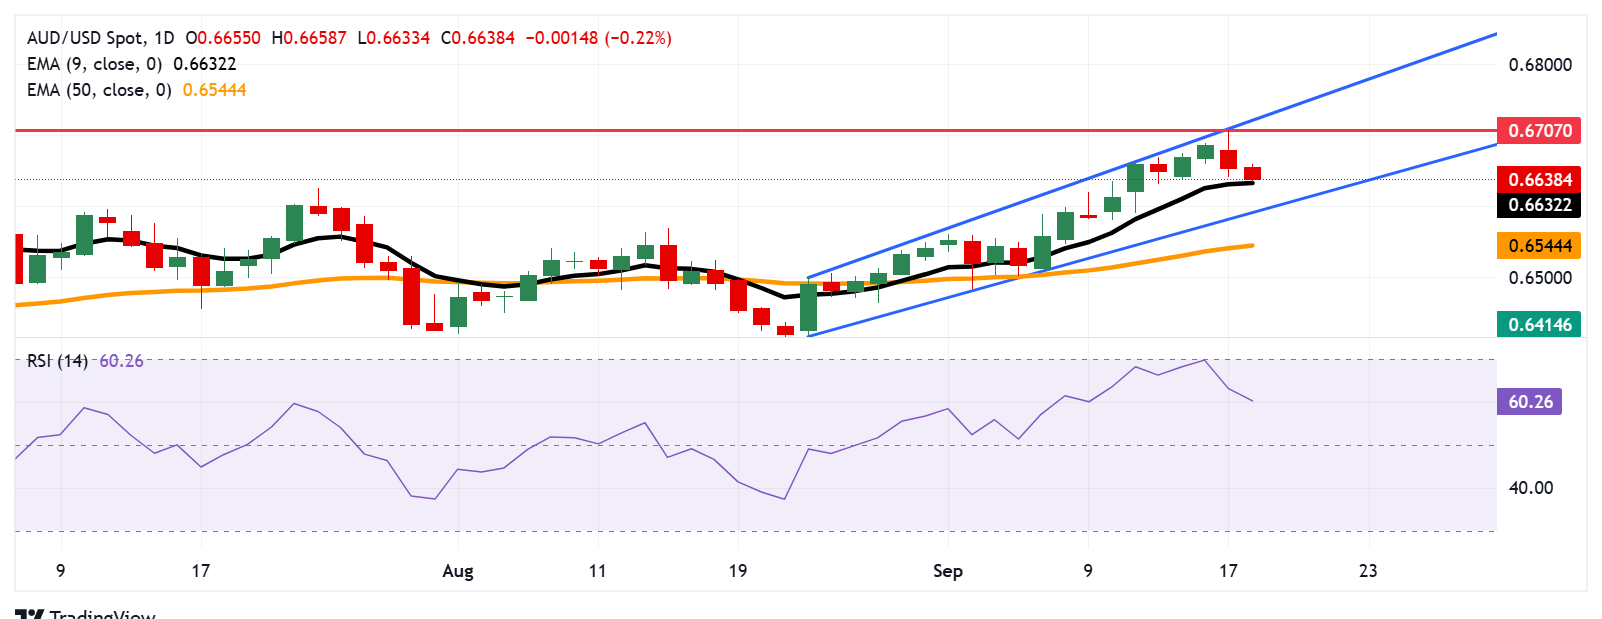
AUD/USD is trading around 0.6640 on Thursday. Technical analysis on the daily chart indicates that the pair is trending higher within an ascending channel, reinforcing the bullish outlook. Short-term momentum also remains strong, with the price holding above the nine-day Exponential Moving Average (EMA).
On the upside, the AUD/USD pair may target the psychological level of 0.6700, followed by the 11-month high of 0.6707, recorded on September 17. A break above this level would lead the pair to test the upper boundary of the ascending channel around 0.6720.
The AUD/USD pair may find its initial support at the nine-day EMA of 0.6632, followed by the ascending channel’s lower boundary around 0.6590. A break below the channel would weaken the bullish bias and lead the AUD/USD pair to test the 50-day EMA at 0.6544.
AUD/USD: Daily Chart
Australian Dollar Price Today
The table below shows the percentage change of Australian Dollar (AUD) against listed major currencies today. Australian Dollar was the weakest against the US Dollar.
| USD | EUR | GBP | JPY | CAD | AUD | NZD | CHF | |
|---|---|---|---|---|---|---|---|---|
| USD | 0.02% | 0.23% | 0.07% | 0.06% | 0.25% | 0.78% | 0.04% | |
| EUR | -0.02% | 0.07% | 0.07% | 0.06% | 0.21% | 0.86% | 0.06% | |
| GBP | -0.23% | -0.07% | 0.00% | -0.02% | 0.13% | 0.72% | -0.02% | |
| JPY | -0.07% | -0.07% | 0.00% | -0.00% | 0.11% | 0.69% | -0.00% | |
| CAD | -0.06% | -0.06% | 0.02% | 0.00% | 0.17% | 0.86% | -0.01% | |
| AUD | -0.25% | -0.21% | -0.13% | -0.11% | -0.17% | 0.67% | -0.16% | |
| NZD | -0.78% | -0.86% | -0.72% | -0.69% | -0.86% | -0.67% | -0.71% | |
| CHF | -0.04% | -0.06% | 0.02% | 0.00% | 0.00% | 0.16% | 0.71% |
The heat map shows percentage changes of major currencies against each other. The base currency is picked from the left column, while the quote currency is picked from the top row. For example, if you pick the Australian Dollar from the left column and move along the horizontal line to the US Dollar, the percentage change displayed in the box will represent AUD (base)/USD (quote).
Economic Indicator
Employment Change s.a.
The Employment Change released by the Australian Bureau of Statistics is a measure of the change in the number of employed people in Australia. The statistic is adjusted to remove the influence of seasonal trends. Generally speaking, a rise in Employment Change has positive implications for consumer spending, stimulates economic growth, and is bullish for the Australian Dollar (AUD). A low reading, on the other hand, is seen as bearish.
Read more.Last release: Thu Sep 18, 2025 01:30
Frequency: Monthly
Actual: -5.4K
Consensus: 22K
Previous: 24.5K
Source: Australian Bureau of Statistics
Recommended Articles


