


Silver Price Forecast: XAG/USD rebounds toward $52.50 within overbought zone

- Bitcoin Drops to $70,000. U.S. Government Refuses to Bail Out Market, End of Bull Market or Golden Pit?
- Gold rallies further beyond $5,050 amid flight to safety, dovish Fed expectations
- Bitcoin Bottom Debate: $70,000 or $50,000?
- A Crash After a Surge: Why Silver Lost 40% in a Week?
- Bitcoin Slips Below 75,000 Mark. Will Strategy Change Its Mind and Sell?
- Bitcoin Rout. Bridgewater Founder Dalio Publicly Backs Gold.

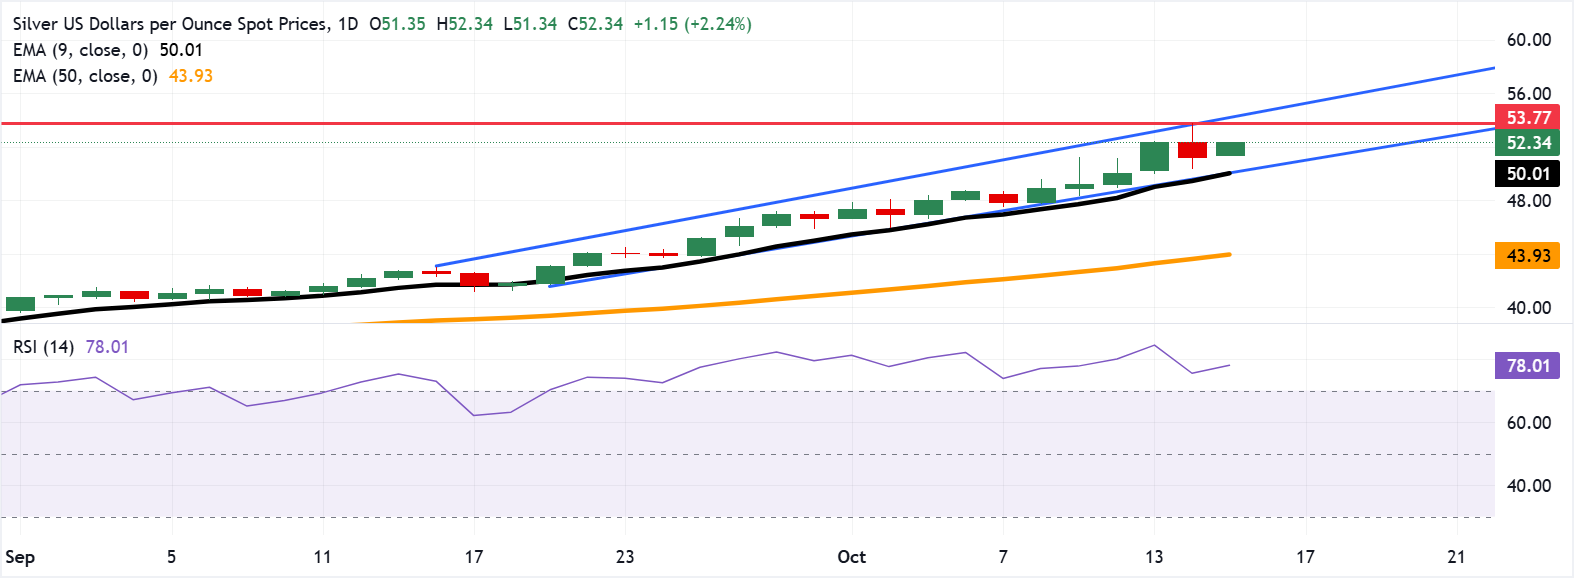
Silver price may test the new record high of $53.77, reached on Tuesday.
The 14-day Relative Strength Index remains above 70, indicating overbought conditions.
The primary support lies at the nine-day EMA of $50.01.
Silver price (XAG/USD) trades around $52.30 per troy ounce during the Asian hours on Wednesday after recovering losses registered in the previous session. The technical analysis of the daily chart timeframe suggests the price of the precious metal moves upwards within an ascending channel pattern, strengthening the bullish bias.
Additionally, the XAG/USD pair remains above the nine-day Exponential Moving Average (EMA), indicating that short-term price momentum is stronger. The 14-day Relative Strength Index (RSI) is positioned above the 70 level, suggesting that the Silver price is trading within overbought territory and a potential for a downward correction on technical terms. However, macroeconomic factors such as limited supply and strong safe-haven demand could continue to keep the precious metal elevated.
On the upside, the XAG/USD pair may target the new record high of $53.77, which was recorded on October 14, followed by the upper boundary of the ascending channel around $54.30. A break above the channel would strengthen the bullish bias and lead the Silver price to explore the region around the psychological level of $55.00.
Silver price may find its initial support at the ascending channel’s lower boundary, aligned with the nine-day EMA of $50.01. A break below this confluence support zone would weaken the short-term price momentum and put downward pressure on the Silver price to navigate the region around the 50-day EMA of $43.93.
XAG/USD: Daily Chart
Read more
* The content presented above, whether from a third party or not, is considered as general advice only. This article should not be construed as containing investment advice, investment recommendations, an offer of or solicitation for any transactions in financial instruments.


