
U.S. Money Supply Has Made History Twice in the Last 3 Years -- Including a First Since the Great Depression -- and It Foreshadows a Wild Ride for Stocks in 2026
Key Points
It's been a stellar 2025 for Wall Street, with the Dow Jones Industrial Average, S&P 500, and Nasdaq Composite rallying by 13%, 15%, and 19%, respectively.
U.S. M2 money supply reached an all-time high in October 2025, which followed a milestone decline in 2023 that was last observed during the Great Depression.
History points to a volatile new year for the stock market.
- 10 stocks we like better than S&P 500 Index ›
With less than 10 calendar days to go before we ring in the new year, it's looking promising that this will be another phenomenal year for Wall Street and the long-term investors who've continued to trust the process. As of the closing bell on Dec. 18, the iconic Dow Jones Industrial Average (DJINDICES: ^DJI), widely followed S&P 500 (SNPINDEX: ^GSPC), and innovation-driven Nasdaq Composite (NASDAQINDEX: ^IXIC) have rallied by 13%, 15%, and 19%, respectively.
Although investors are likely looking for the artificial intelligence (AI) revolution, quantum computing hype, and the Federal Reserve's rate-easing cycle to fuel additional gains in 2026, the new year may feature a historic bout of volatility, based on what one time-tested economic data point has to say.
Where to invest $1,000 right now? Our analyst team just revealed what they believe are the 10 best stocks to buy right now, when you join Stock Advisor. See the stocks »

Image source: Getty Images.
M2 money supply has completely rewritten history over the last three years
Before digging any further, it's appropriate to mention that just because something has happened in the past, it's not guaranteed to occur in the future. Nevertheless, correlated events often have a way of repeating on Wall Street (albeit not to a "t"), which can help investors position themselves for future gains.
Few foundational metrics have a richer history than U.S. money supply. While there are multiple measures of money supply, the two that garner the most attention are M1 and M2. The former is a measure of cash and coins in circulation, as well as demand deposits in checking accounts. Think of it as money that can be spent right now.
Meanwhile, M2 accounts for everything in M1 and includes savings accounts, money market accounts, and certificates of deposit below $100,000. It's still money that can be spent, but it requires more effort to get this capital into your hands. It's U.S. M2 money supply that's been rewriting history since 2022.
Usually, the M2 money supply chart moves up and to the right with virtually no interruption. In simple terms, a growing economy needs more capital to facilitate transactions over time.
WARNING: the Money Supply is officially contracting. 📉
-- Nick Gerli (@nickgerli1) March 8, 2023
This has only happened 4 previous times in last 150 years.
Each time a Depression with double-digit unemployment rates followed. 😬 pic.twitter.com/j3FE532oac
The post above on social media platform X (formerly Twitter), from Reventure App CEO Nick Gerli, is nearing its third anniversary. However, it holds value in that it shows the year-over-year changes in M2 dating back to 1870.
Between April 2022 and October 2023, U.S. M2 money supply fell by 4.76%. This marked the first time since the Great Depression that M2 declined by more than 2% on a year-over-year basis and peak-to-trough basis. The only four previous instances in 156 years where M2 dropped by 2% (or more) on a year-over-year basis correlated with depressions for the U.S. economy and a rough road for Wall Street. Thankfully for investors, the decline from April 2022 to October 2023 ended this dubious streak.
At the same time, M2 has bounced back in a big way since its trough. In October 2025, M2 money supply advanced to a fresh all-time high of nearly $22.3 trillion. Expanding money supply is typically a hallmark of a healthy economy, and it's often indicative of a favorable environment for the stock market.
But things aren't always as they seem.

Image source: Getty Images.
The stock market may be in for a roller-coaster ride in 2026
Over the trailing year, M2 has increased by 4.08%. This seemingly healthy jump is more than likely the result of the Federal Reserve's easing policy in action. The central bank is in a rate-easing cycle designed to lower the federal funds rate and encourage more lending activity. When businesses borrow more capital, it can stimulate economic activity.
But as you'll note from Gerli's post, M2 year-over-year increases have historically been robust, with annual growth ranging from 5% to 10%. Yes, year-over-year increases of this magnitude become tougher to accomplish as M2 money supply expands; however, yearly increases ranging between 1% and 4% have foreshadowed trouble to come for the U.S. economy and/or Wall Street, more often than not.
For example, M2 growth weakened to just 2%, on a year-over-year basis, during the financial crisis. Low single-digit M2 expansion was also observed in the vicinity of the eight-month recession in the early 1990s. The slower expansion of M2 money supply has commonly been correlated with or portended weakness to come for the stock market.
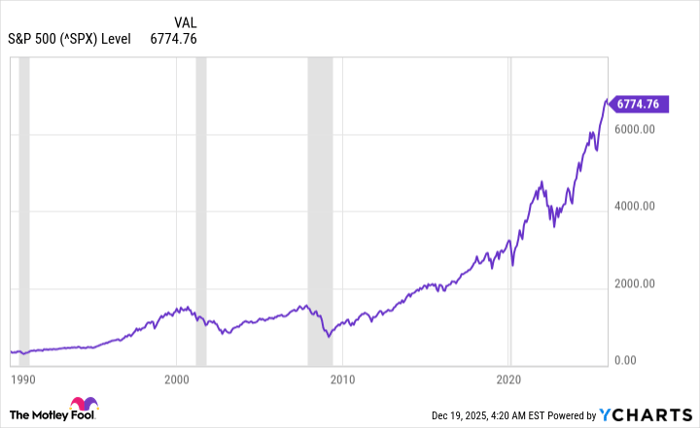
^SPX data by YCharts. Gray areas denote U.S. recessions. S&P 500 chart from Jan. 1, 1990-Dec. 18, 2025.
Last year (you won't see this figure on Gerli's chart, as he posted it in March 2023), M2 increased by 3.49% and is pacing a roughly 4% year-over-year jump in 2025. These two figures are on the lower end of what we typically observe regarding the expansion of M2 money supply -- and that's potentially worrisome for Wall Street.
This modest growth in M2 comes at a time when the stock market is particularly vulnerable to external weakness. While this is far from a compendium of challenges, Wall Street is contending with:
- A historically divided Federal Reserve.
- The second priciest stock market in 155 years, according to the S&P 500's Shiller Price-to-Earnings Ratio.
- The possibility of President Donald Trump's tariff and trade policy weighing on corporate earnings.
- History pointing to the AI and quantum computing bubbles bursting at some point in the not-too-distant future.
Keeping in mind that what's happened in the past can't concretely guarantee directional moves in the future, there does appear to be a significant risk of a roller-coaster ride for stocks in 2026.
Should you buy stock in S&P 500 Index right now?
Before you buy stock in S&P 500 Index, consider this:
The Motley Fool Stock Advisor analyst team just identified what they believe are the 10 best stocks for investors to buy now… and S&P 500 Index wasn’t one of them. The 10 stocks that made the cut could produce monster returns in the coming years.
Consider when Netflix made this list on December 17, 2004... if you invested $1,000 at the time of our recommendation, you’d have $509,039!* Or when Nvidia made this list on April 15, 2005... if you invested $1,000 at the time of our recommendation, you’d have $1,109,506!*
Now, it’s worth noting Stock Advisor’s total average return is 972% — a market-crushing outperformance compared to 193% for the S&P 500. Don't miss the latest top 10 list, available with Stock Advisor, and join an investing community built by individual investors for individual investors.
See the 10 stocks »
*Stock Advisor returns as of December 22, 2025.
Sean Williams has no position in any of the stocks mentioned. The Motley Fool has no position in any of the stocks mentioned. The Motley Fool has a disclosure policy.
Recommended Articles


