
Dow Jones Industrial Average pulls back after Trump targets Fed Chair Powell
- The Dow Jones gained ground early Wednesday before falling back into 44,000.
- Markets are on high alert after President Trump took another step toward end Powell’s term early.
- Despite the lack of legal precedent, the Trump administration is full of White House “firsts”.
The Dow Jones Industrial Average (DJIA) rose early Wednesday after United States (US) Producer Price Index (PPI) inflation remained on the cooler side, bolstering market confidence in a Federal Reserve (Fed) rate cut sooner rather than later. However, US President Donald Trump was quick to cut the sentiment festivities short by signaling to the US government that he’s looking for a way to end Fed Chair Jerome Powell’s tenure as head of the Fed early.
Trump waffles on shots at Powell, but intent remains
Equity markets recovered some footing after President Trump pivoted to a half-hearted statement that he’s “not planning on doing anything” about Fed Chair Powell at the moment, however brandishing a termination letter written specifically for the Fed head in front of Congress on Wednesday sent a clear signal that Trump is looking for an avenue to terminate Powell’s position as head of the Fed. The President’s office has no legal framework (or even jurisdiction) to terminate the Fed officials; however, Donald Trump’s actions serve as a signal to Congressional Republicans to get on board and allow it to happen: President Trump has made skirting legal and ethical roadblocks a habit for his administration.
US PPI inflation came in well below expectations on Wednesday, bolstering general market sentiment as traders tilt back into rate cut hopes. Core June US PPI came in at 2.6% YoY, well below the previous print of 3.0%, sparking renewed hopes that tariff impacts might continue to remain muted.
Cooling business inflation doesn't mean consumers save money
However, hopes for a rate cut haven’t fully seeped into rate watchers’ books just yet. According to the CME’s FedWatch Tool, rate traders are still pricing in around a 40% chance of another hold on rate cuts in September, and the odds of a follow-up cut before the end of the year remain in question.
Read more stock news: US stocks gyrate wildly after Trump wavers on firing Fed's Powell
Dow Jones price forecast
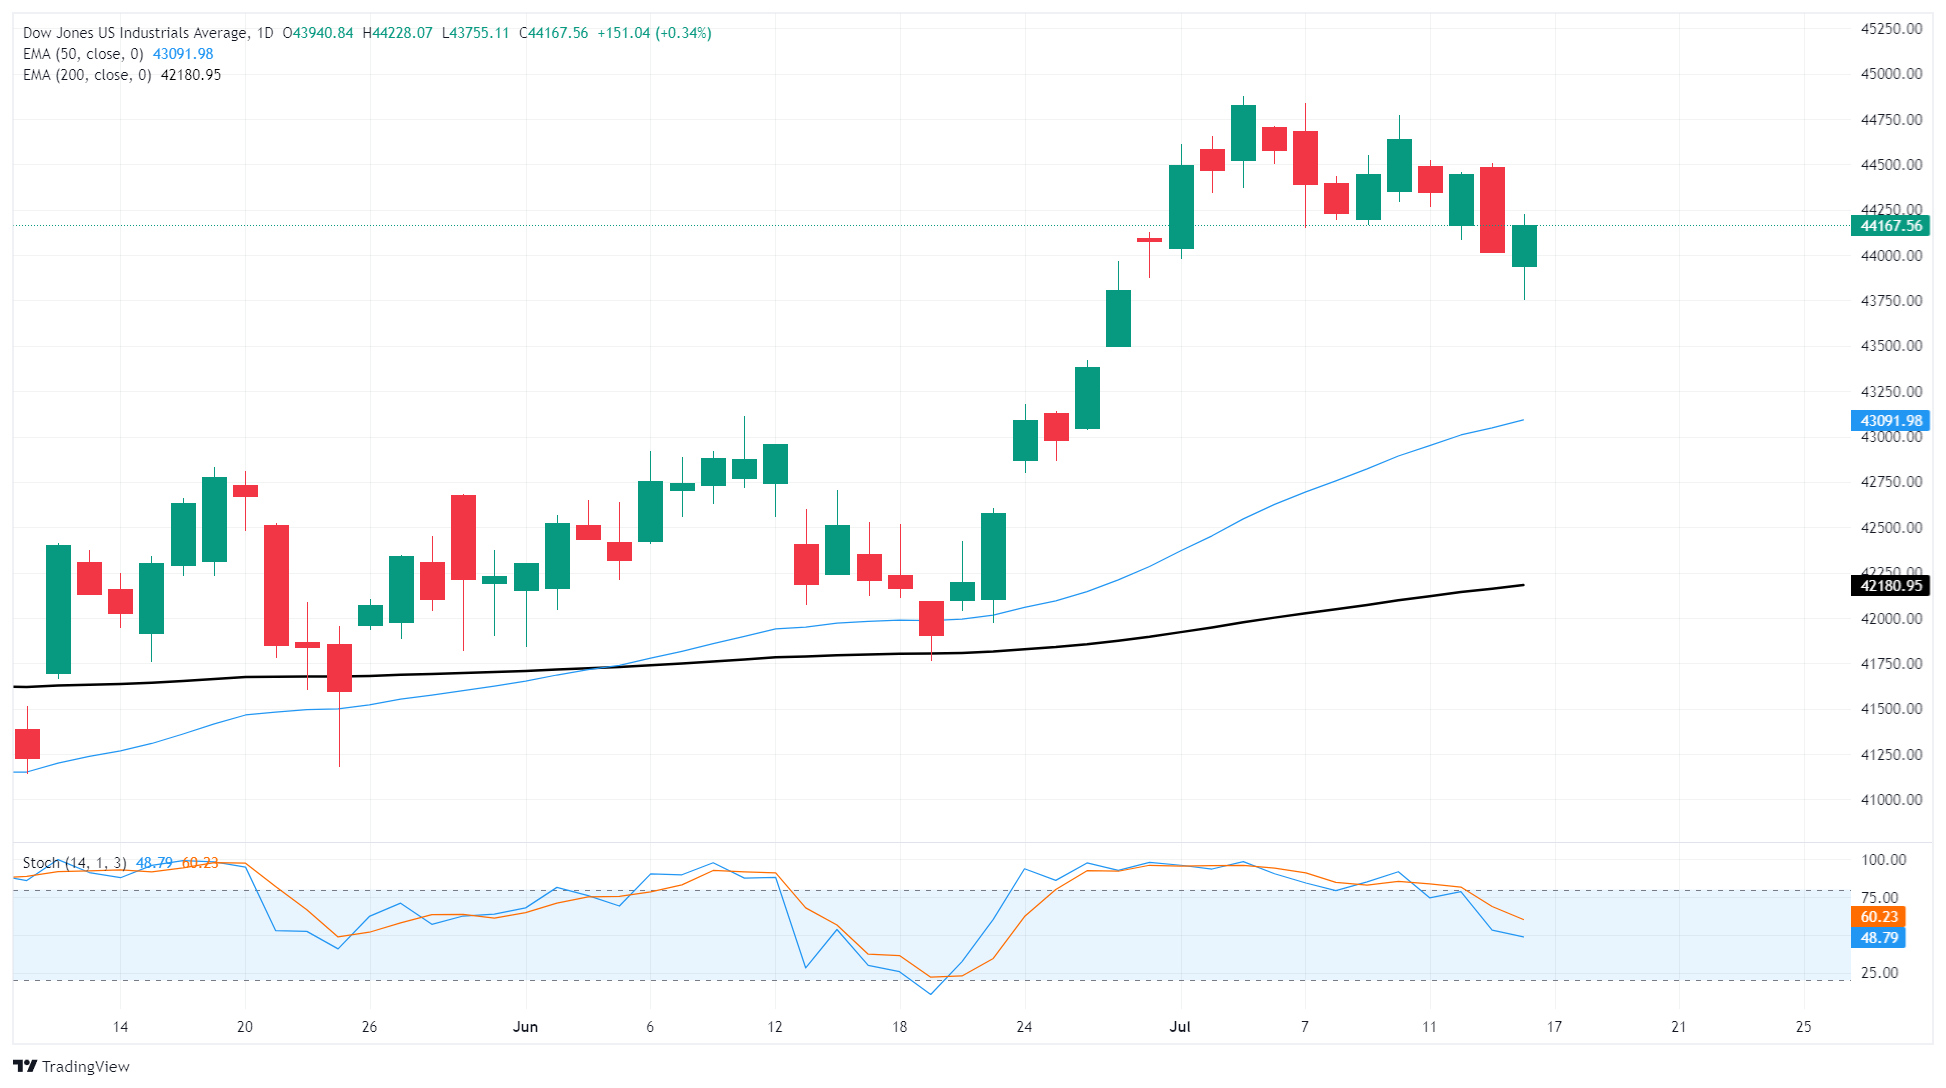
Despite firm resistance from buyers, the Dow Jones continues to test lower ground after running into a technical ceiling just below 45,000 earlier this month. The Dow is now battling the 44,000 handle, and the major equity index could see fresh declines if the line doesn’t hold.
Bearish momentum could still have some room to run as technical oscillators continue to walk down from overbought conditions, and the closest major price support is baked into the 50-day Exponential Moving Average (EMA) near 43,095.
Dow Jones daily chart
Dow Jones FAQs
The Dow Jones Industrial Average, one of the oldest stock market indices in the world, is compiled of the 30 most traded stocks in the US. The index is price-weighted rather than weighted by capitalization. It is calculated by summing the prices of the constituent stocks and dividing them by a factor, currently 0.152. The index was founded by Charles Dow, who also founded the Wall Street Journal. In later years it has been criticized for not being broadly representative enough because it only tracks 30 conglomerates, unlike broader indices such as the S&P 500.
Many different factors drive the Dow Jones Industrial Average (DJIA). The aggregate performance of the component companies revealed in quarterly company earnings reports is the main one. US and global macroeconomic data also contributes as it impacts on investor sentiment. The level of interest rates, set by the Federal Reserve (Fed), also influences the DJIA as it affects the cost of credit, on which many corporations are heavily reliant. Therefore, inflation can be a major driver as well as other metrics which impact the Fed decisions.
Dow Theory is a method for identifying the primary trend of the stock market developed by Charles Dow. A key step is to compare the direction of the Dow Jones Industrial Average (DJIA) and the Dow Jones Transportation Average (DJTA) and only follow trends where both are moving in the same direction. Volume is a confirmatory criteria. The theory uses elements of peak and trough analysis. Dow’s theory posits three trend phases: accumulation, when smart money starts buying or selling; public participation, when the wider public joins in; and distribution, when the smart money exits.
There are a number of ways to trade the DJIA. One is to use ETFs which allow investors to trade the DJIA as a single security, rather than having to buy shares in all 30 constituent companies. A leading example is the SPDR Dow Jones Industrial Average ETF (DIA). DJIA futures contracts enable traders to speculate on the future value of the index and Options provide the right, but not the obligation, to buy or sell the index at a predetermined price in the future. Mutual funds enable investors to buy a share of a diversified portfolio of DJIA stocks thus providing exposure to the overall index.
Recommended Articles


