
US Dollar ticks up after Japan limits debt issuances
- The US Dollar is positive against major currencies this Tuesday.
- Markets are supporting the Greenback ahead of important US data later this week.
- The US Dollar Index heads above 99.00 in search of the 100.00 figure.
The US Dollar Index (DXY), which tracks the performance of the Greenback’s value against six major currencies, is tying up some minor gains, trading around 99.40 at the time of writing this Tuesday. The stronger Greenback has emerged right at the end of Asian trading hours, after the Japanese Ministry of Finance (MoF) commented that its bond issuance plan might see some tweaking, with lower volumes. This made Japanese yields collapse and saw the Japanese Yen (JPY) devalue against the Greenback, with a domino effect in favor of the US Dollar against several major currencies.
While markets are hopeful about a US-EU trade deal in the upcoming days, this week will start with US data due this Tuesday, after the Memorial Day public holiday, which kept markets closed. Traders can look ahead to the US Durable Goods Orders for April and the Dallas Federal Reserve (Fed) Manufacturing Business Index for May, which is a good leading indicator to see how the manufacturing sector is holding up after the introduction of tariffs.
Daily digest market movers: US Durable Goods Orders ahead
- At 12:30 GMT, US Durable Goods Orders for April are due. The headline figure is expected to shrink by -7.9%, coming from 9.2% in March. US Durable Goods Orders without Transportation is expected to shrink by -0.1% from 0% in March.
- At 14:00 GMT, the US Consumer Confidence for May will be released, with no forecast available and the previous figure at 86.0.
- At 14:30 GMT, the Dallas Fed Manufacturing Business Index for May is due. No forecast available, with the previous number falling sharply by -35.8.
- Equities are seeing some small gains across the board in Asia and Europe. US futures are advancing much more aggressively, with all three major indices up over 1.50% ahead of the US trading session.
- The CME FedWatch tool shows the chances of an interest rate cut by the Federal Reserve in June’s meeting are only at a low 2.1%. Further ahead, the July 30 meeting sees odds for rates being lower than current levels at 24.4%.
- The US 10-year yield comes in at 4.45% at the time of writing, another leg lower from the 4.62% peak performance seen last Thursday.
US Dollar Index Technical Analysis: Never a straight path
The US Dollar Index is due for some recovery after a long stretch of devaluation, and that narrative is picking up this Tuesday after very early signs were seen on Monday. Expect to see the DXY swing back higher and look for firm resistance. That could trigger a firm rejection at higher levels and push the DXY beyond the low of May, causing more devaluation for the Greenback and losses for the DXY.
On the upside, the 100.22 level, which held the DXY back in September-October, is the first resistance, followed by the broken ascending trend line near 100.80. Further up, the 55-day Simple Moving Average (SMA) at 101.32 is the next level to watch out for, followed by 101.90, a pivotal level throughout December 2023 and a base for the inverted Head-and-Shoulders (H&S) formation during the summer of 2024. In case US Dollar bulls push the DXY even higher, the 103.18 pivotal level will come into play.
Should the DXY see some renewed selling pressure, a nosedive move could materialize towards the year-to-date low of 97.91 and the pivotal level of 97.73. Further below, a relatively thin technical support comes in at 96.94 before looking at the lower levels of this new price range. These would be at 95.25 and 94.56, meaning fresh lows not seen since 2022.
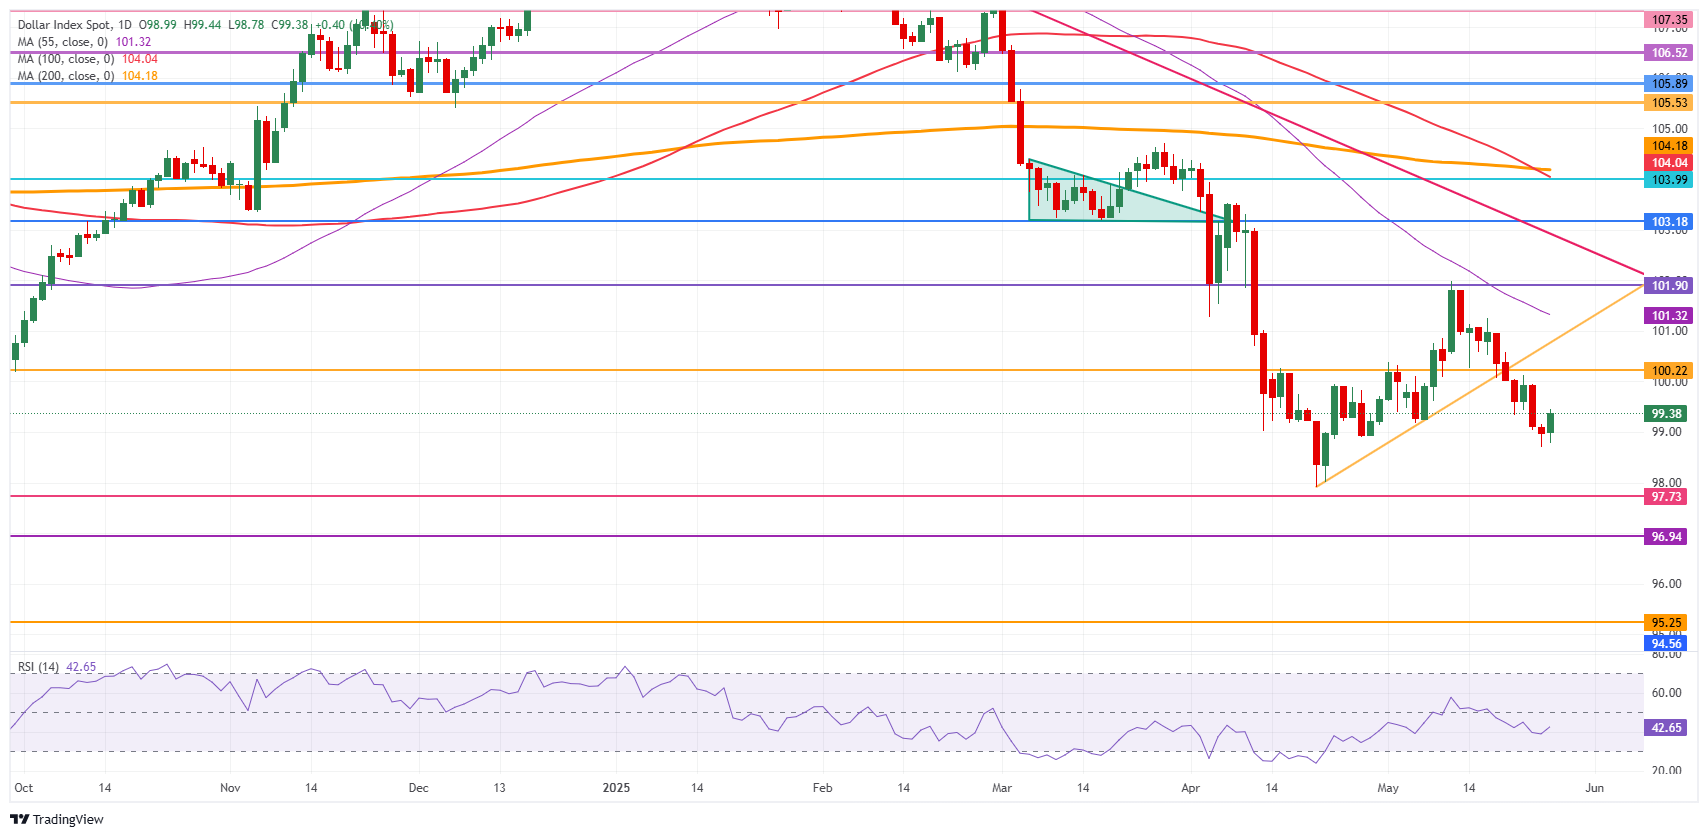
US Dollar Index: Daily Chart
US-China Trade War FAQs
Generally speaking, a trade war is an economic conflict between two or more countries due to extreme protectionism on one end. It implies the creation of trade barriers, such as tariffs, which result in counter-barriers, escalating import costs, and hence the cost of living.
An economic conflict between the United States (US) and China began early in 2018, when President Donald Trump set trade barriers on China, claiming unfair commercial practices and intellectual property theft from the Asian giant. China took retaliatory action, imposing tariffs on multiple US goods, such as automobiles and soybeans. Tensions escalated until the two countries signed the US-China Phase One trade deal in January 2020. The agreement required structural reforms and other changes to China’s economic and trade regime and pretended to restore stability and trust between the two nations. However, the Coronavirus pandemic took the focus out of the conflict. Yet, it is worth mentioning that President Joe Biden, who took office after Trump, kept tariffs in place and even added some additional levies.
The return of Donald Trump to the White House as the 47th US President has sparked a fresh wave of tensions between the two countries. During the 2024 election campaign, Trump pledged to impose 60% tariffs on China once he returned to office, which he did on January 20, 2025. With Trump back, the US-China trade war is meant to resume where it was left, with tit-for-tat policies affecting the global economic landscape amid disruptions in global supply chains, resulting in a reduction in spending, particularly investment, and directly feeding into the Consumer Price Index inflation.
Recommended Articles


