


EUR/JPY Price Forecast: Breaks below 163.50, support appears near nine-day EMA


EUR/JPY could target a six-month high of 165.21 once it returns to the ascending channel.
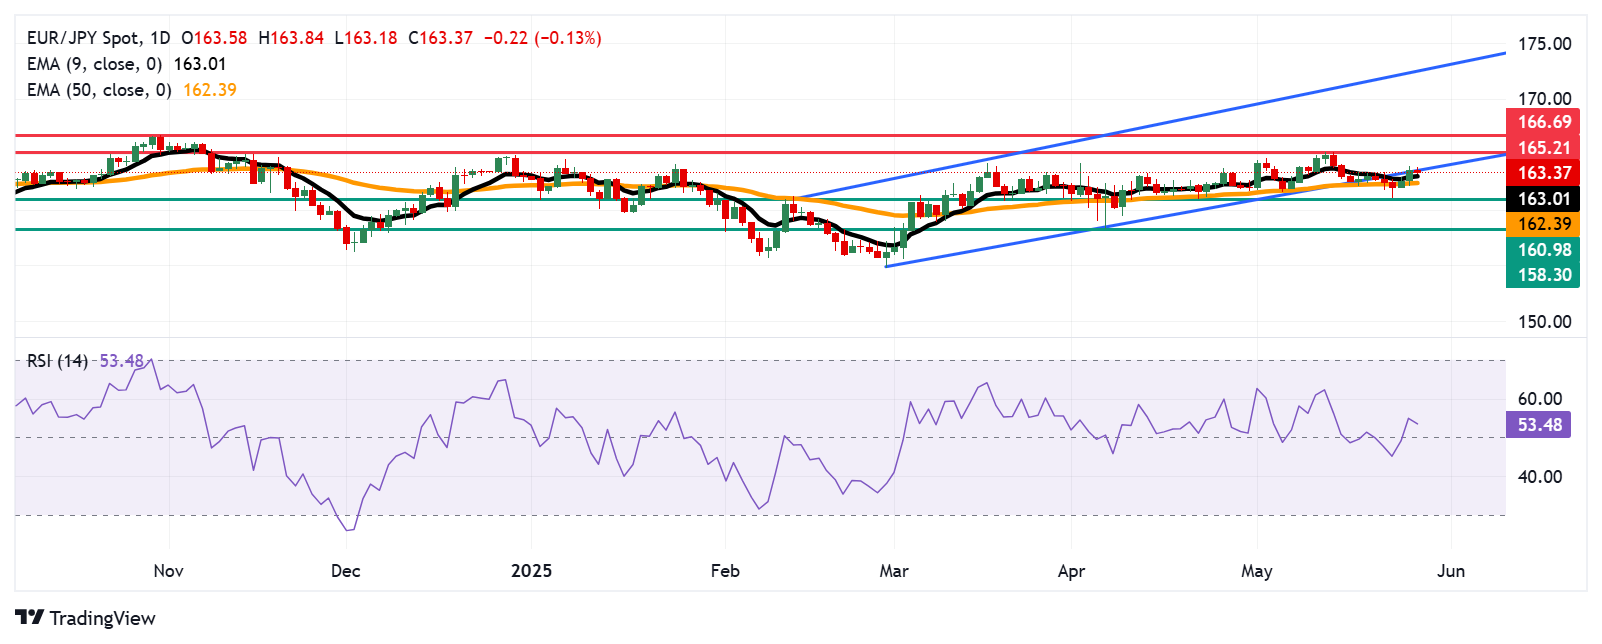
The 14-day RSI moves above the 50 level, indicating that bullish bias is still in play.
The immediate support appears at the nine-day EMA of 163.01.
EUR/JPY halts its two-day winning streak, trading around 163.30 during the Asian hours on Wednesday. The weakening of a bullish bias appears as the currency cross remains slightly below the lower boundary of the ascending channel, as suggested by the technical analysis of the daily chart.
However, the EUR/JPY cross maintains its position slightly above the nine-day Exponential Moving Average (EMA), signaling short-term momentum is stronger. Additionally, the 14-day Relative Strength Index (RSI) has also moved above the 50 level, suggesting the presence of a bullish bias.
On the upside, a return to the ascending channel could reinforce the bullish bias and support the pair to target a six-month high of 165.21, which was reached on May 13, followed by the next significant obstacle at 166.69, which marks a nine-month high last seen in October 2024. Further upside would reinforce the bullish sentiment and open the door for the EUR/JPY cross to explore the area around the channel’s upper boundary.
The EUR/JPY cross could encounter immediate support at the nine-day EMA of 163.01, followed by the 50-day EMA at 162.39. A decisive break below these levels would weaken the short- and medium-term price momentum and put downward pressure on the currency cross to test the seven-week low at 160.98. Next support appears at the two-month low at 158.30, which was recorded on April 7.
EUR/JPY: Daily Chart
Euro PRICE Today
The table below shows the percentage change of Euro (EUR) against listed major currencies today. Euro was the weakest against the US Dollar.
| USD | EUR | GBP | JPY | CAD | AUD | NZD | CHF | |
|---|---|---|---|---|---|---|---|---|
| USD | 0.30% | 0.31% | 0.16% | 0.20% | 0.25% | -0.02% | 0.16% | |
| EUR | -0.30% | 0.05% | -0.10% | -0.09% | -0.04% | -0.28% | -0.09% | |
| GBP | -0.31% | -0.05% | -0.14% | -0.09% | -0.06% | 0.00% | -0.13% | |
| JPY | -0.16% | 0.10% | 0.14% | 0.03% | 0.07% | -0.15% | 0.07% | |
| CAD | -0.20% | 0.09% | 0.09% | -0.03% | 0.06% | -0.18% | -0.04% | |
| AUD | -0.25% | 0.04% | 0.06% | -0.07% | -0.06% | 0.08% | -0.06% | |
| NZD | 0.02% | 0.28% | -0.00% | 0.15% | 0.18% | -0.08% | -0.15% | |
| CHF | -0.16% | 0.09% | 0.13% | -0.07% | 0.04% | 0.06% | 0.15% |
The heat map shows percentage changes of major currencies against each other. The base currency is picked from the left column, while the quote currency is picked from the top row. For example, if you pick the Euro from the left column and move along the horizontal line to the US Dollar, the percentage change displayed in the box will represent EUR (base)/USD (quote).
* The content presented above, whether from a third party or not, is considered as general advice only. This article should not be construed as containing investment advice, investment recommendations, an offer of or solicitation for any transactions in financial instruments.


