
XRP ‘Hot Capital’ Jumps 135%—How Do Bitcoin & Solana Compare?
On-chain data shows the XRP network has seen a strong jump in ‘Hot Capital’ recently. Here’s how this growth compares with Bitcoin and others.
XRP Among Cryptocurrencies Observing Surge In Hot Capital
In a new post on X, the on-chain analytics firm Glassnode has talked about how the Hot Capital of XRP has changed recently. The “Hot Capital” refers to that part of the cryptocurrency’s capital reserve that entered during the past week.
The capital reserve of any digital asset is measured through its “Realized Cap,” which is a capitalization model that calculates the total valuation of a cryptocurrency by equating the value of each token in circulation to the spot price at which it was last transacted on the network.
As the last transaction of any coin is likely to represent the last time it changed hands, the price at that time could be considered as its current cost basis. Thus, the Realized Cap essentially sums up the cost basis of all investors of the asset.
When this indicator’s value changes, capital could be assumed to be moving in or out of the cryptocurrency, depending on the direction of the change. In the context of the current topic, the Realized Cap of the entire network isn’t of interest, but only of a portion of it: the Hot Supply.
Below is the chart shared by the analytics firm that shows how the capital stored in the form of these young coins has changed for XRP during the last few months:
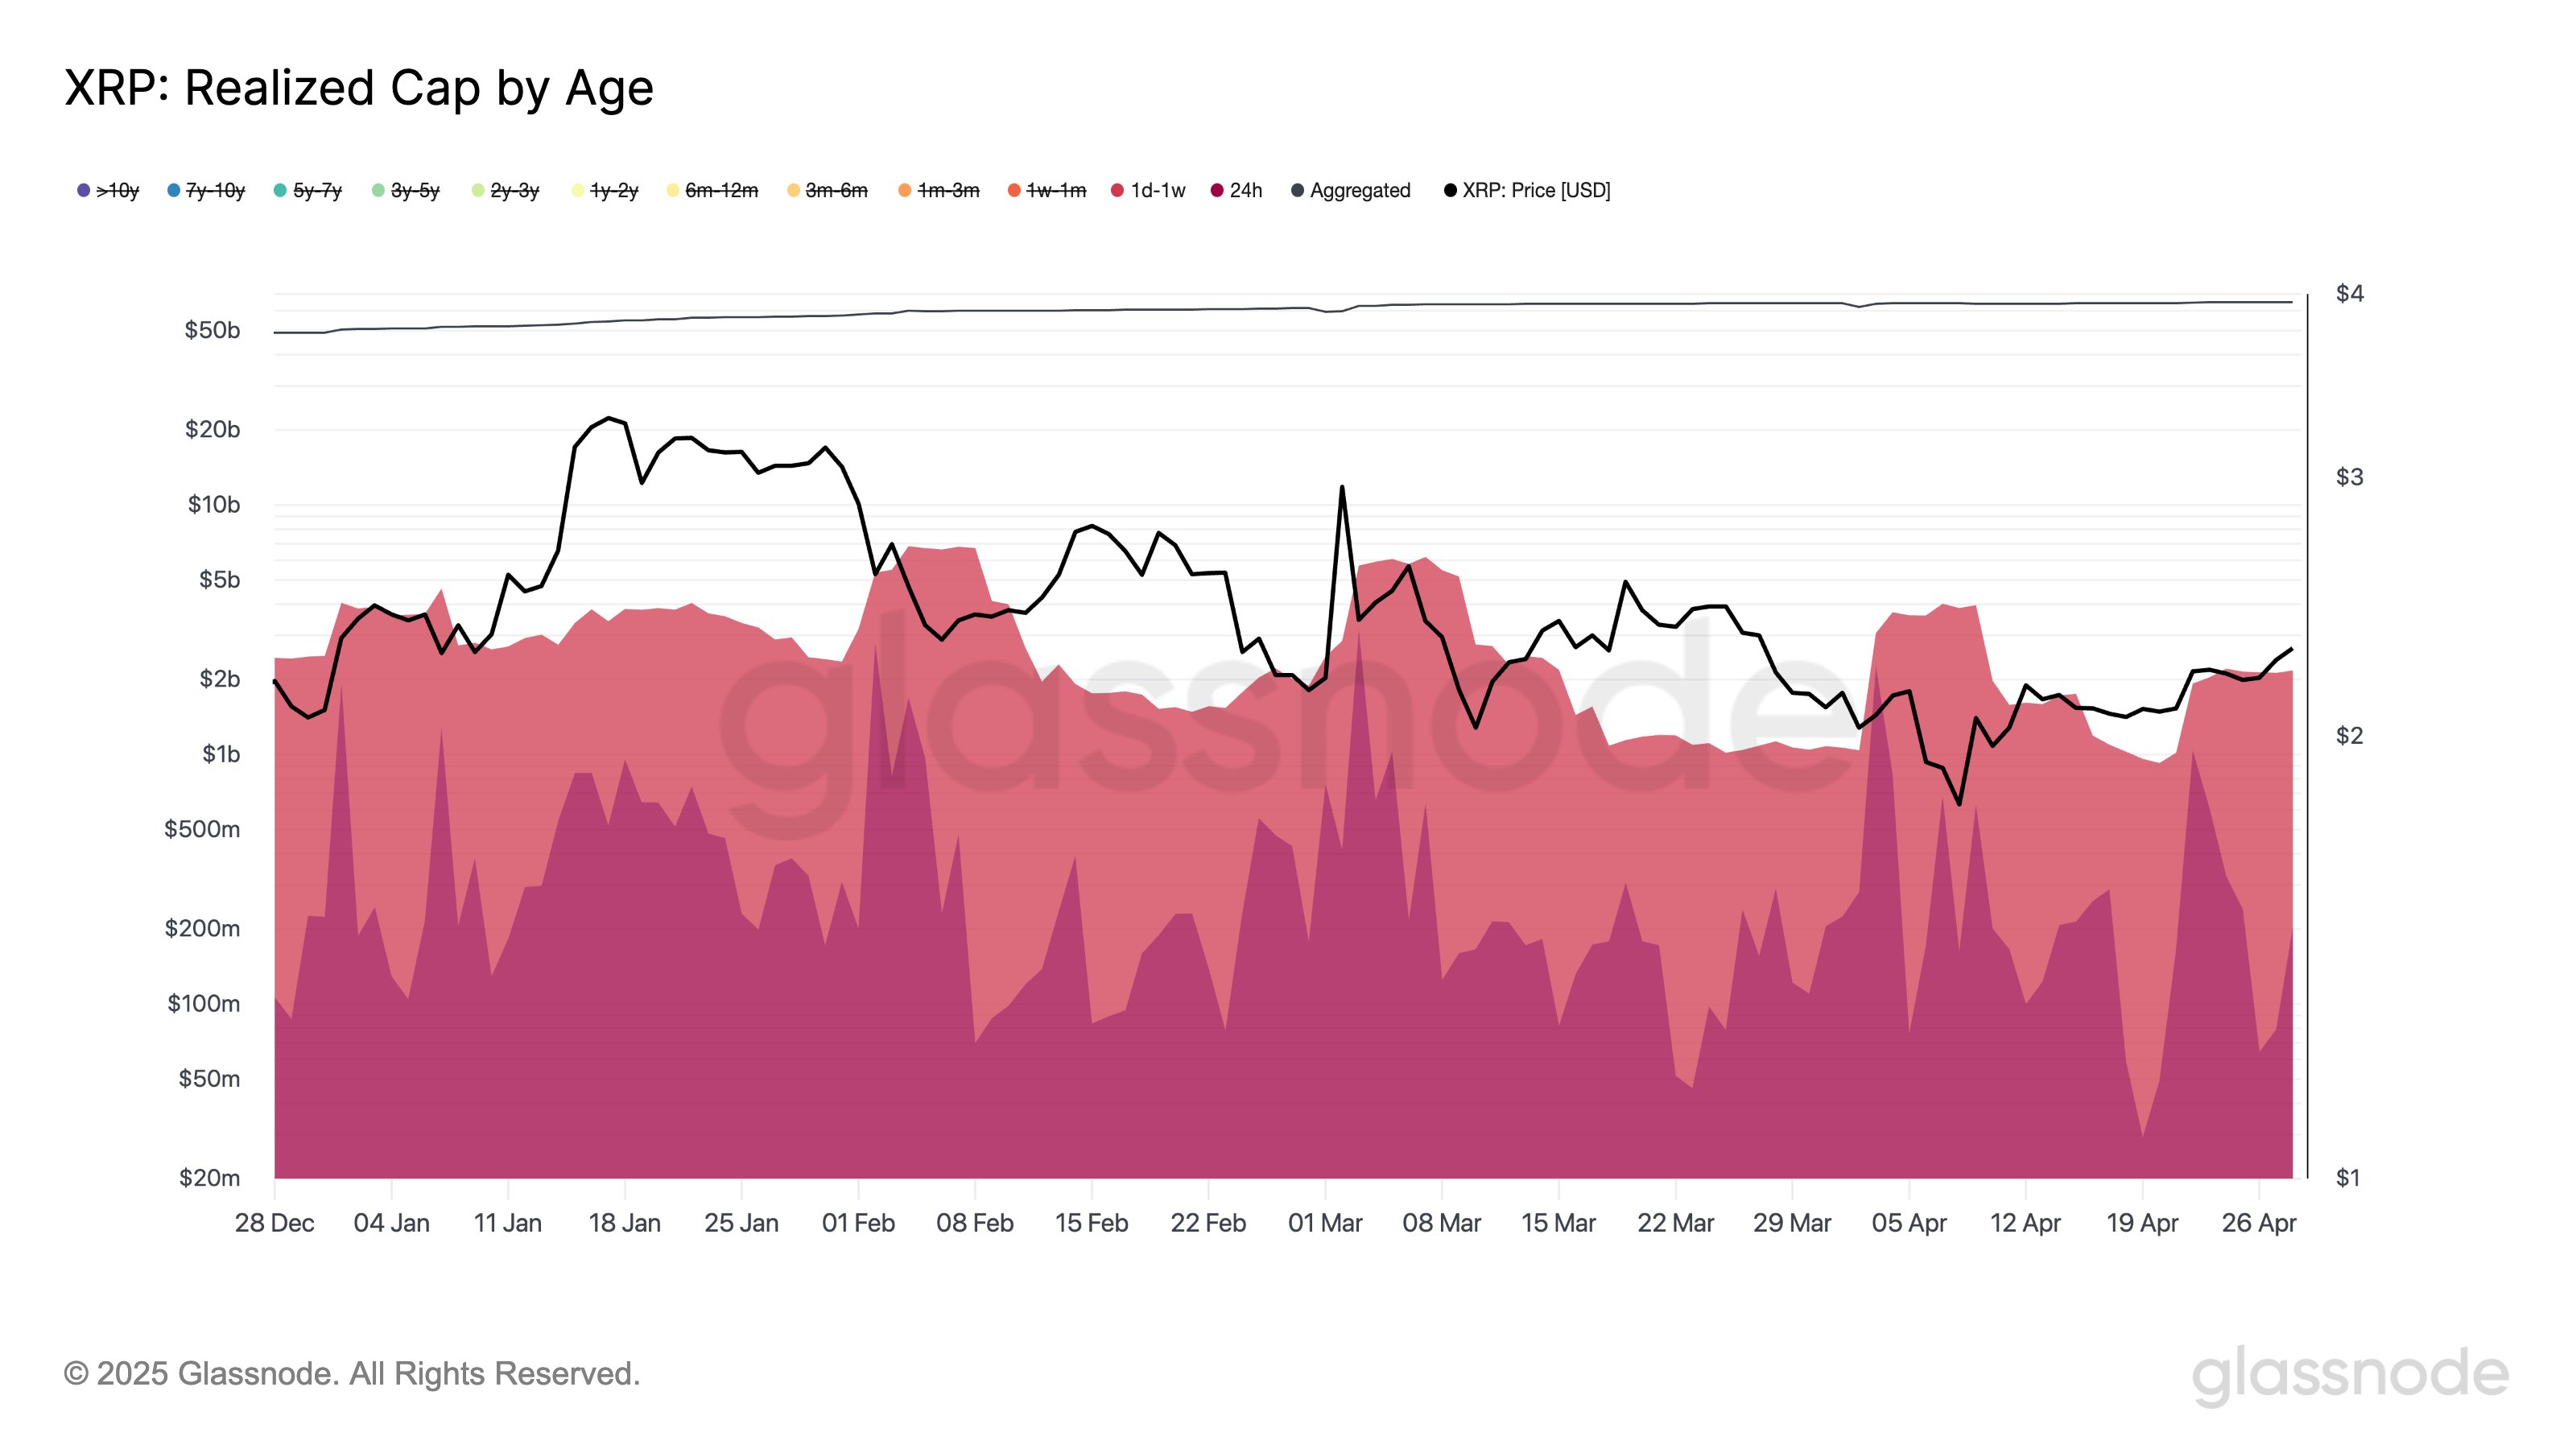
As is visible in the above graph, the Realized Cap associated with coins that moved during the last week has registered an increase for XRP recently, a potential signal that speculative capital is entering the cryptocurrency.
“XRP Hot Capital rose from $0.92B on 20 Apr to $2.17B on 28 Apr – a $1.25B (+134.9%) surge,” notes Glassnode. “Despite this rebound, the metric remains ~72% below its Dec 2024 peak of $7.66B.”
XRP isn’t the only digital asset that’s observing an increase in short-term holder activity. As the analytics firm has pointed out in other X posts, Bitcoin, Ethereum, and Solana have all witnessed a considerable rise in Hot Capital during the same period.
First, here is the chart for Bitcoin, displaying how the metric has gone through a 92% surge to $39.1 billion:
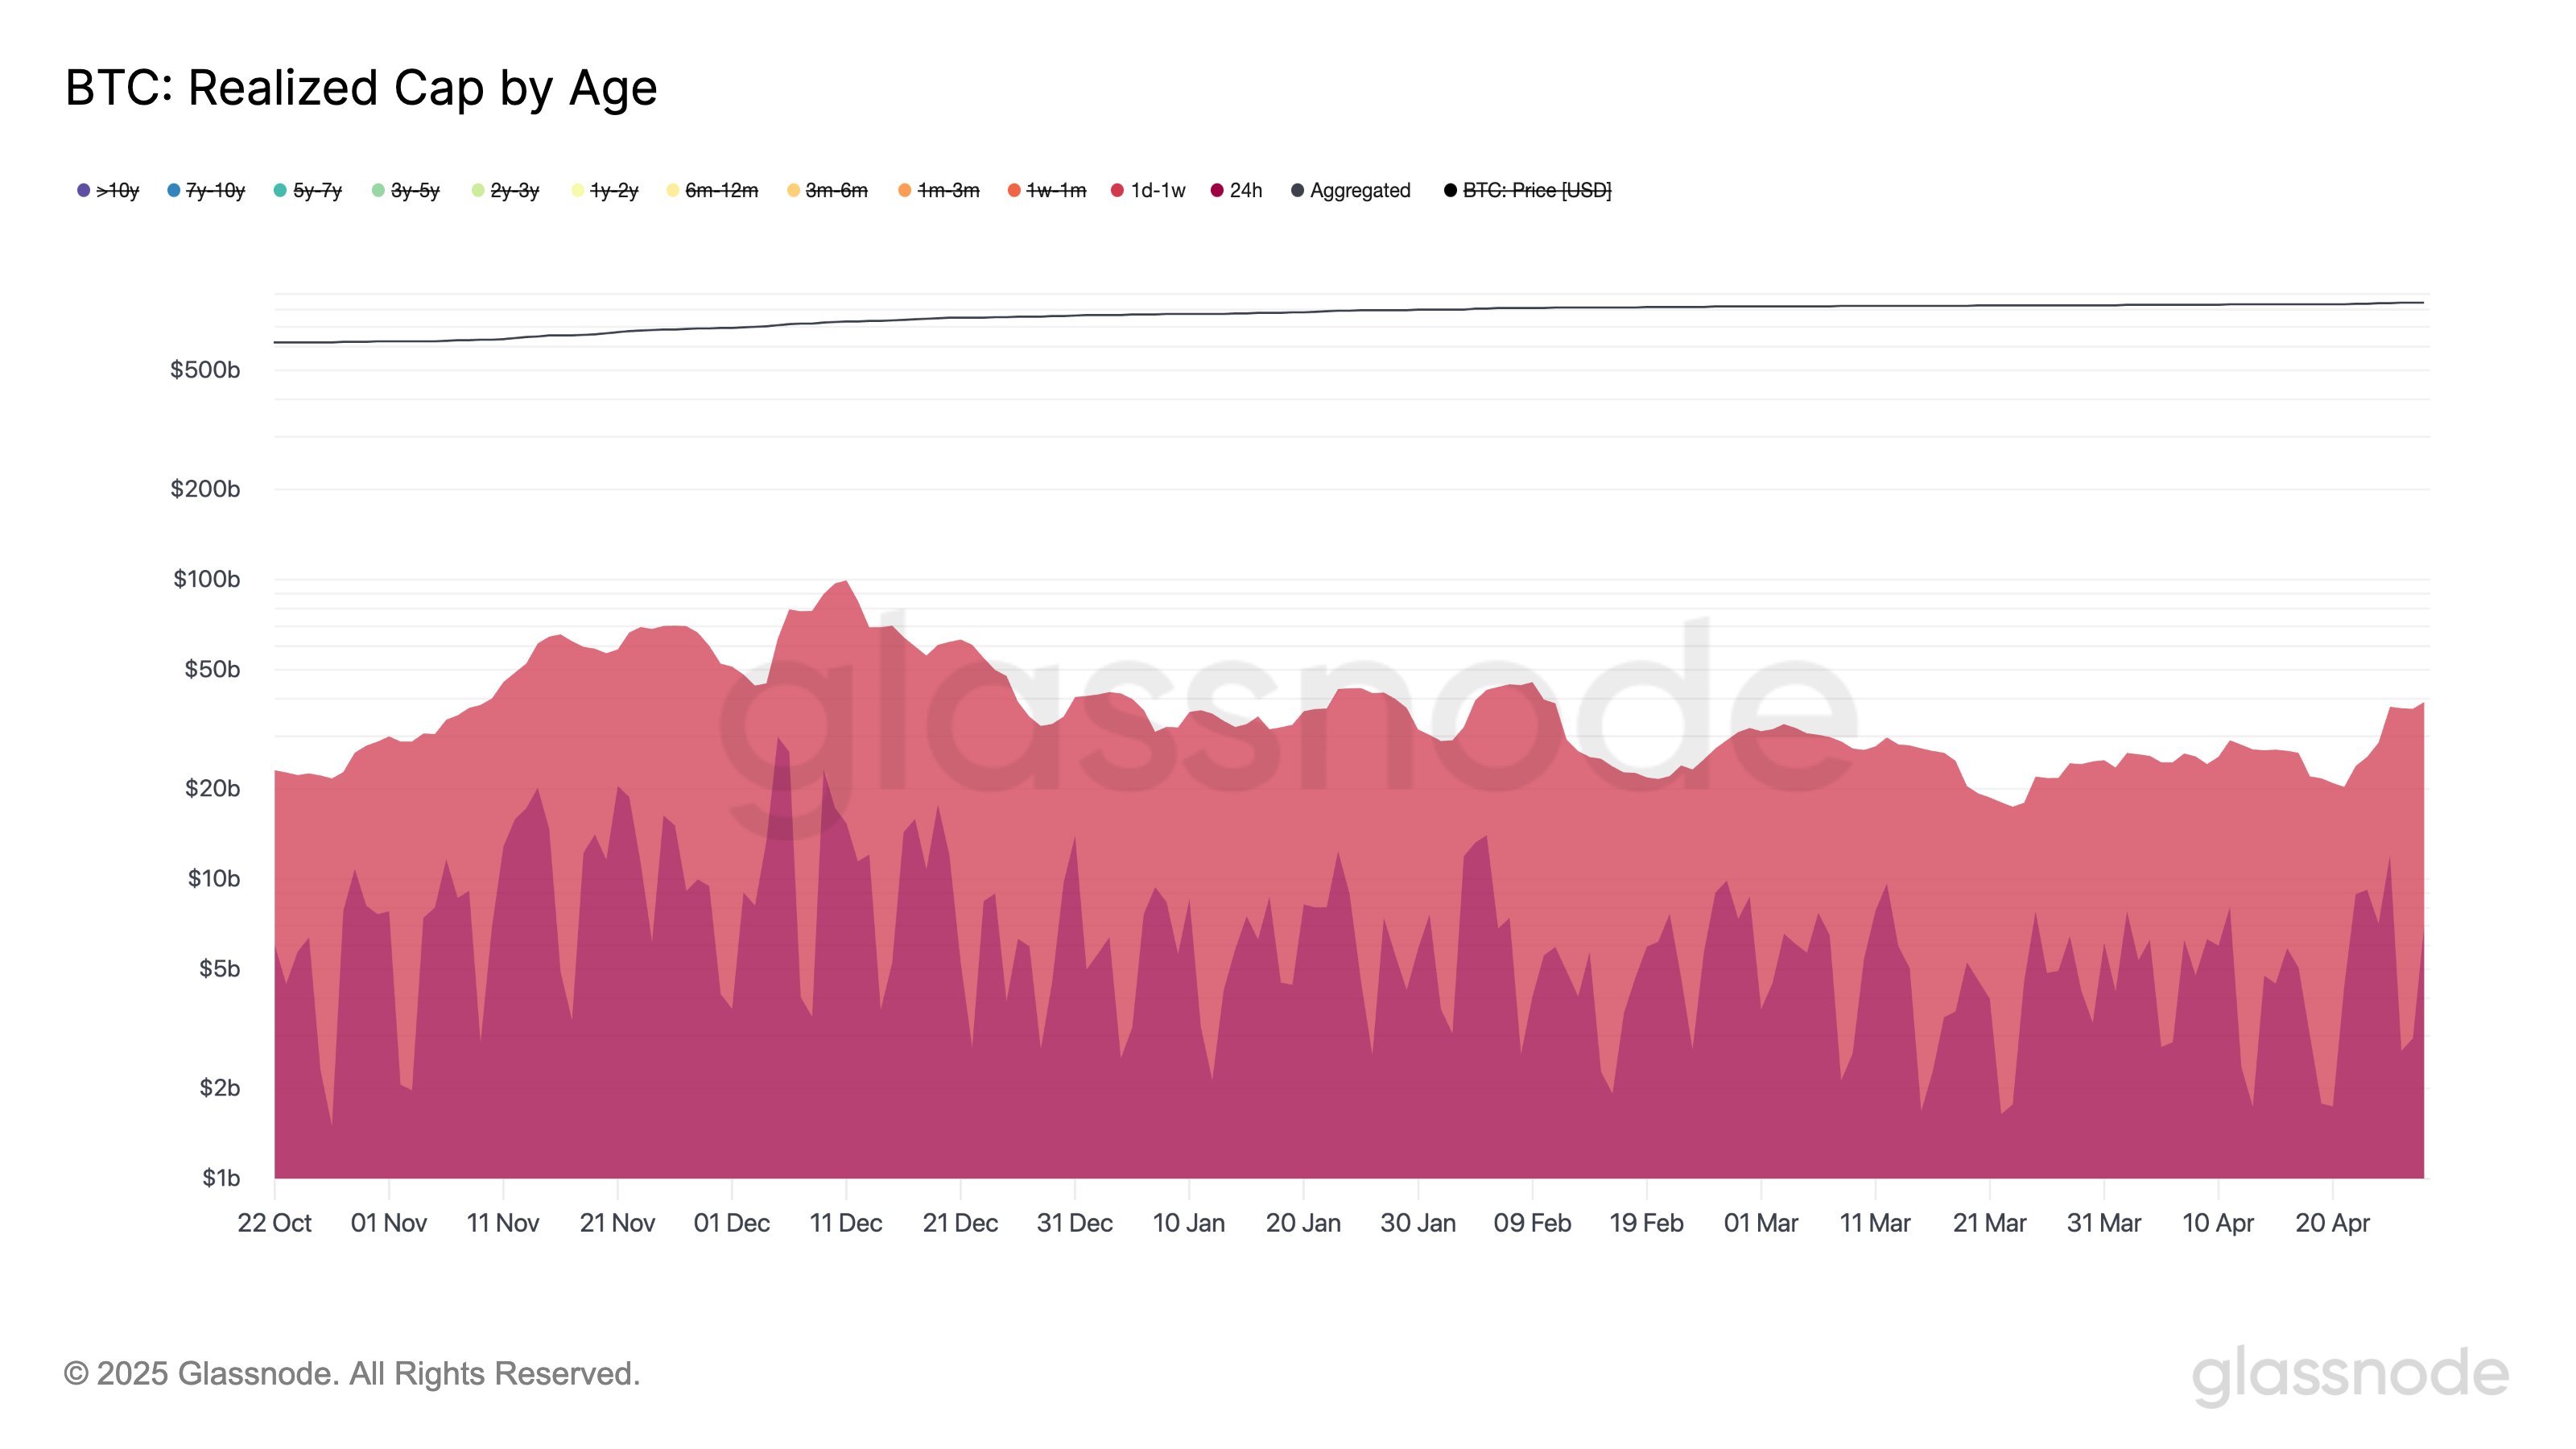
According to Glassnode, this turnaround in the Hot Capital is one of the fastest upticks that the indicator has seen for Bitcoin in recent months. Though the percentage increase witnessed by the metric is still lower than the one for XRP.
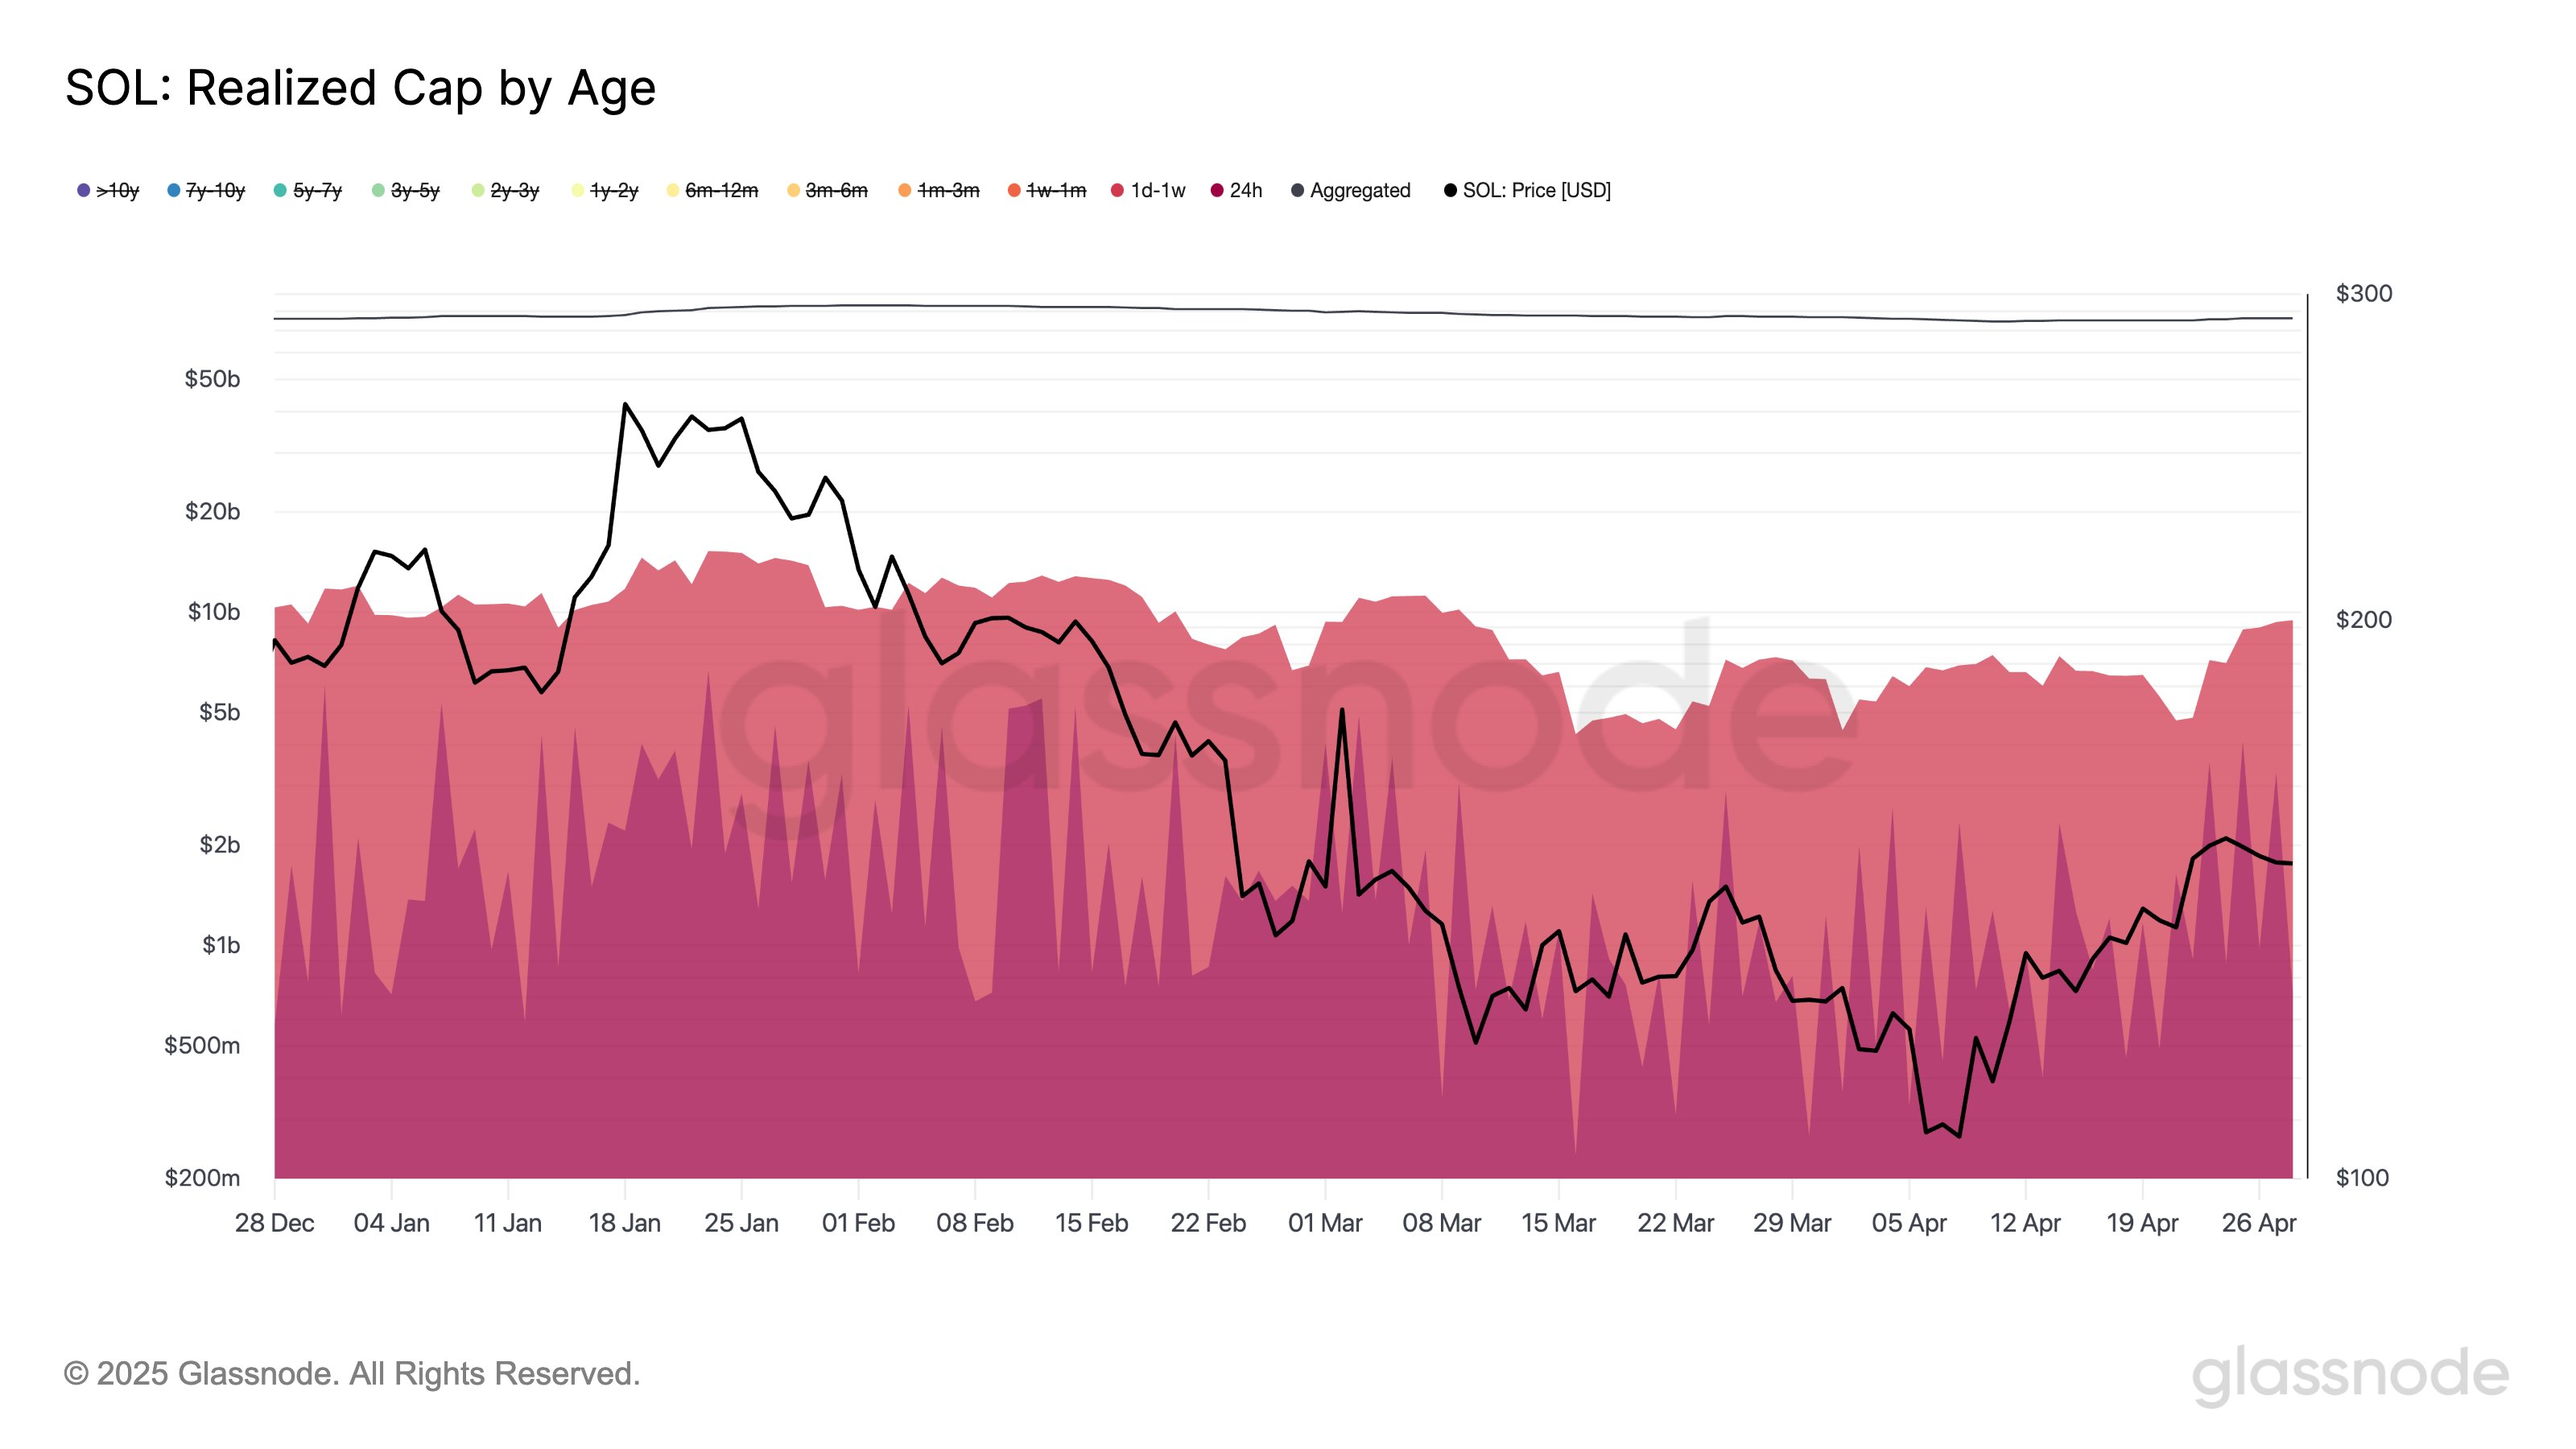
Ethereum and Solana are also similar in that, with ETH in particular notably lagging behind with only a 54% increase since April 17th.
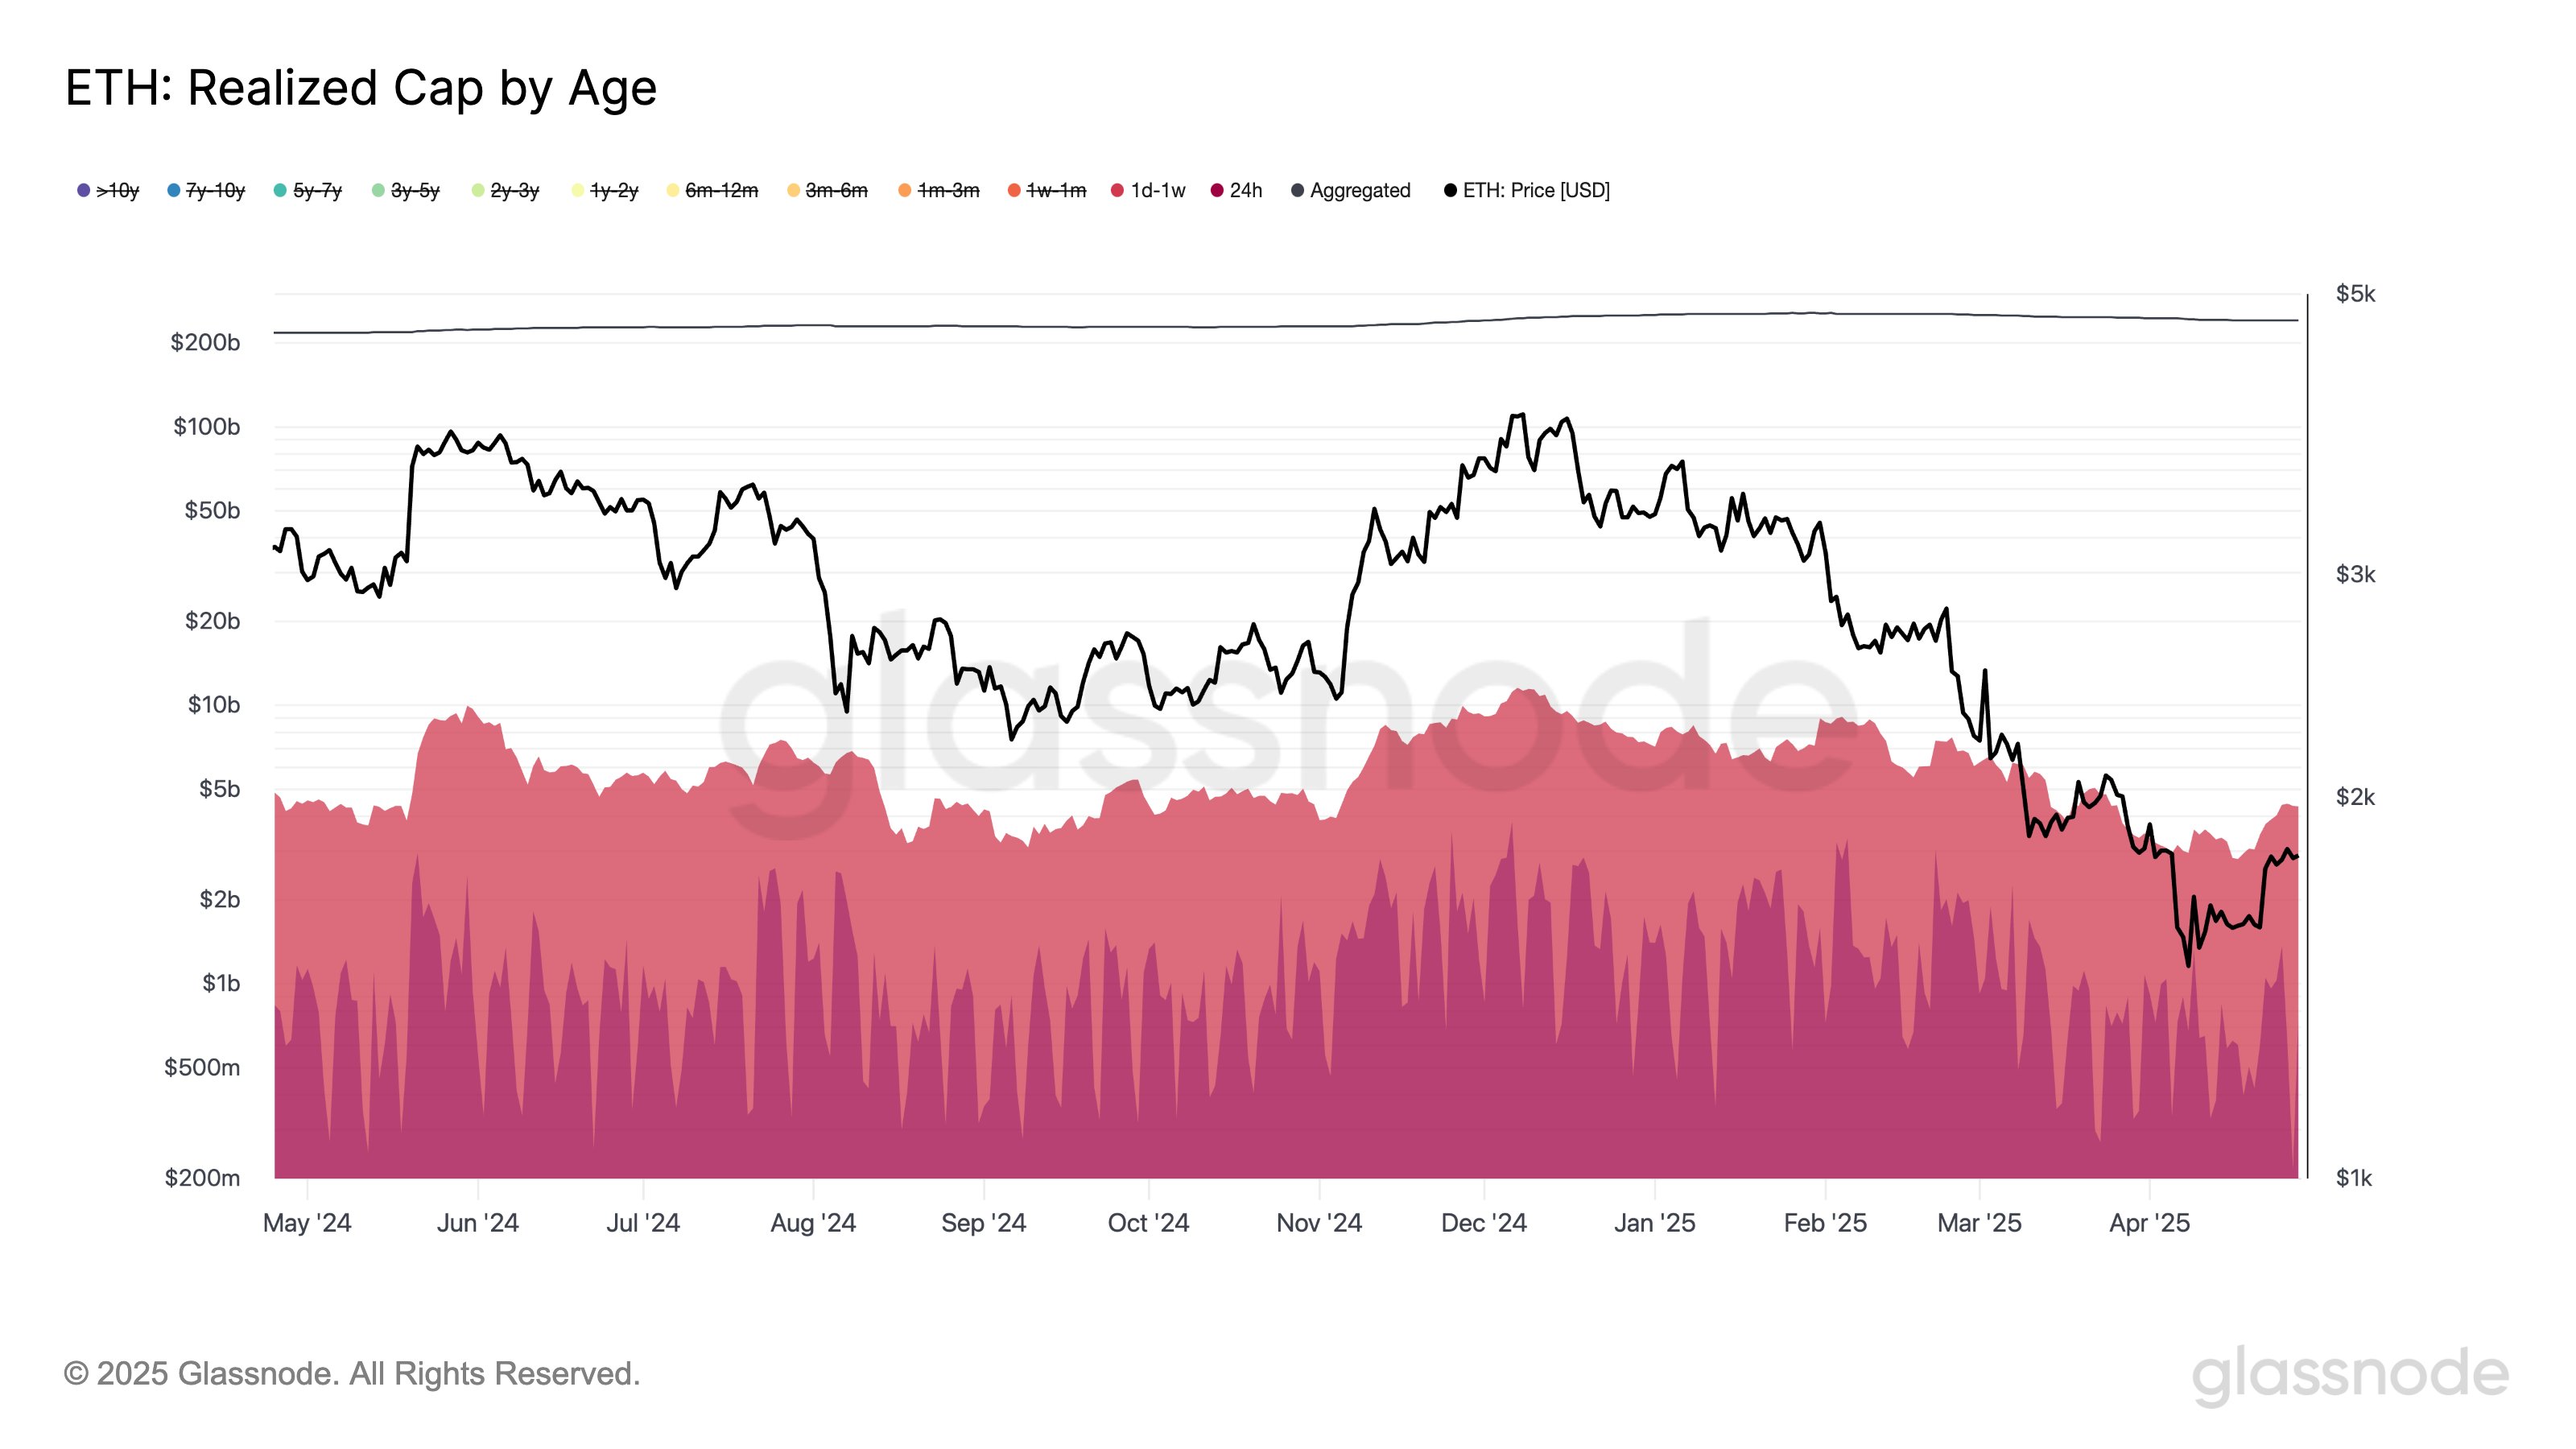
While Hot Capital has grown across these cryptocurrencies, its value still remains far below the high observed earlier in the cycle, an indication that speculative activity hasn’t quite made a full comeback yet. More specifically, the indicator is sitting at 60% down for both Bitcoin and Ethereum, and 72% for XRP.
The asset that is currently the closest to making a return is Solana, with the metric being around 38% following a weekly jump of 100%.
XRP Price
XRP crossed the $2.30 mark earlier in the week, but it seems the asset has seen a pullback since then as its price is back at $2.17.
Recommended Articles


