Dow Jones tanks over 200 points as US economy shrinks, recession fears loom
- US economy contracts in Q1, first contraction since 2022, driven by surging imports.
- ADP jobs data disappoints; core PCE holds at 2.6%, stoking stagflation concerns.
- Fed seen cutting rates as early as July; markets price in nearly 100 bps of easing for 2025.
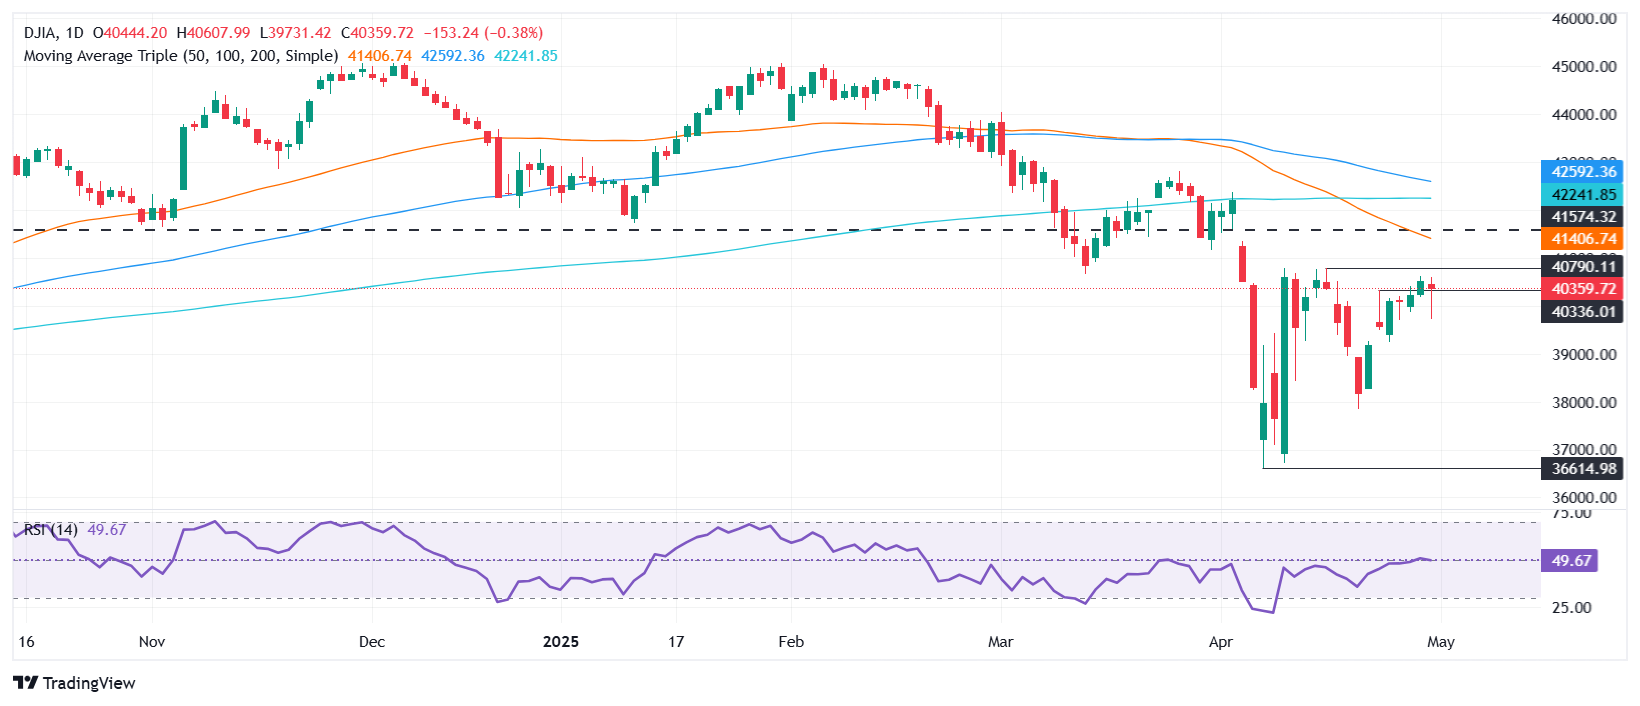
The Dow Jones Industrial Average (DJIA) plunged more than 200 points or over 0.51% as the economy in the United States (US) contracted for the first time since 2022, fueling fears that the economy could be at risk of a recession under the Trump administration. At the time of writing, the DJIA clings to the 40,300 mark after falling from daily peaks reached at 40,614.
DJIA drops 0.51% to 40,300 as Q1 GDP contracts, job growth slows, and traders bet on Fed rate cuts
The US Commerce Department revealed that Gross Domestic Product (GDP) for the first quarter of 2025 shrank -0.3%, missing the mark for a 0.3% expansion and a drop from Q4 2024's 2.4% increase. Digging into the report, the strong surge in imports of over 41% was the main reason for the softer reading.
Other data amid a busy US economic docket revealed that companies hired fewer people than expected. The ADP National Employment Change in April missed estimates of 115K, coming at 62K. At the same time, the US Federal Reserve’s (Fed) preferred inflation gauge revealed by the US Bureau of Economic Analysis, the Core Personal Consumption Expenditures (PCE) Price Index, rose by 2.6% as projected, down from the 3% rise in February.
After the GDP data, Wall Street's major indices plunged, though they trimmed some of their losses as another measure of data suggested household spending remains solid. Personal Spending in March increased by 0.7% MoM, up from February’s 0.5% mark.
Recently, US President Donald Trump said the “one big beautiful bill” may be bigger than tariffs, adding that any tax increase is unsustainable if 2017 cuts are not continued. He blamed ex-President Joe Biden for the economic shrinkage even though companies were bracing for tariffs and front-loaded imports before they were enacted, which was a counterweight to healthy spending and investment.
Fed expected to cut rates
Data from the Chicago Board of Trade (CBOT) shows the swaps market expect 99 basis points of easing toward the end of the year, as revealed by the December 2025 fed funds rate futures contract.
Traders had priced in a 100% chance the Fed would cut rates at the July 30 meeting. Fawad Razaqzada at City Index and Forex.com said, “The Fed is now more likely to step in sooner with its rate cuts to support an ailing economy, while the weakness in data could also encourage Trump to ease off on tariffs and make deals, quicker.”
Ahead in the week, traders are eyeing the release of the ISM Manufacturing PMI for April and Nonfarm Payroll figures for the same period.
Dow Jones price forecast
The Dow Jones remains neutral to downwardly bias despite recovering some ground and reclaiming the 40,000 mark. Although buyers cleared the 20-day Simple Moving Average (SMA) of 39,800, as long as the DJIA remains unable to clear the 41,000 figure, the risks for a bearish resumption loom.
If buyers reclaim 41,000, they could test key resistance levels lying overhead. First, the 50-day SMA at 41,399, followed by the 200-day SMA at 42,274. On further strength, the 100-day SMA at 42,535.
Conversely, a drop below 40,000 clears the path to test April 23’s low of 39,486, followed by the April 22 high of 39,271 to close the gap witnessed between April 22 and 23.

Dow Jones FAQs
The Dow Jones Industrial Average, one of the oldest stock market indices in the world, is compiled of the 30 most traded stocks in the US. The index is price-weighted rather than weighted by capitalization. It is calculated by summing the prices of the constituent stocks and dividing them by a factor, currently 0.152. The index was founded by Charles Dow, who also founded the Wall Street Journal. In later years it has been criticized for not being broadly representative enough because it only tracks 30 conglomerates, unlike broader indices such as the S&P 500.
Many different factors drive the Dow Jones Industrial Average (DJIA). The aggregate performance of the component companies revealed in quarterly company earnings reports is the main one. US and global macroeconomic data also contributes as it impacts on investor sentiment. The level of interest rates, set by the Federal Reserve (Fed), also influences the DJIA as it affects the cost of credit, on which many corporations are heavily reliant. Therefore, inflation can be a major driver as well as other metrics which impact the Fed decisions.
Dow Theory is a method for identifying the primary trend of the stock market developed by Charles Dow. A key step is to compare the direction of the Dow Jones Industrial Average (DJIA) and the Dow Jones Transportation Average (DJTA) and only follow trends where both are moving in the same direction. Volume is a confirmatory criteria. The theory uses elements of peak and trough analysis. Dow’s theory posits three trend phases: accumulation, when smart money starts buying or selling; public participation, when the wider public joins in; and distribution, when the smart money exits.
There are a number of ways to trade the DJIA. One is to use ETFs which allow investors to trade the DJIA as a single security, rather than having to buy shares in all 30 constituent companies. A leading example is the SPDR Dow Jones Industrial Average ETF (DIA). DJIA futures contracts enable traders to speculate on the future value of the index and Options provide the right, but not the obligation, to buy or sell the index at a predetermined price in the future. Mutual funds enable investors to buy a share of a diversified portfolio of DJIA stocks thus providing exposure to the overall index.

