Fartcoin recovery gains traction on steady confidence of whales

Source Fxstreet
  • Fartcoin extends its recovery for the third consecutive day, posting 12% gains by press time on Thursday. 
  • A 30% spike in Fartcoin futures Open Interest and heightened funding rates reflect elevated retail demand in the derivatives market. 
  • On-chain data showcases strong support from large wallet investors, fueling the short-term recovery. 

Fartcoin (FARTCOIN) is regaining strength, rising 12% by press time on Thursday, and tests the upper resistance trendline of a falling channel pattern on the daily chart. Both the derivatives and on-chain data suggest that the renewed demand for the meme coin is backed by large wallet investors, commonly referred to as whales. Technically, Fartcoin is poised for a breakout rally amid early signals of resurgent bullish momentum.  

Whales are building bullish Fartcoin positions

Retail interest in Fartcoin is resurfacing, aligning with the short-term recovery, increasing the likelihood that the meme coin can sustain bullish momentum. According to CoinGlass, the FARTCOIN futures Open Interest (OI) has risen by 30% to $220.69 million in the last 24 hours. This sharp increase in OI reflects a massive buying of long positions by traders anticipating further gains. 
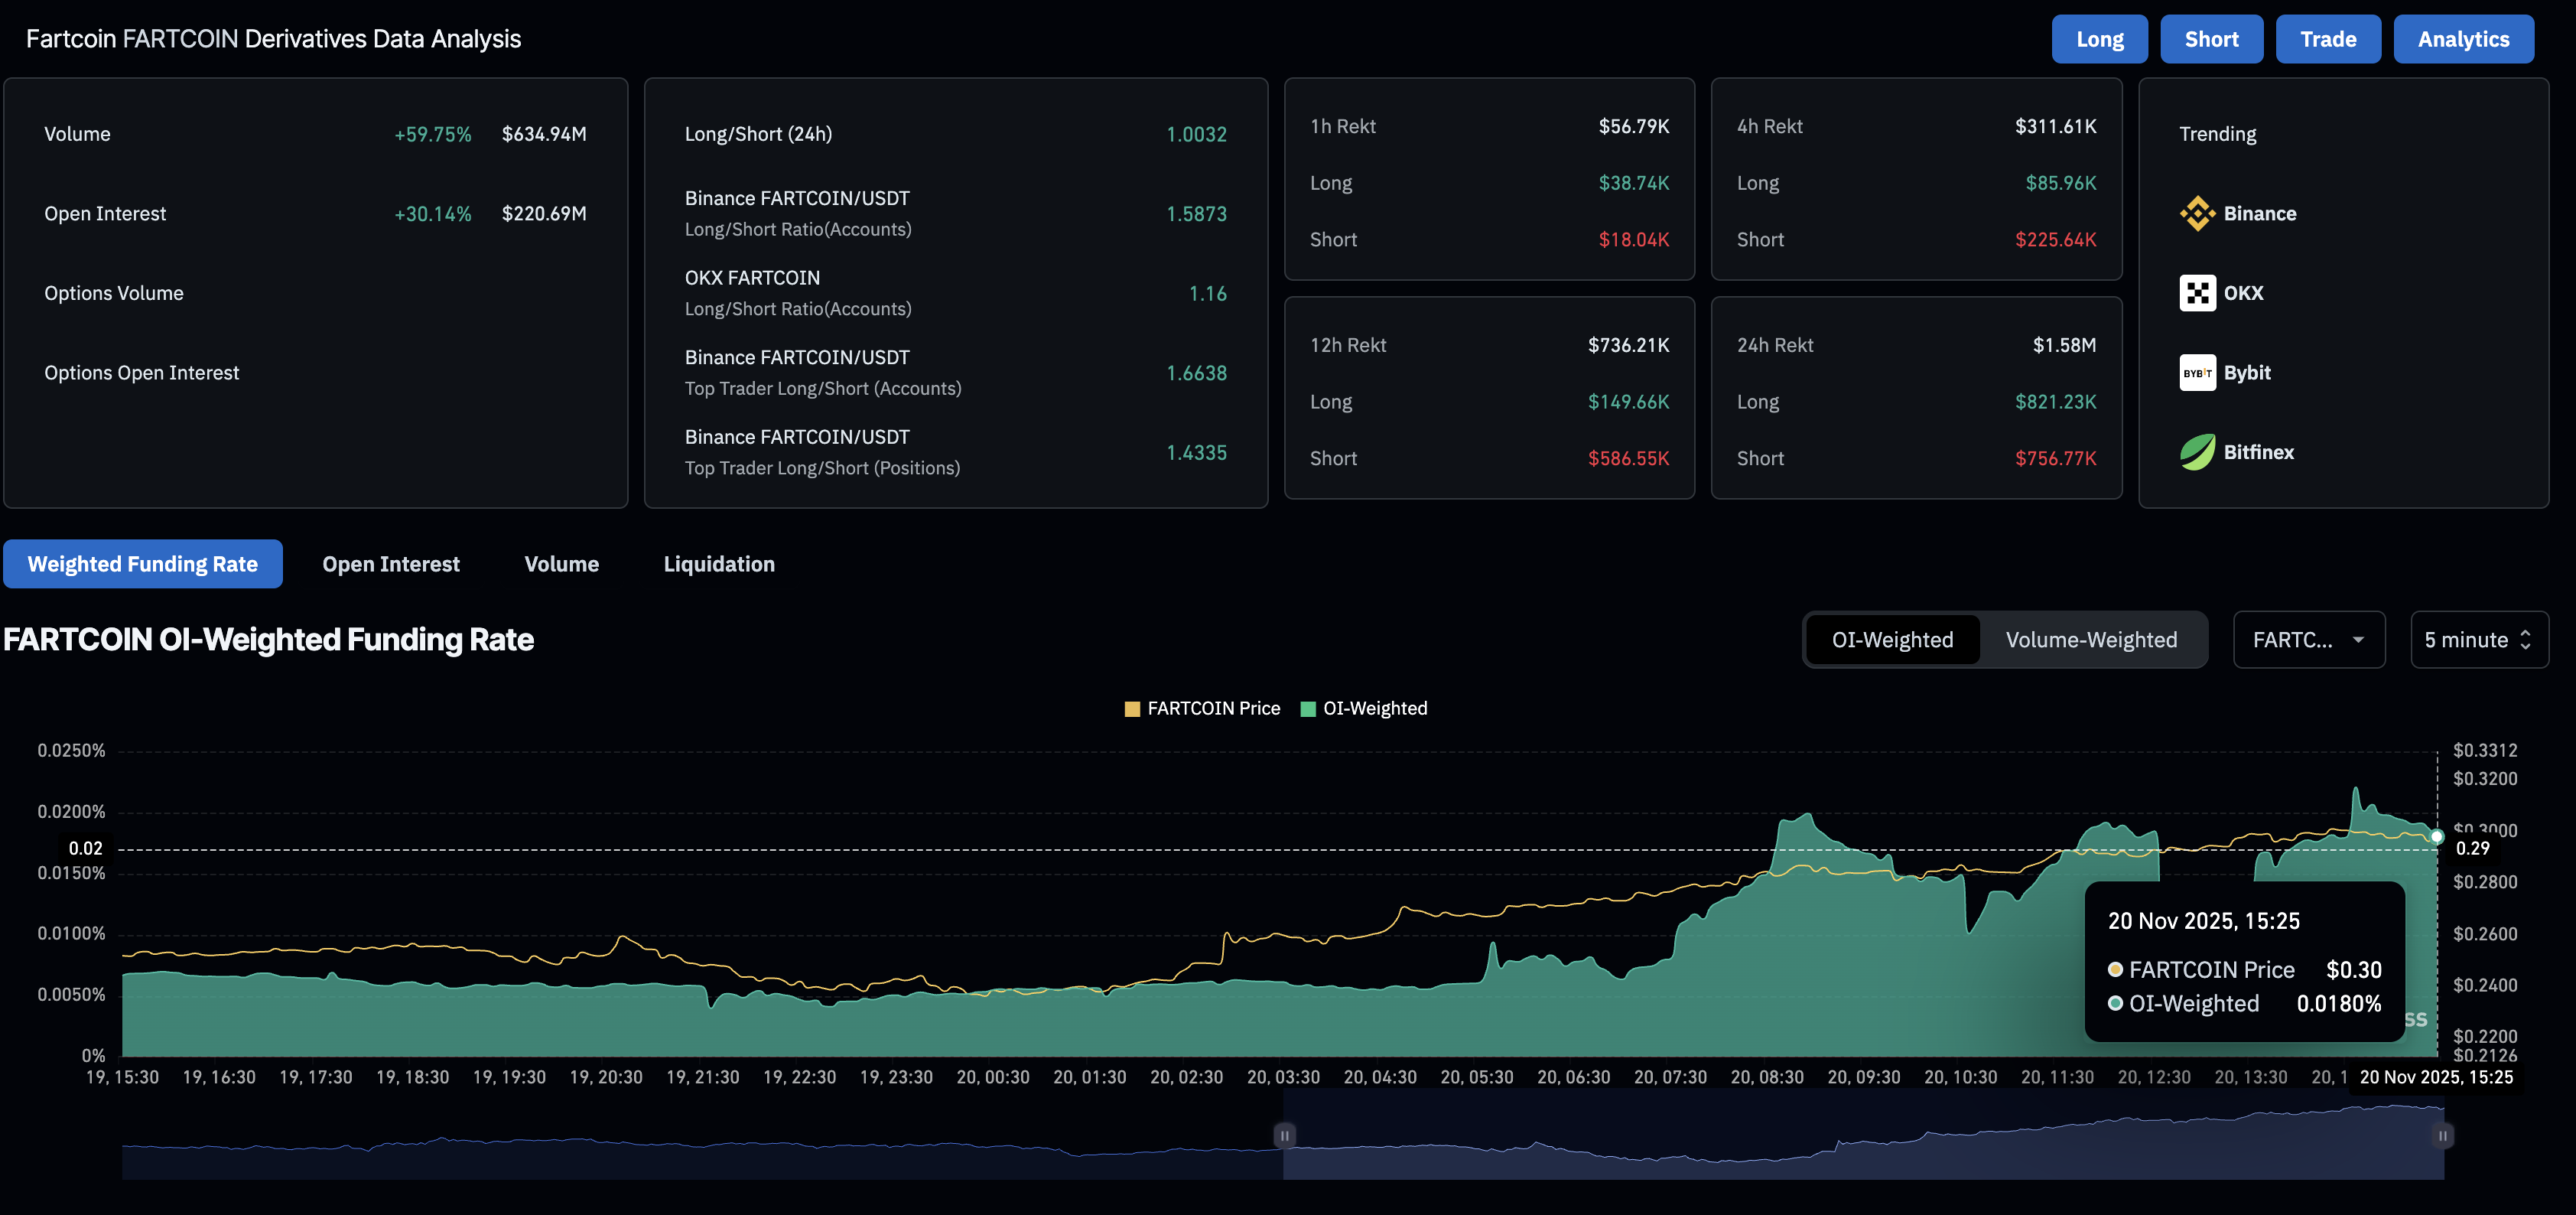
Fartcoin derivatives data. Source: CoinGlass

CryptoQuant data shows that the OI surge is driven by whales, as evidenced by the average order size. Apart from derivatives, the whales are buying in the spot market, signaling strong confidence in the meme coin. 
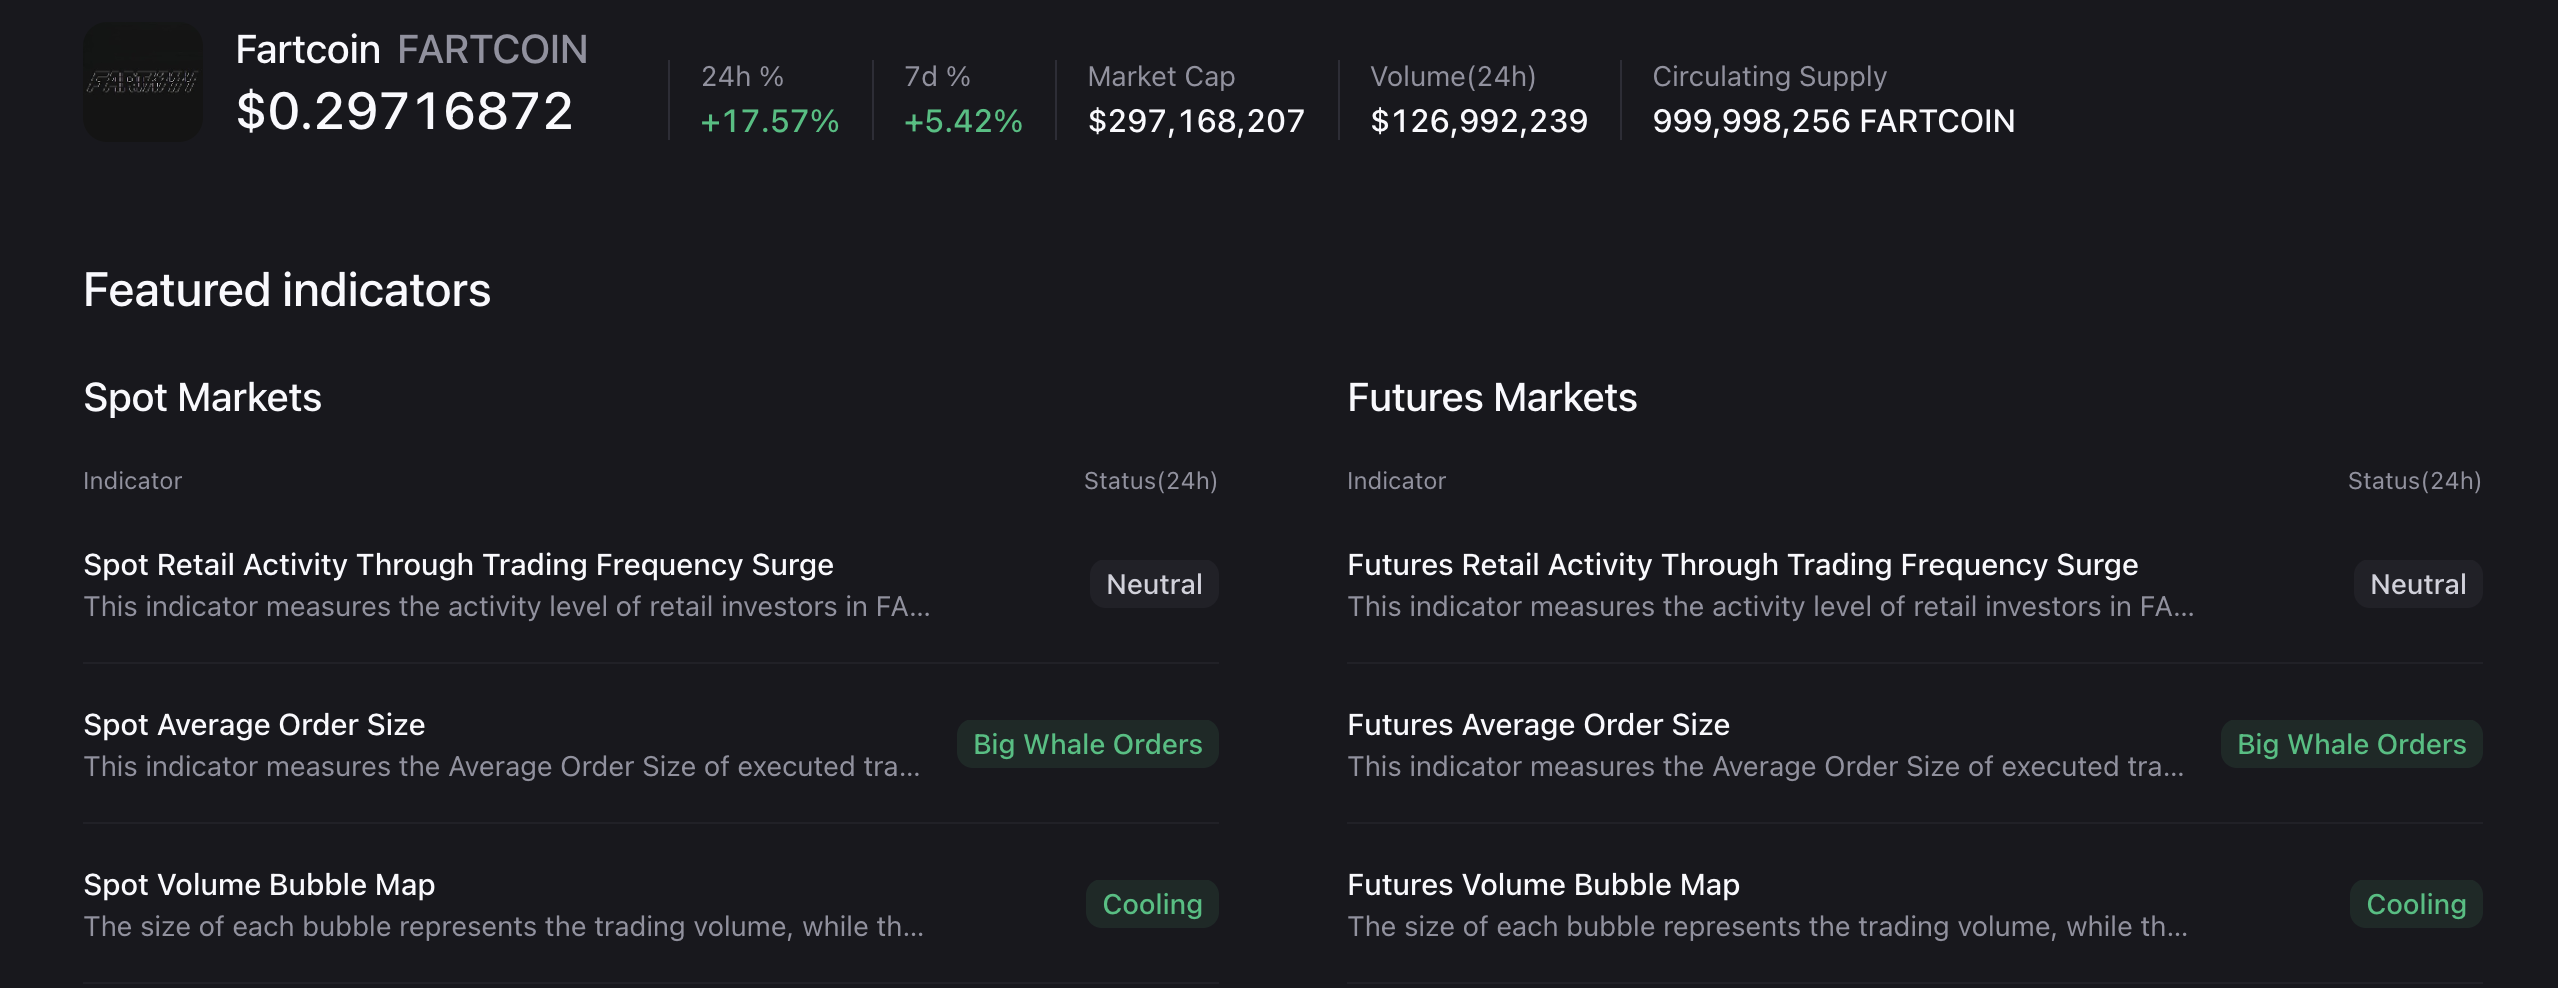
Fartcoin derivatives indicators. Source: CryptoQuant.

Santiment data shows that investors with 10 million to 1 billion tokens have increased their exposure to 47.70% of the on-chain supply, up from 45.87% on Sunday. As large wallet investors acquire more tokens, FARTCOIN is likely to surge as supply declines and sentiment strengthens, with smart money signaling conviction. 
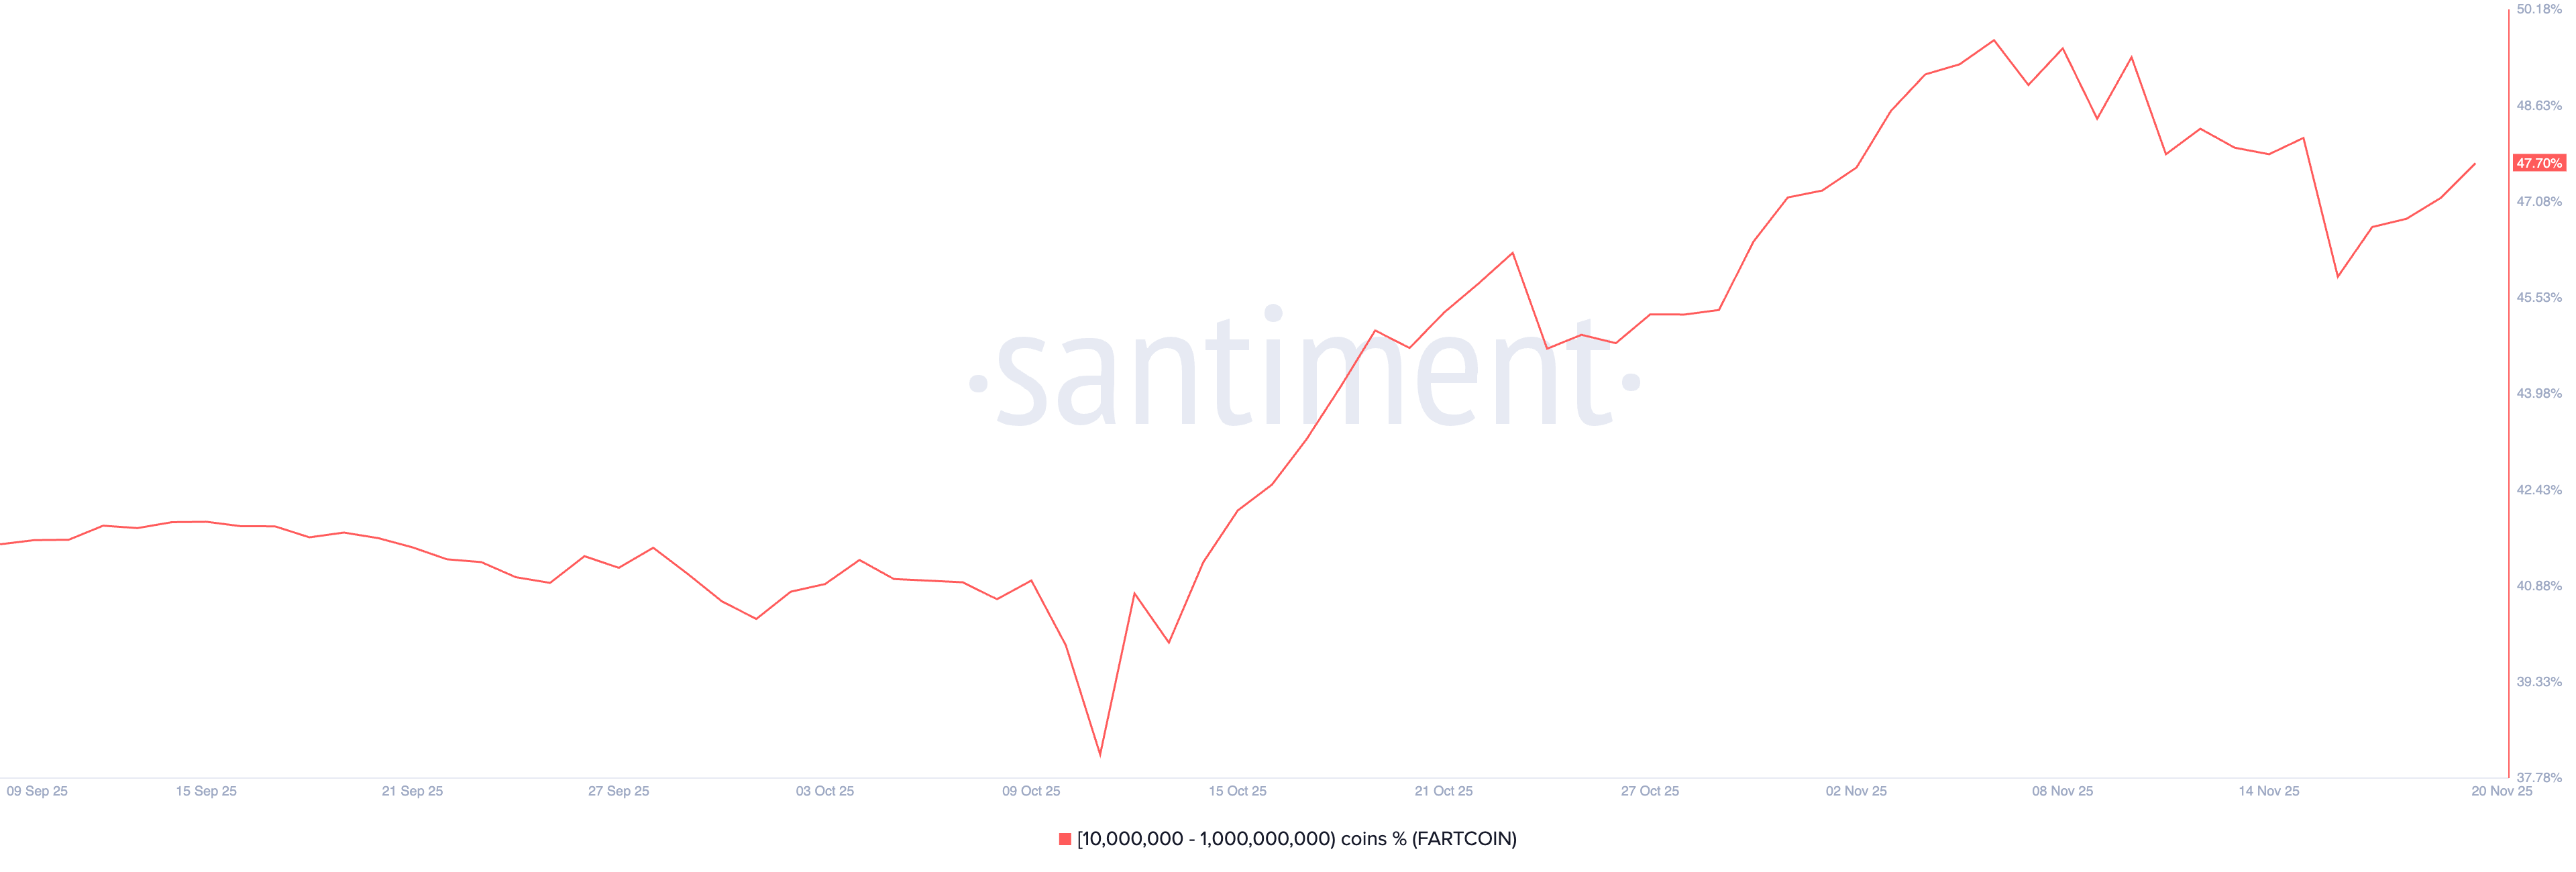
FARTCOIN supply distribution. Source: Santiment.

Fartcoin builds strength for a potential breakout rally 

Fartcoin’s recovery challenges a local resistance trendline of a falling channel pattern on the daily chart, near the $0.30 round figure. If the Solana-based meme coin successfully holds a daily close above this level, it could confirm the pattern breakout and kickstart a bullish trend. 

A potential breakout rally could target the declining 50-day Exponential Moving Average (EMA) at $0.39, followed by the 50% Fibonacci retracement, drawn from the $1.69 peak of July 22 and the $0.17 low of October 10, at $0.54. 

Corroborating the chances of a breakout rally, the Relative Strength Index (RSI) at 48 is gradually ascending towards the midline as selling pressure wanes. At the same time, the Moving Average Convergence Divergence (MACD) regains buoyancy, extending the uptrend above the signal line to avoid a crossover, with rising green histogram bars signaling renewed bullish momentum. 

Meanwhile, the Rate of Change (ROC) at 3.54 resurfaces above the zero line, marking a positive shift in trend momentum. A steady rise in ROC above zero indicates stronger bullish momentum. 
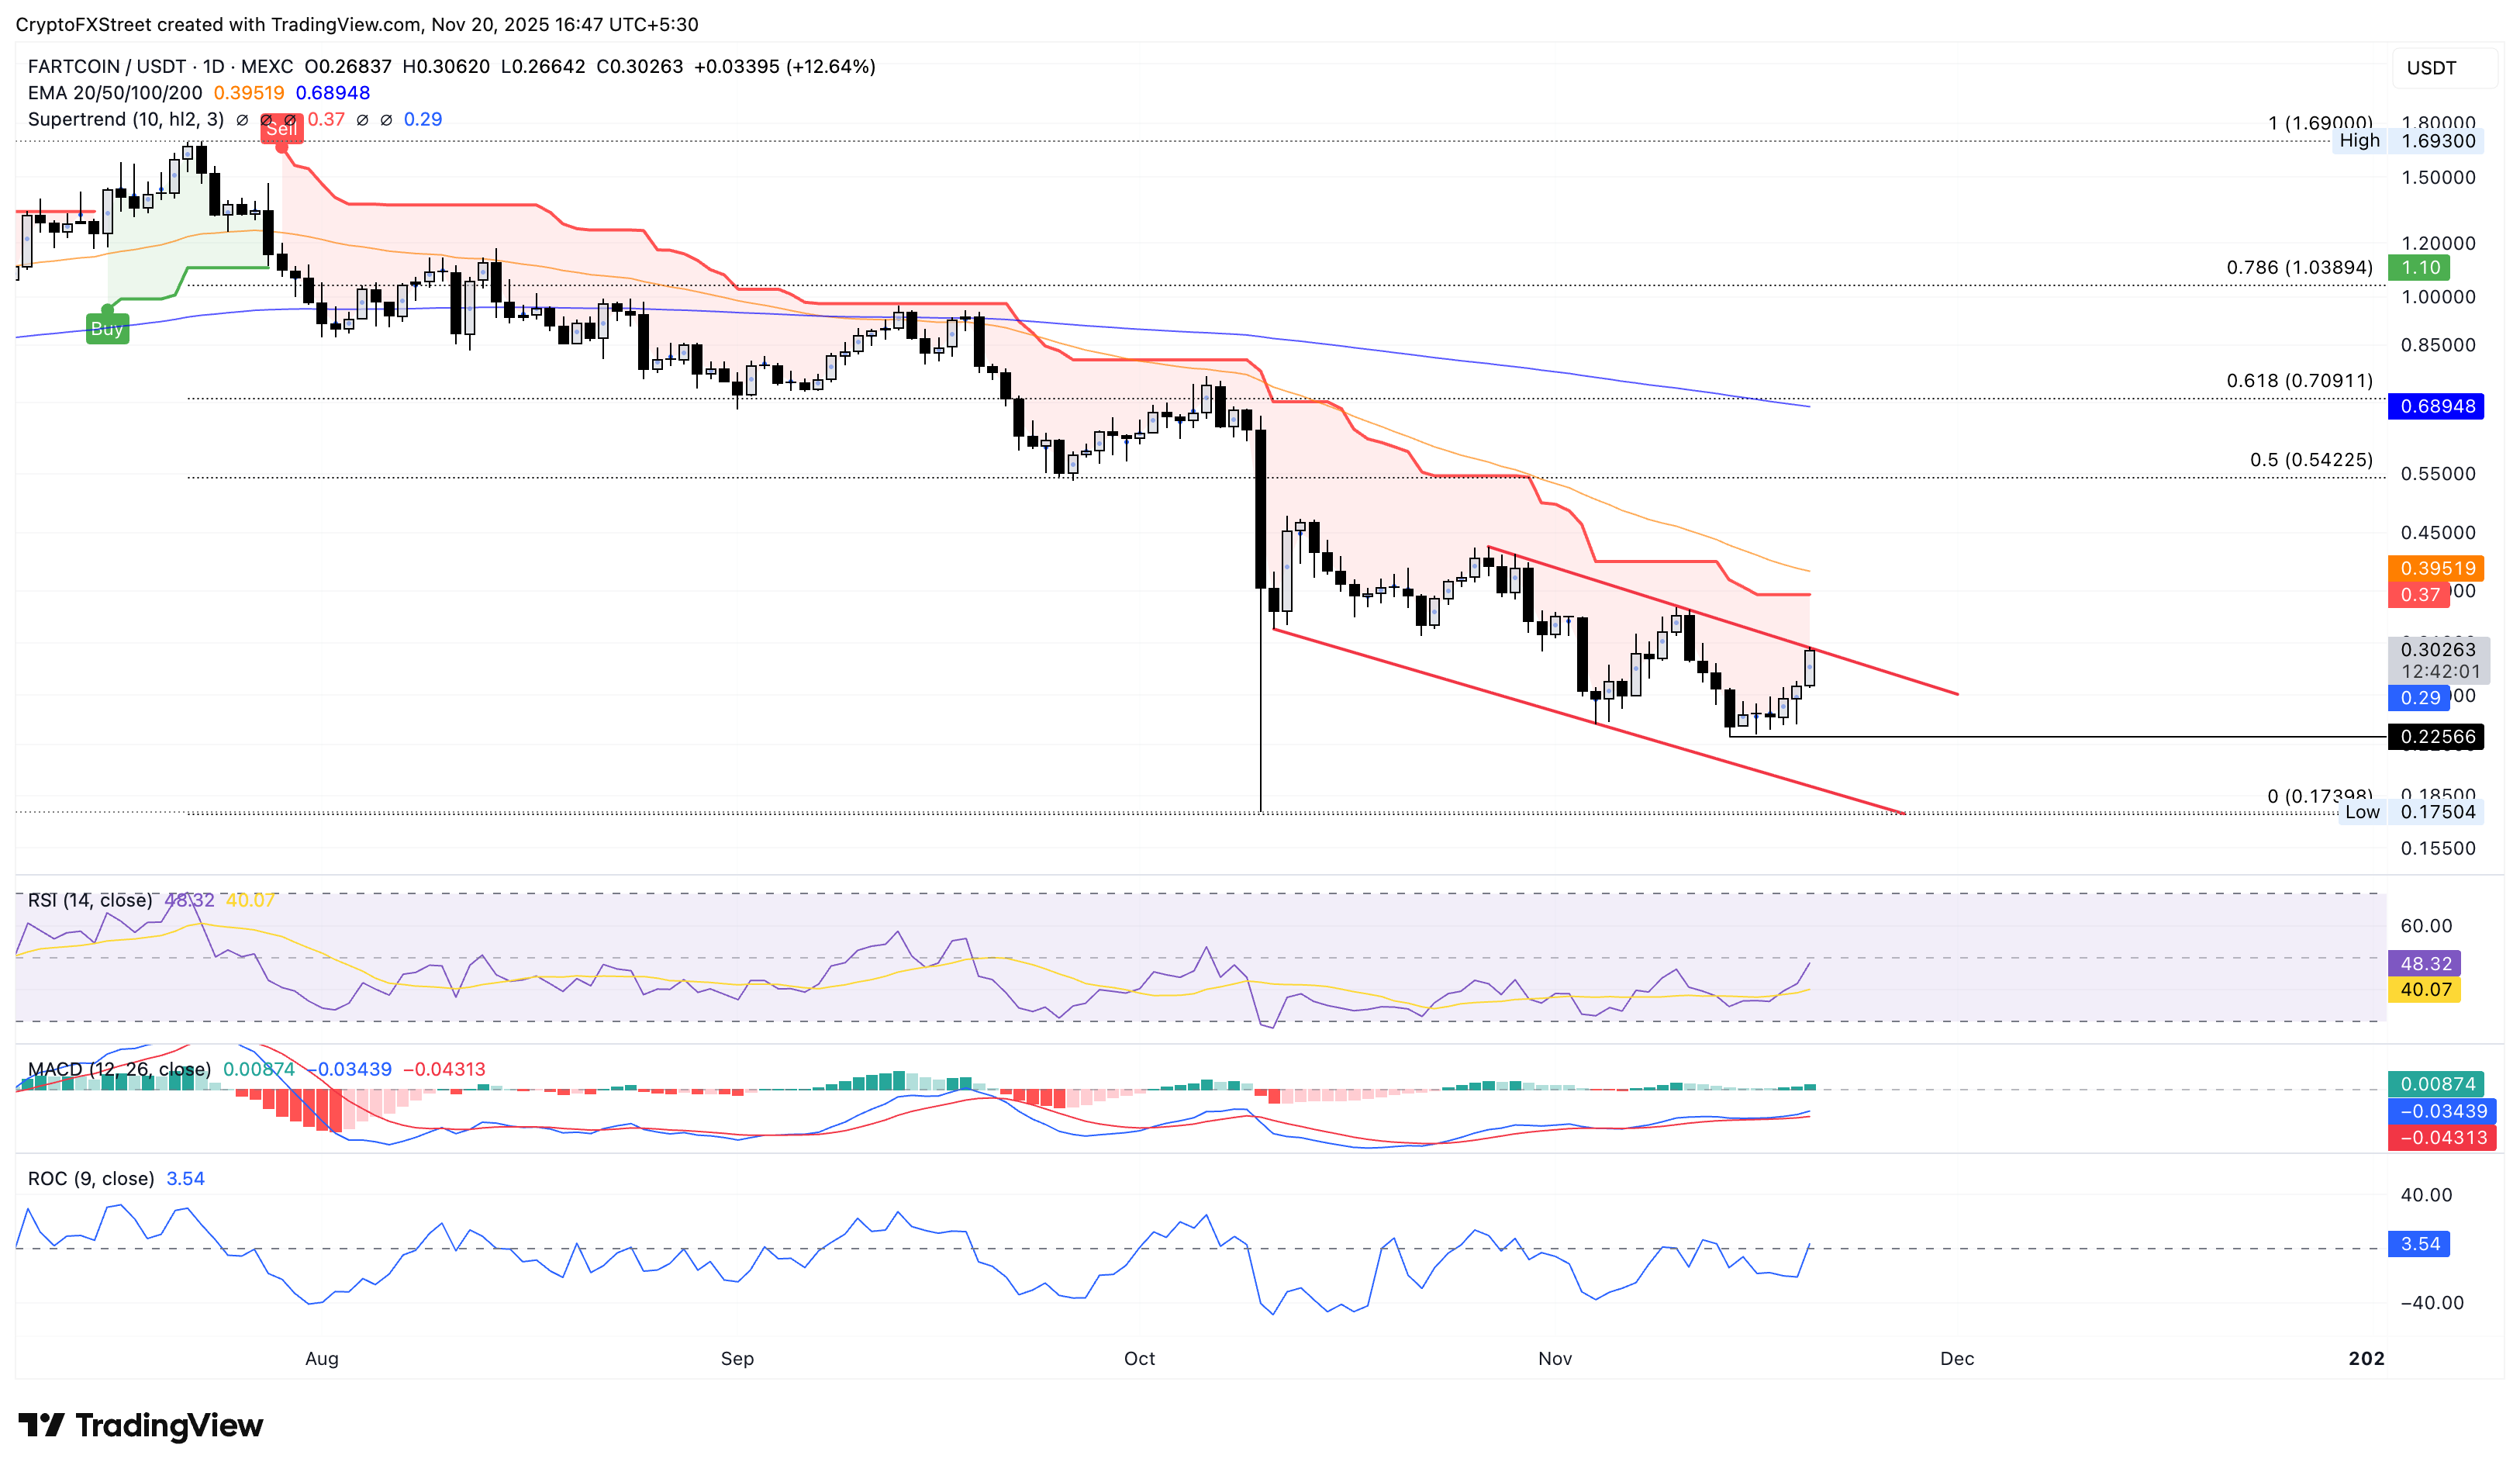
FARTCOIN/USDT daily logarithmic chart.

If FARTCOIN fails to sustain bullish momentum, it could revert within the falling channel, potentially threatening the $0.22 low from Friday. 

Disclaimer: For information purposes only. Past performance is not indicative of future results.
placeholder
Stock Futures Rally After Nvidia Smashes Earnings, With Jobs Data LoomingU.S. stock futures moved sharply higher Wednesday evening, fueled by a blowout earnings report from Nvidia that reignited investor enthusiasm for the AI trade and temporarily eased concerns over a tech bubble.
Author  Mitrade
9 hours ago
U.S. stock futures moved sharply higher Wednesday evening, fueled by a blowout earnings report from Nvidia that reignited investor enthusiasm for the AI trade and temporarily eased concerns over a tech bubble.
placeholder
Nvidia's Earnings Surge Sparks Asian Market Rally and U.S. Dollar GainsNvidia's impressive earnings, fueled by robust AI chip demand, lifted Asian stocks and boosted the U.S. dollar as investors anticipate delayed jobs data impacting Federal Reserve policy decisions.
Author  Mitrade
14 hours ago
Nvidia's impressive earnings, fueled by robust AI chip demand, lifted Asian stocks and boosted the U.S. dollar as investors anticipate delayed jobs data impacting Federal Reserve policy decisions.
placeholder
Oil Slides as U.S. Inventory Build Fuels Global Glut ConcernsOil prices edged lower during early Asian trading on Wednesday, as another rise in U.S. crude inventories intensified worries that global supply is outstripping demand.
Author  Mitrade
Yesterday 05: 56
Oil prices edged lower during early Asian trading on Wednesday, as another rise in U.S. crude inventories intensified worries that global supply is outstripping demand.
placeholder
Gold Gains as Wall Street Falls; Investor Caution Grows Ahead of Nvidia Earnings As Wall Street faces significant declines, gold prices rise amid investor caution regarding Nvidia's upcoming earnings and Home Depot's profit warning, signaling a shift in market sentiment.
Author  Mitrade
Yesterday 01: 57
As Wall Street faces significant declines, gold prices rise amid investor caution regarding Nvidia's upcoming earnings and Home Depot's profit warning, signaling a shift in market sentiment.
placeholder
Bitcoin Breaks Below $92,000 as Traders Debate Whether 4-Year Cycle Pattern Is Driving Sell-OffBitcoin (BTC-USD) extended its losses on Monday, slipping below the $92,000 mark and pushing its decline from October’s all-time high to more than 26%. The ongoing downturn has reignited a key debate among traders: Is this a short-term correction, or the start of a prolonged bear market driven by Bitcoin’s historical four-year cycle?
Author  Mitrade
Nov 18, Tue
Bitcoin (BTC-USD) extended its losses on Monday, slipping below the $92,000 mark and pushing its decline from October’s all-time high to more than 26%. The ongoing downturn has reignited a key debate among traders: Is this a short-term correction, or the start of a prolonged bear market driven by Bitcoin’s historical four-year cycle?
goTop
quote