


A June Replay? Ethereum’s 116% Rally Pattern Is Back, Yet A Big Dip Could Hit First
Ethereum price has fallen about 7% in the past 24 hours and almost 24% over the month. Traders are split between expecting a rebound or preparing for more weakness. But a key on-chain metric is showing a setup that looks almost identical to June — the same setup that triggered a 116% Ethereum rally. The catch is that a deeper drop came first.
The question now is whether the same thing is happening again.
A June-Like Reset Is Taking Shape
To understand this structure, we need to look at NUPL, the Net Unrealized Profit/Loss metric. It measures how much profit or loss holders are sitting on without selling. When NUPL drops sharply, it shows the market is clearing out weak hands and resetting before a larger trend shift.
That reset pattern played out very clearly in June.
Here is the sequence:
- On June 5, NUPL sat near 0.24. Many thought this was the bottom.
- Ethereum bounced to $2,814 by June 10 — a weak relief Ethereum rally.
- But from June 10 to June 22, NUPL slid to 0.17, and ETH dropped to $2,230. That was the real bottom and a 20.7% dip from the relief rally level.
- From that point, ETH rallied 116%, rising from $2,230 to $4,829 over two months.
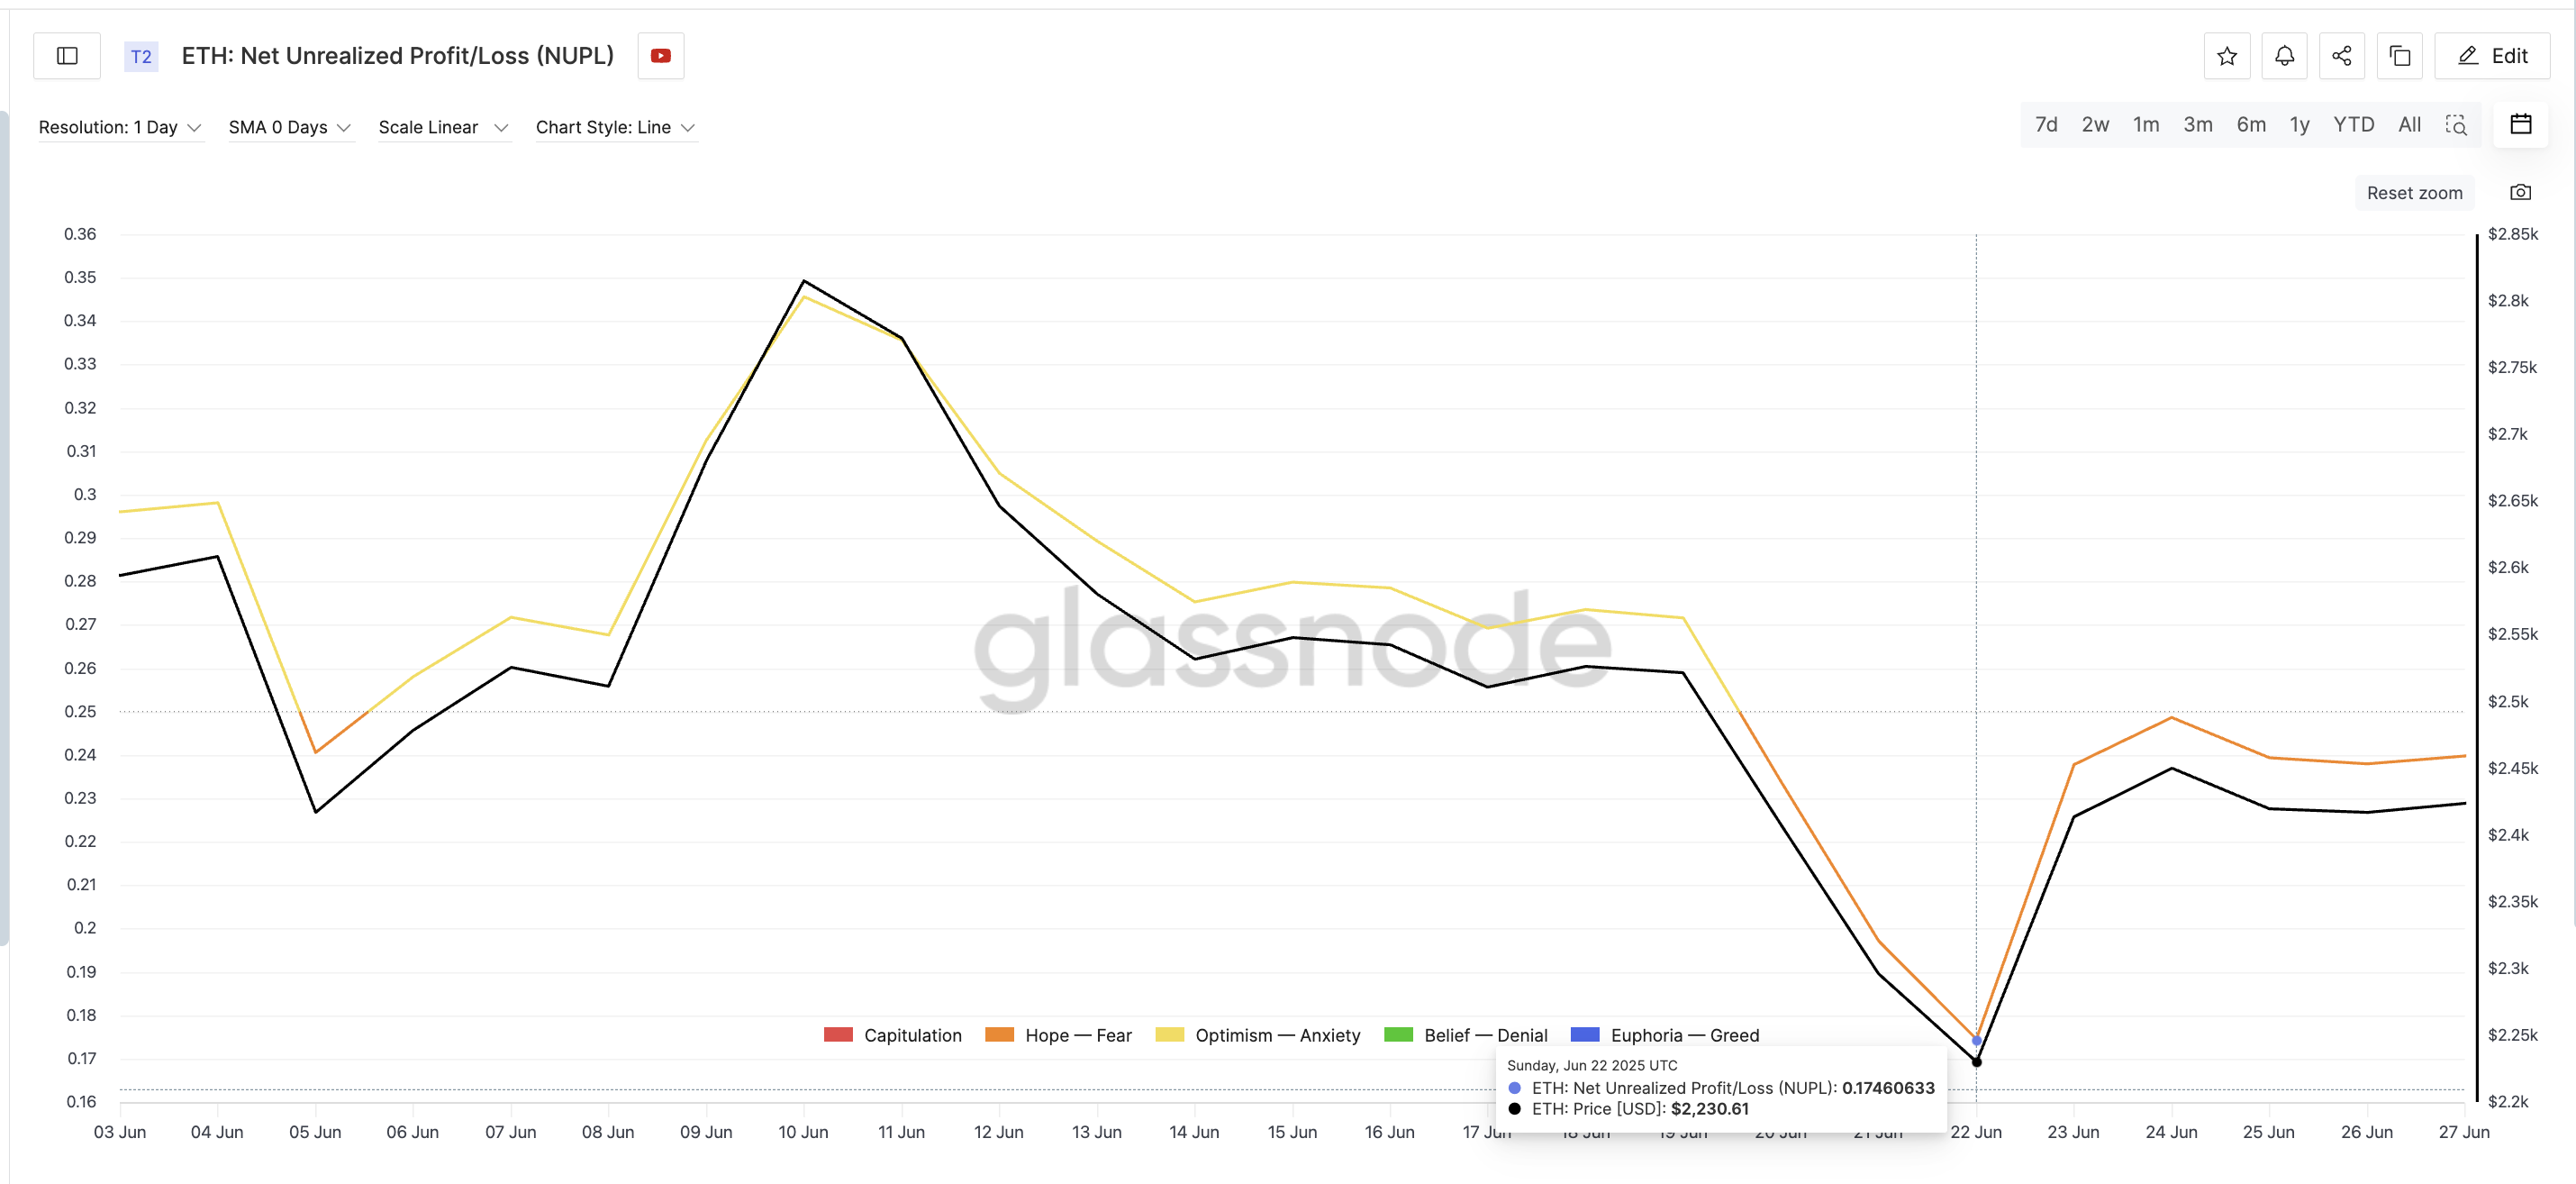 June NUPL Reset And Ethereum Price: Glassnode
Want more token insights like this? Sign up for Editor Harsh Notariya’s Daily Crypto Newsletter here.
The current structure follows the same steps.
On November 14, NUPL was again near 0.24, the same region as on June 5. ETH bounced to $3,115, but the move lacked strength — exactly like the June 10 bounce.
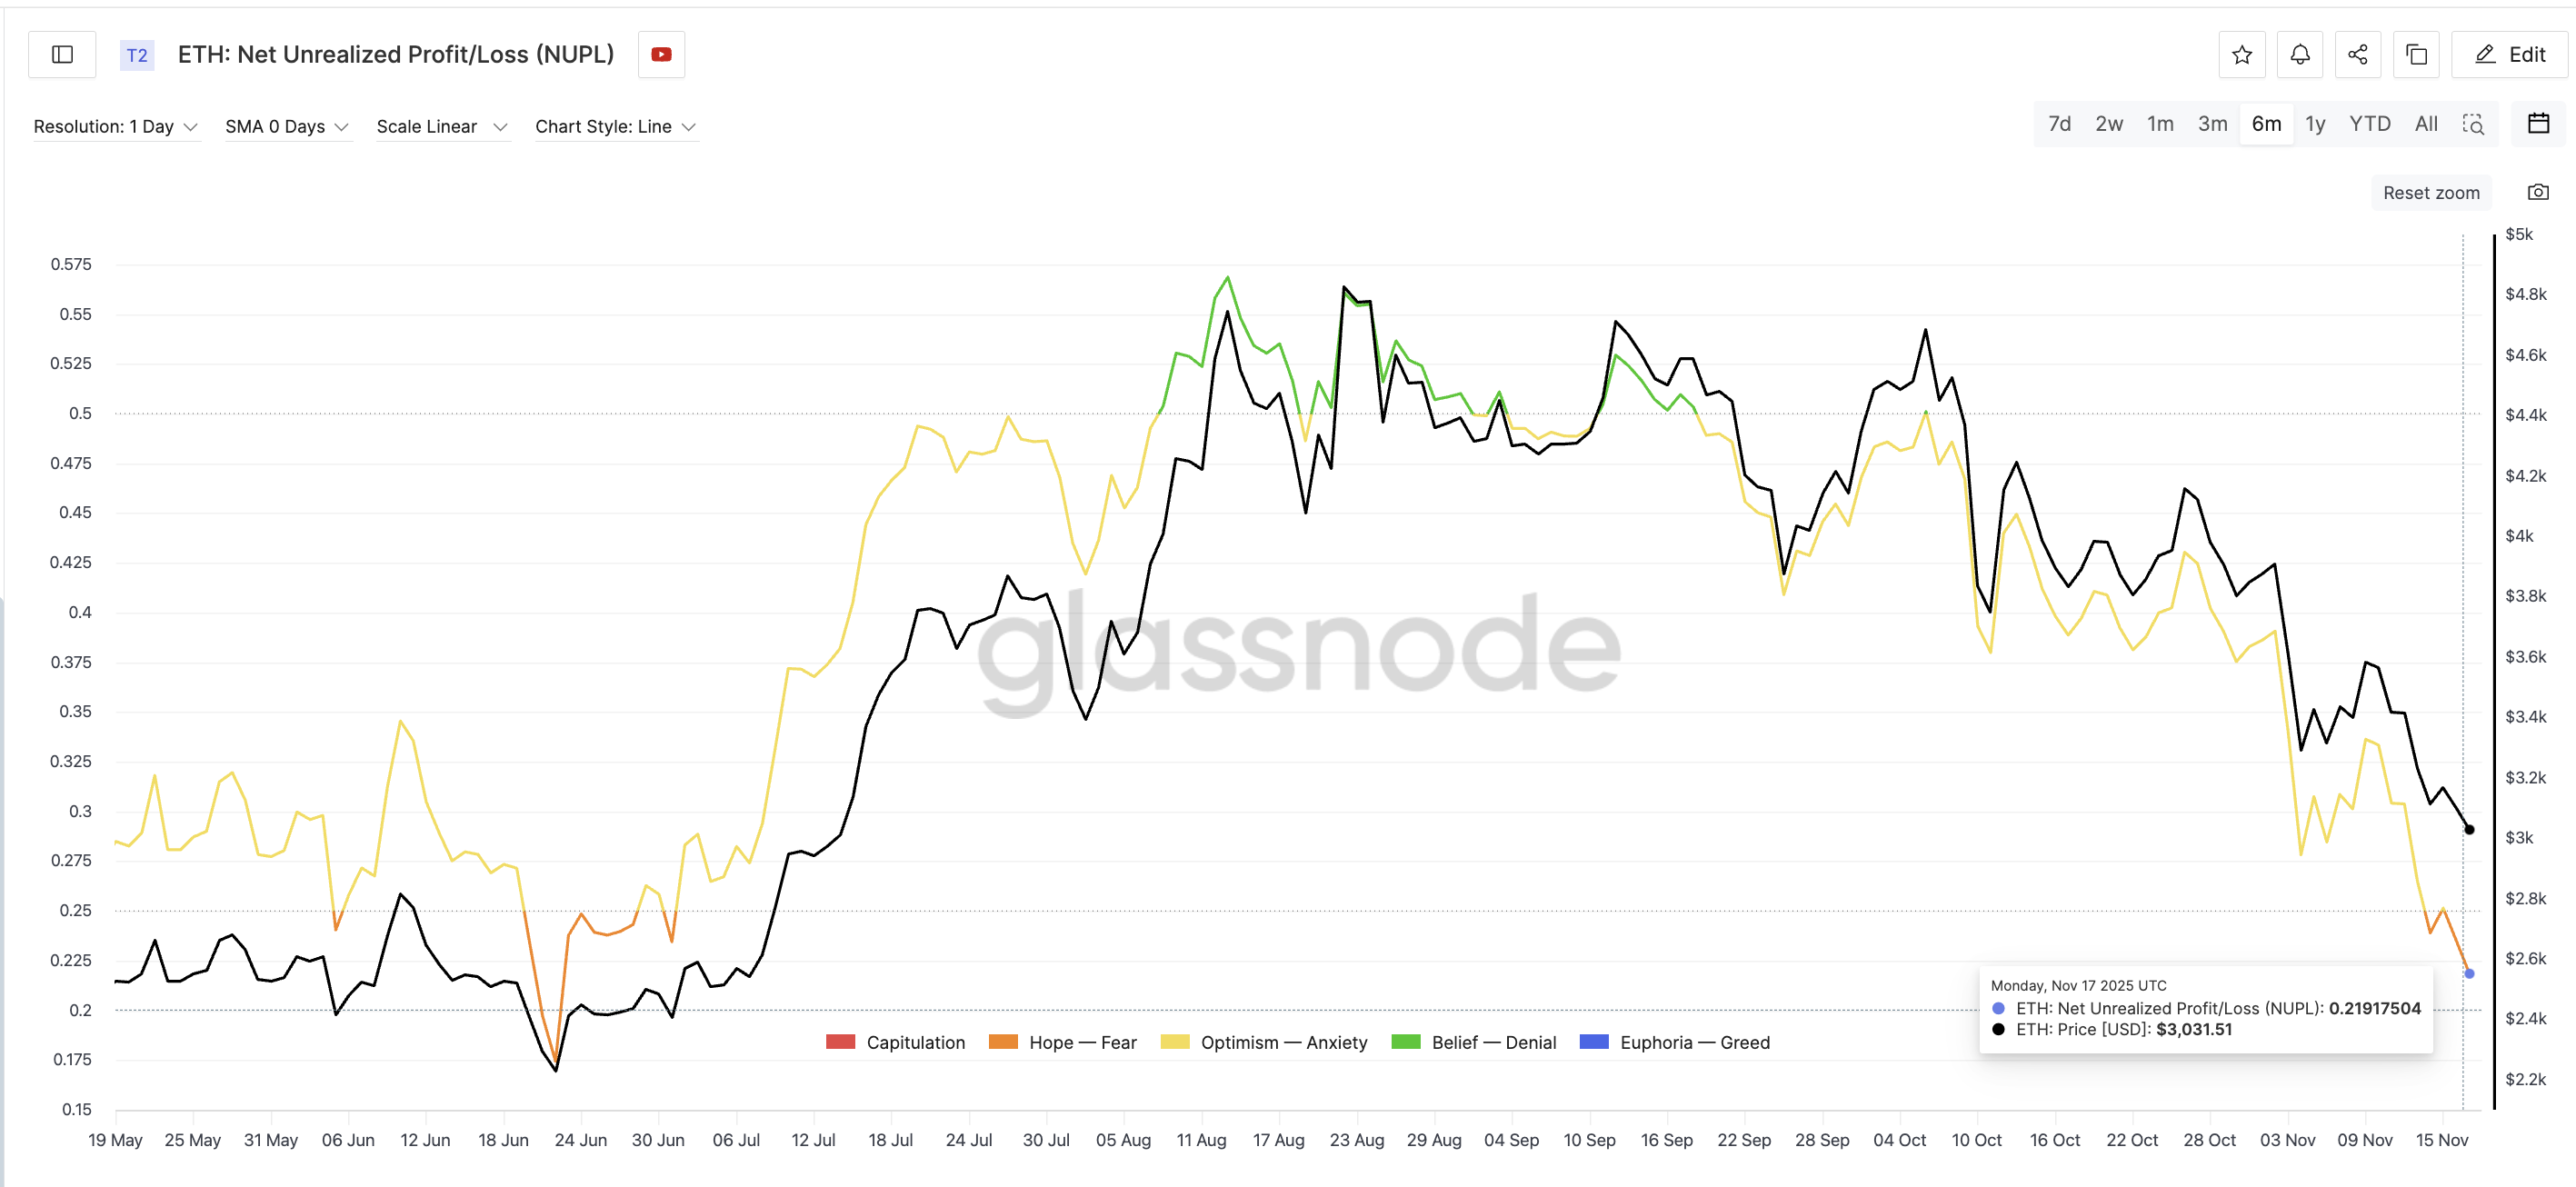 Profit Taking Incentive Needs To Be Lower For Next Ethereum Rally: Glassnode
After that, selling returned, and ETH is now trading lower. If NUPL follows the June path and drops to the same reset zone near 0.17, the price projection lands near $2,470, per the 20.7% correction pathway mentioned earlier. Do note that the NUPL has already hit the 0.21 levels as of November 16, heading down aggressively.
Exchange Activity Hints At Ongoing Weakness
Exchange behavior supports this reset idea, too. The exchange net position change metric shows how much ETH is moving in or out of exchanges. On November 6, outflows were around 1.14 million ETH. By November 17, that number had collapsed to 574,000 ETH, a 50% reduction.
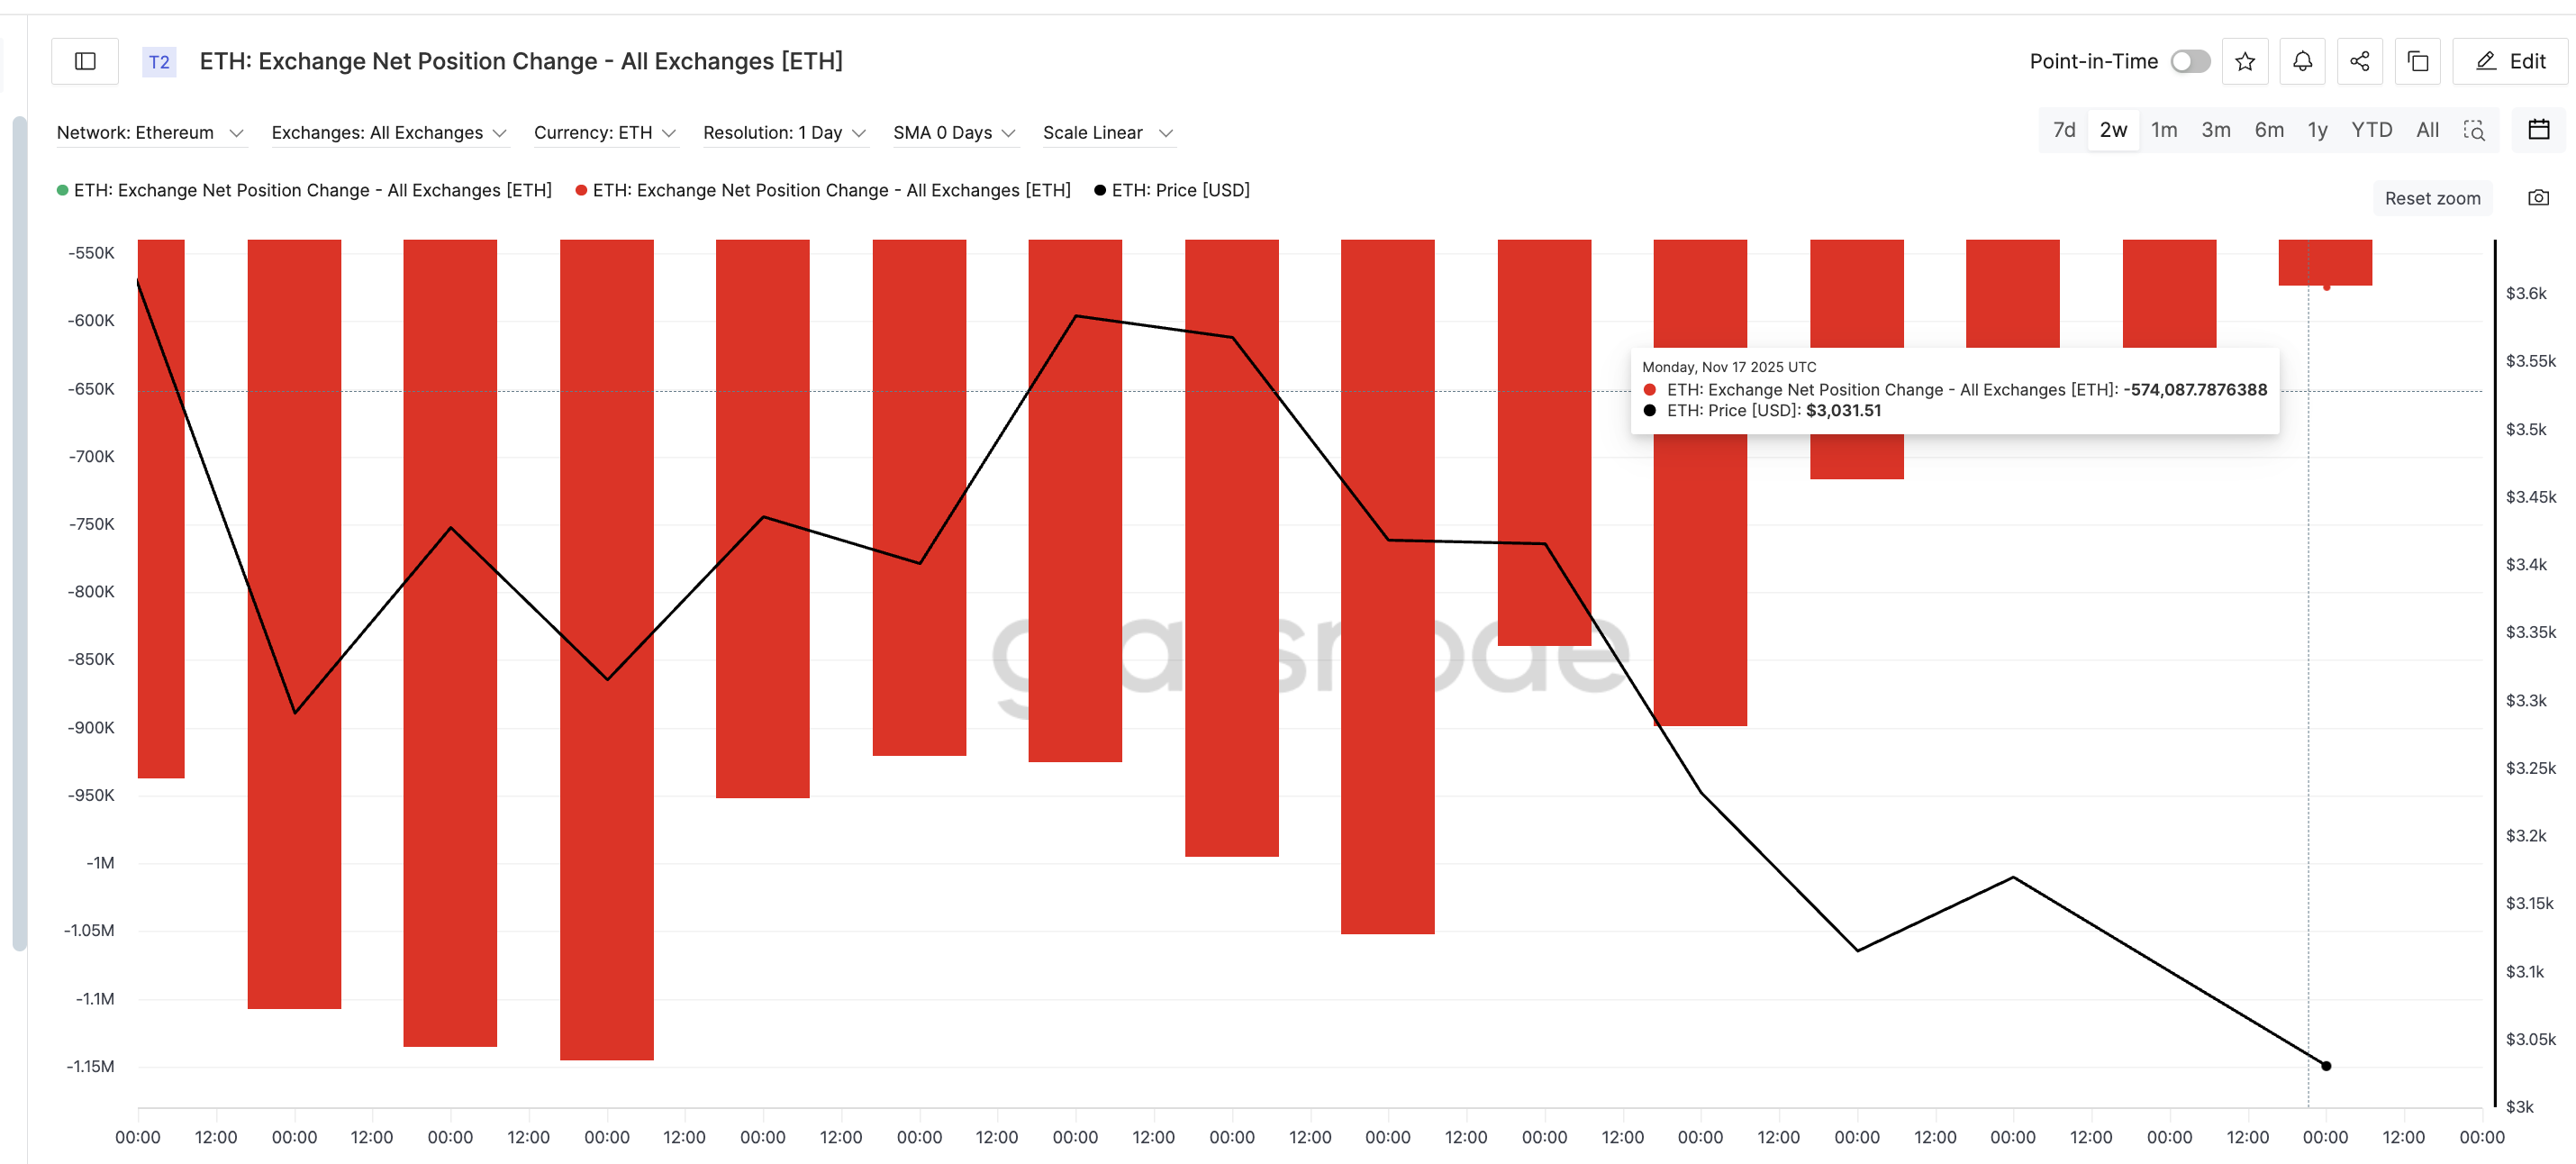 Exchange Outflows Slowing Down: Glassnode
When outflows shrink this fast, it usually means holders are selling.
Together, the NUPL pattern and exchange activity point to one idea: Ethereum may need a deeper cleanout before a strong recovery can begin.
Key Ethereum Price Chart Levels Align With The Same Target
Ethereum is still moving inside a downward channel that started in early October. The broader structure remains bearish, and ETH price action now sits close to the next critical support.
The first important level is $2,920. Losing this level on a daily close confirms that momentum remains with sellers. If that breaks, the next key zone sits directly at $2,466 — the same level projected by the NUPL reset calculation. That would be a sizable 17% dip from the current levels.
This is the part that stands out:
- The June reset model points to roughly $2,470.
- The current chart structure points to $2,466.
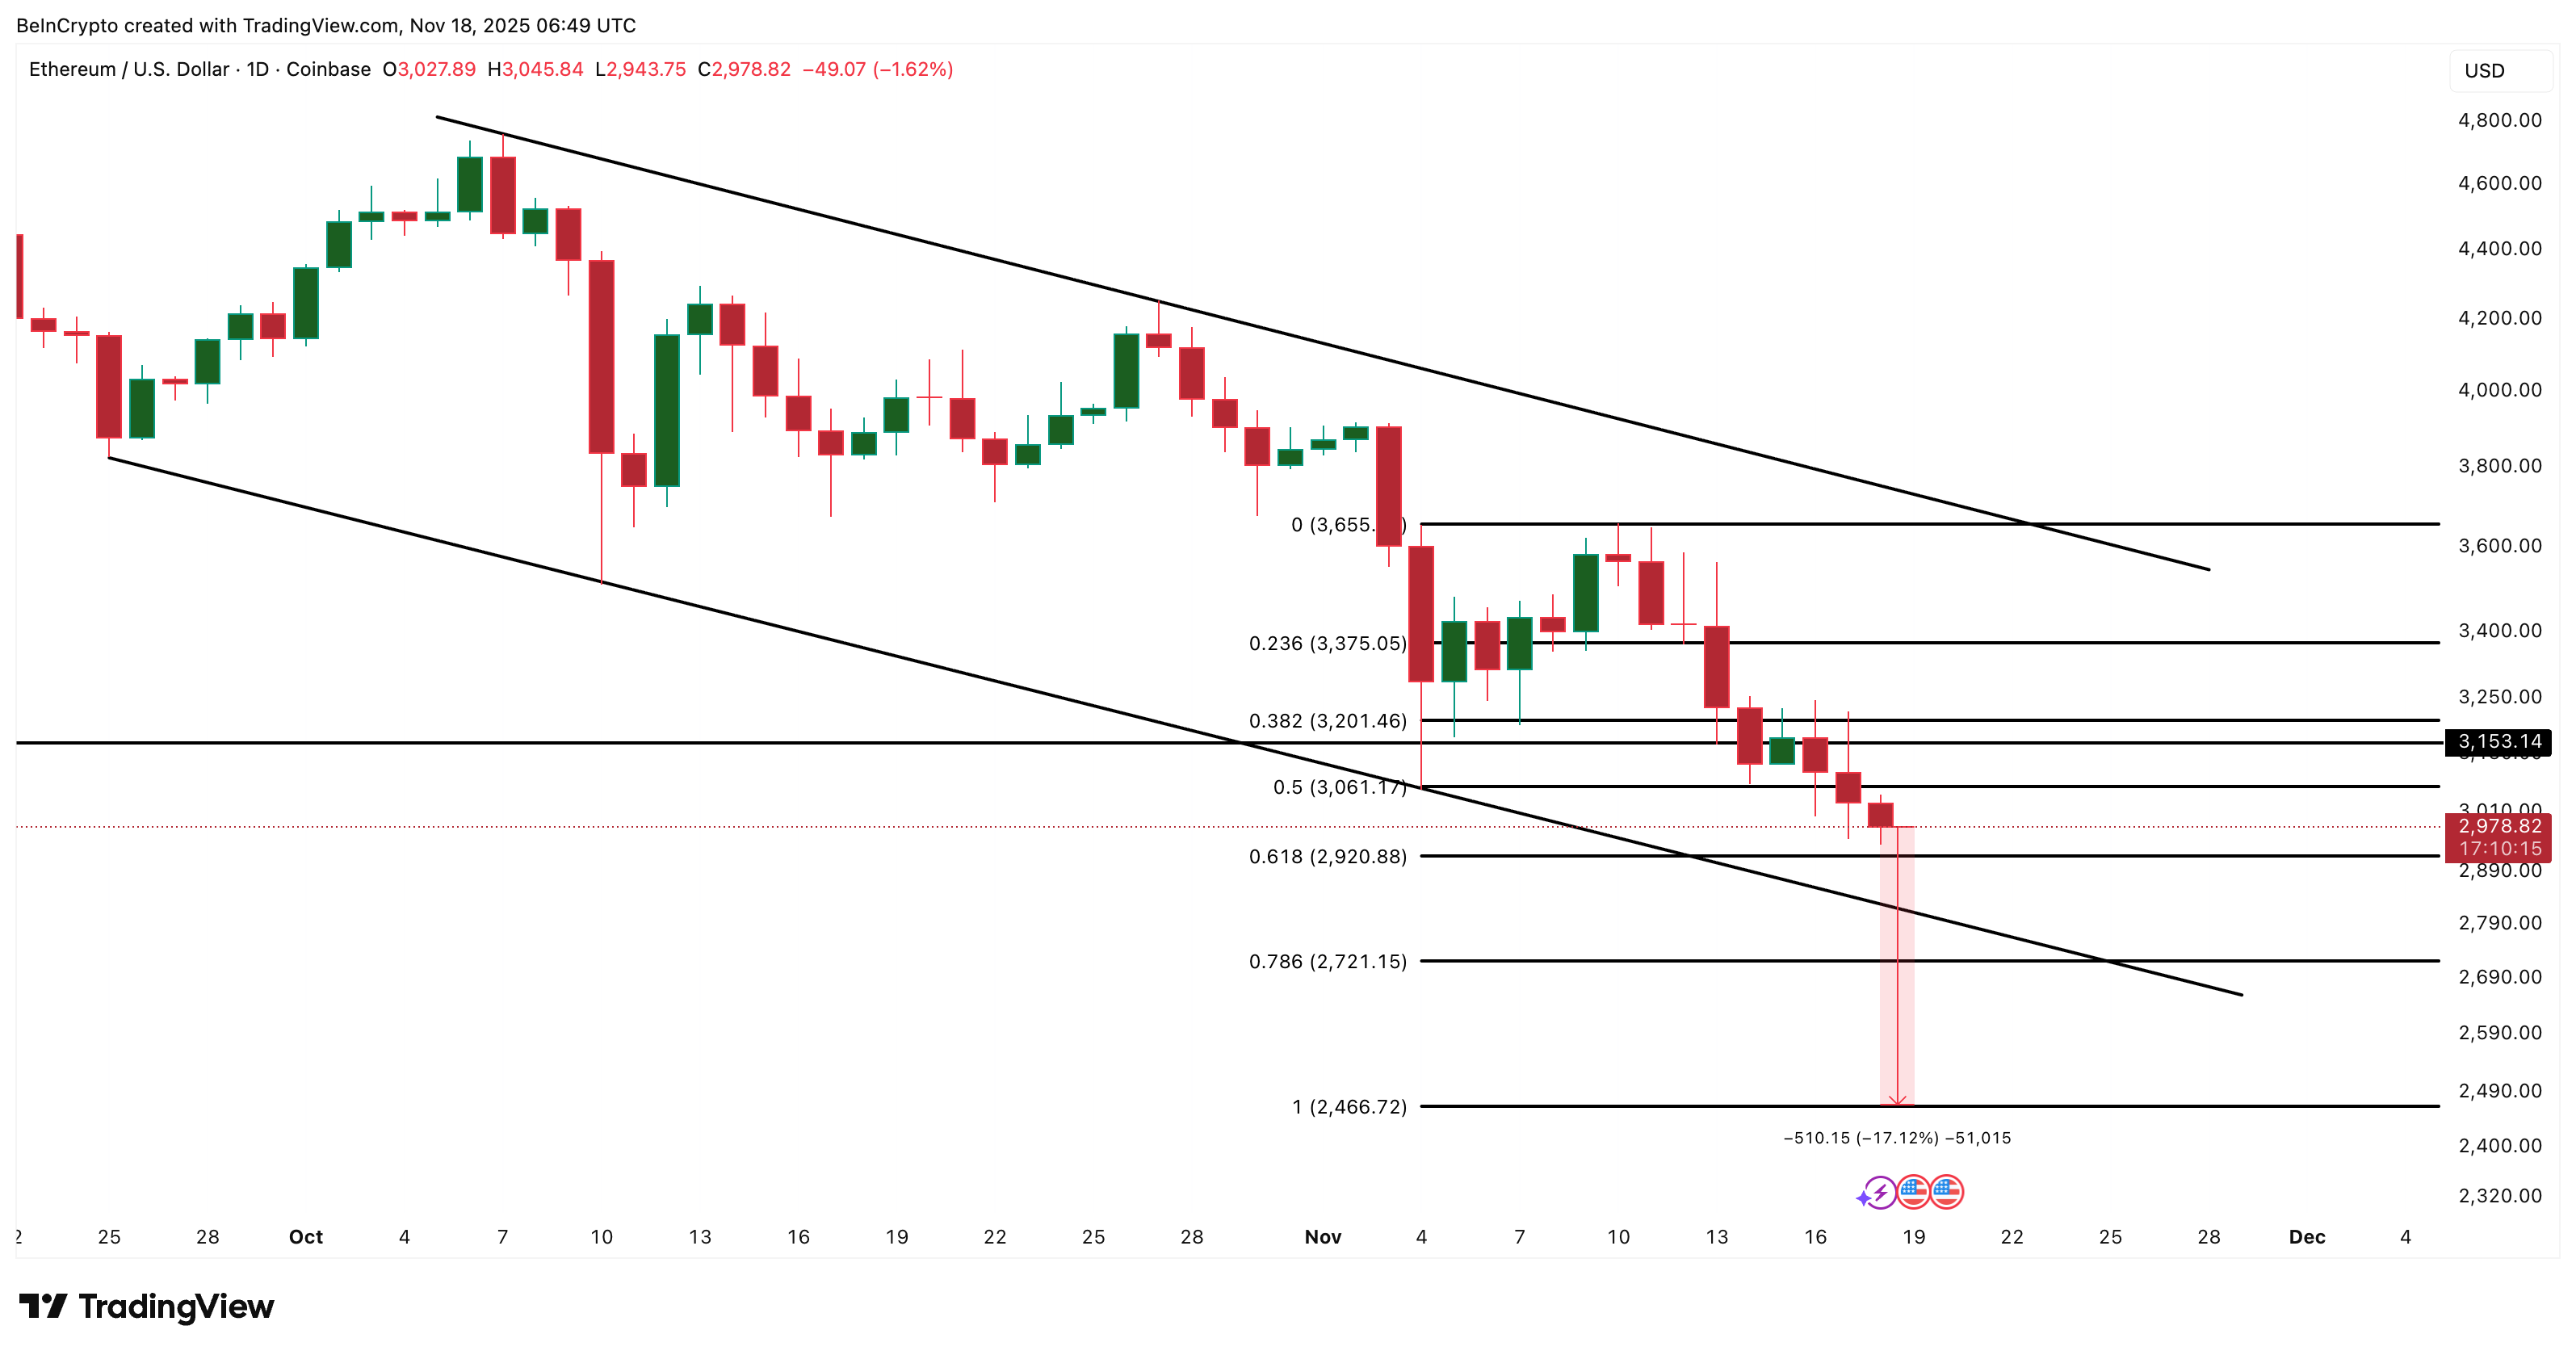 Ethereum Price Analysis: TradingView
When two separate systems land in the same zone, traders might want pay attention.
A bounce from $2,466 would not be surprising. A sustained Ethereum rally from this zone would be even less surprising, given what happened after June 22. But until Ethereum price reclaims higher levels, this remains the most logical downside test.
If ETH holds $2,920 and rebounds, the picture can improve. But right now the structure still leans toward one final flush before a meaningful reversal. Reclaiming $3,655 in the short term would invalidate this bottoming theory for now. But then, it could only be a relief bounce seen after June 5.
Recommended Articles


