
Gold Price Forecast: XAU/USD wobbles around 20-day EMA ahead of US PPI data
- Gold price trades sideways around $3,335 as investors await the US PPI data for June.
- Price of goods imported by the US have increased due to tariffs imposed by President Trump.
- Traders pare Fed dovish bets on signs of price pressures accelerating due to Trump’s tariffs.
Gold price (XAU/USD) trades in a tight range around $3,335 during European trading hours on Wednesday. The precious metal consolidates as investors await the United States (US) Producer Price Index (PPI) data for June, which will be published at 12:30 GMT.
Investors will closely monitor the US PPI data for June as it will indicate how much producers change prices of goods and services at factory gates to offset the impact of tariffs imposed by President Donald Trump on steel and aluminum, and automobiles and its components.
Economists expect inflation at the producer level grew moderately on year. However, month-on-month both headline and core PPI rose at a faster pace of 0.2%.
The US Consumer Price Index (CPI) report showed on Tuesday that prices of goods from import-heavy sectors rose sharply, which led traders to pare bets supporting interest rate cuts by the Federal Reserve (Fed) for the September policy meeting.
Analysts at Principal Asset Management said, “With increases in categories like household furnishings, recreation, and apparel, import levies are slowly filtering through, it would be wise for the Fed to remain on the sidelines for a few more months at least.”
Theoretically, Gold price outperforms in a high-inflation environment. However, the maintenance of interest rates at higher levels by the Fed bodes poorly for non-yielding assets, such as Gold.
Meanwhile, trade tensions between the European Union (EU) and the US continue to support the Gold price. A Bloomberg report showed on Tuesday that the trading bloc is prepared to announce proportionate countermeasures if trade talks with the US fails to materialize.
Gold technical analysis
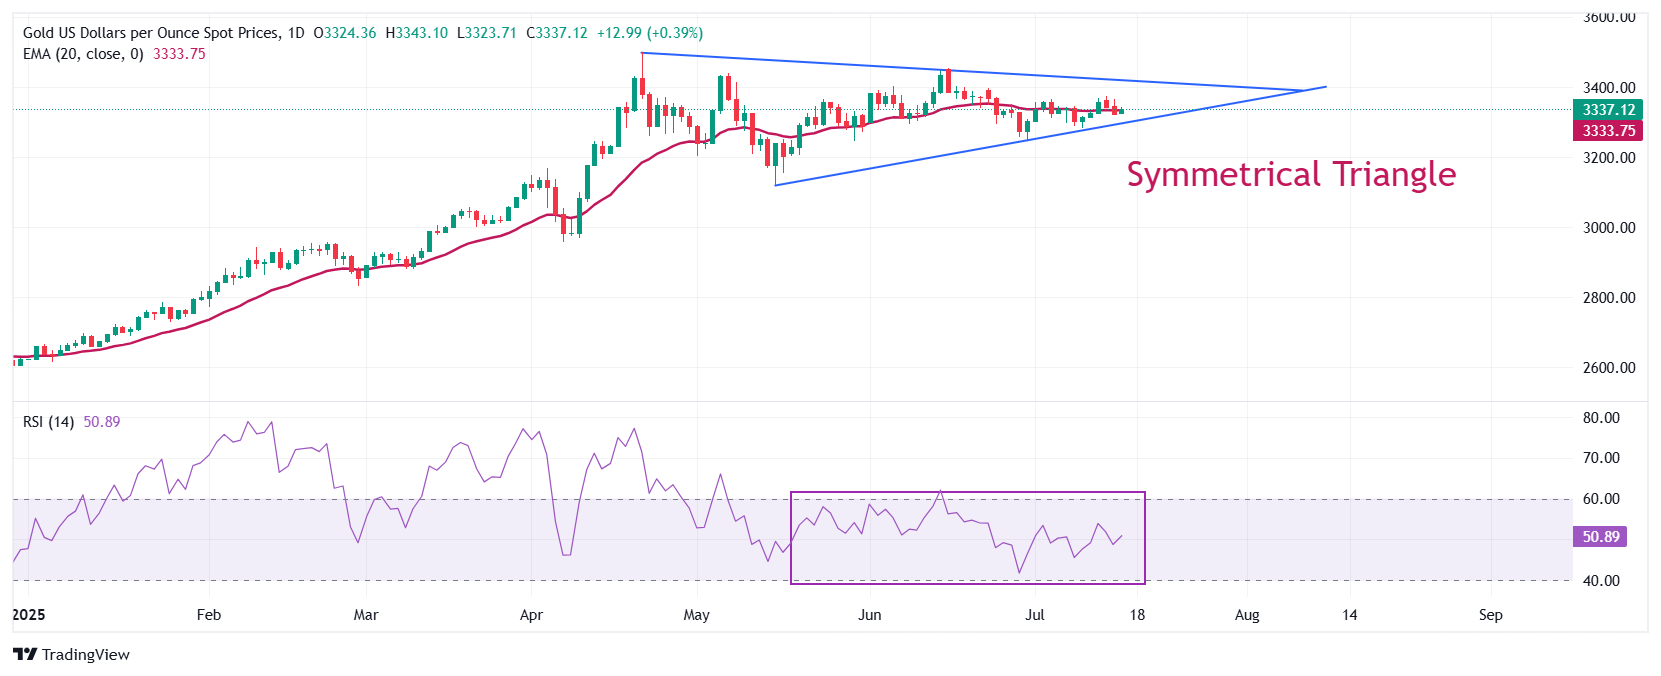
Gold price trades in a Symmetrical Triangle formation on a daily timeframe, which indicates a volatility contraction. The upward-sloping trendline of the above-mentioned chart pattern is placed from the May 15 low of $3,120.83, while its downward-sloping border is plotted from the April 22 high around $3,500
The preciou metal trades close to the 20-day Exponential Moving Average (EMA) around $3,333, indicating a sideways trend.
The 14-day Relative Strength Index (RSI) oscillates inside the 40.00-60.00 range, suggesting indecisiveness among market participants.
Looking up, the Gold price will enter in an unchartered territory if it breaks above the psychological level of $3,500 decisively. Potential resistances would be $3,550 and $3,600.
Alternatively, the Gold price would fall towards the round-level support of $3,200 and the May 15 low at $3,121, if it breaks below the May 29 low of $3,245
Gold daily chart
Gold FAQs
Gold has played a key role in human’s history as it has been widely used as a store of value and medium of exchange. Currently, apart from its shine and usage for jewelry, the precious metal is widely seen as a safe-haven asset, meaning that it is considered a good investment during turbulent times. Gold is also widely seen as a hedge against inflation and against depreciating currencies as it doesn’t rely on any specific issuer or government.
Central banks are the biggest Gold holders. In their aim to support their currencies in turbulent times, central banks tend to diversify their reserves and buy Gold to improve the perceived strength of the economy and the currency. High Gold reserves can be a source of trust for a country’s solvency. Central banks added 1,136 tonnes of Gold worth around $70 billion to their reserves in 2022, according to data from the World Gold Council. This is the highest yearly purchase since records began. Central banks from emerging economies such as China, India and Turkey are quickly increasing their Gold reserves.
Gold has an inverse correlation with the US Dollar and US Treasuries, which are both major reserve and safe-haven assets. When the Dollar depreciates, Gold tends to rise, enabling investors and central banks to diversify their assets in turbulent times. Gold is also inversely correlated with risk assets. A rally in the stock market tends to weaken Gold price, while sell-offs in riskier markets tend to favor the precious metal.
The price can move due to a wide range of factors. Geopolitical instability or fears of a deep recession can quickly make Gold price escalate due to its safe-haven status. As a yield-less asset, Gold tends to rise with lower interest rates, while higher cost of money usually weighs down on the yellow metal. Still, most moves depend on how the US Dollar (USD) behaves as the asset is priced in dollars (XAU/USD). A strong Dollar tends to keep the price of Gold controlled, whereas a weaker Dollar is likely to push Gold prices up.
Recommended Articles


