
Gold Price Forecast: XAU/USD slumps to near $3,300, 50-day EMA acts as key support
- Gold price falls sharply to near $3,300 as the US Dollar performs strongly across the board.
- The US Dollar trades firmly ahead of US tariff deadline on July 9.
- Traders pare Fed dovish bets on better-than-projected US NFP data for June.
Gold price (XAG/USD) is down almost 0.8% to near $3,300 during the European trading session on Monday. The yellow metal faces a sharp selling pressure as risk-off market sentiment has increased safe-haven demand of the US Dollar (USD).
Technically, higher US Dollar makes the Gold price an expensive bet for investors. The US Dollar Index (DXY), which tracks the Greenback’s value against six major currencies, revisits the weekly high around 97.45.
US Dollar PRICE Today
The table below shows the percentage change of US Dollar (USD) against listed major currencies today. US Dollar was the strongest against the New Zealand Dollar.
| USD | EUR | GBP | JPY | CAD | AUD | NZD | CHF | |
|---|---|---|---|---|---|---|---|---|
| USD | 0.49% | 0.42% | 0.93% | 0.53% | 0.98% | 1.08% | 0.50% | |
| EUR | -0.49% | -0.05% | 0.20% | 0.01% | 0.56% | 0.58% | 0.00% | |
| GBP | -0.42% | 0.05% | 0.24% | 0.09% | 0.62% | 0.64% | -0.07% | |
| JPY | -0.93% | -0.20% | -0.24% | -0.17% | 0.27% | 0.37% | -0.36% | |
| CAD | -0.53% | -0.01% | -0.09% | 0.17% | 0.47% | 0.55% | -0.16% | |
| AUD | -0.98% | -0.56% | -0.62% | -0.27% | -0.47% | 0.12% | -0.68% | |
| NZD | -1.08% | -0.58% | -0.64% | -0.37% | -0.55% | -0.12% | -0.70% | |
| CHF | -0.50% | -0.00% | 0.07% | 0.36% | 0.16% | 0.68% | 0.70% |
The heat map shows percentage changes of major currencies against each other. The base currency is picked from the left column, while the quote currency is picked from the top row. For example, if you pick the US Dollar from the left column and move along the horizontal line to the Japanese Yen, the percentage change displayed in the box will represent USD (base)/JPY (quote).
Market sentiment turns risk-averse as investors await United States (US) trade-related-headlines in the countdown to the reciprocal tariff deadline on July 9. So far, Washington has signed trade agreements with the United Kingdom (UK) and Vietnam, and a limited pact with China and has expressed confidence that it will strike deals with more trading partners soon.
Meanwhile, US President Donald Trump has announced that he will send letters to those nations, specifying tariff rates, with whom a deal has not been signed or discussed during the 30-day tariff pause.
Theoretically, the safe-haven demand of Gold should have increased too amid global economic tensions. However, the Gold price trades lower as a sharp decline in traders’ bets supporting interest rate cuts by the Federal Reserve (Fed) in the policy meeting later this month have dampened its appeal. Traders pare Fed dovish bets due to upbeat US Nonfarm Payrolls (NFP) data for June.
Higher interest rates by the Fed bodes poorly for non-yielding assets, such as Gold.
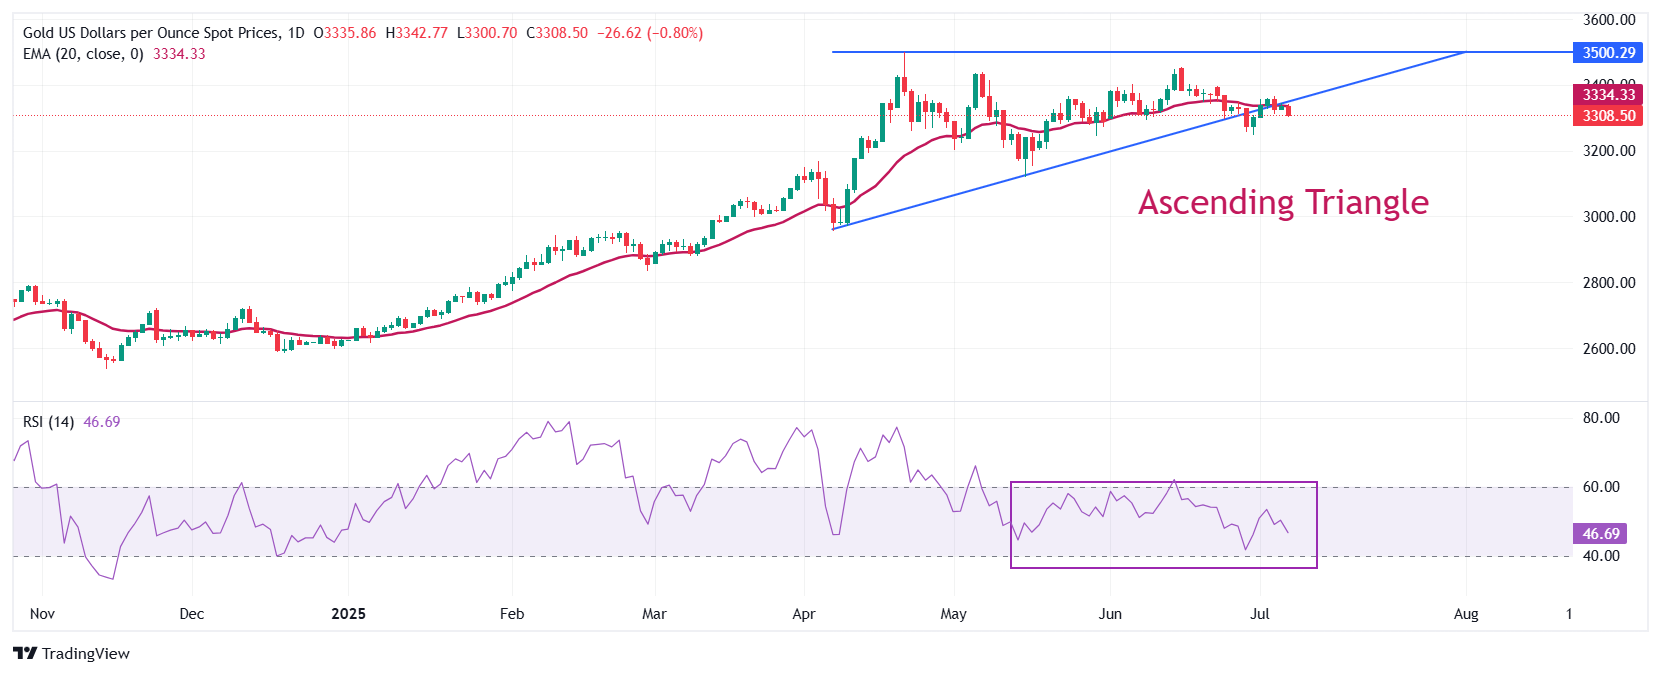
Gold technical analysis
Gold price trades close to the upward-sloping trendline of an Ascending Triangle formation on a daily timeframe, which is placed from the April 7 low of $2,957. The horizontal resistance of the above-mentioned chart pattern is plotted from the April 22 high around $3,500. Theoretically, a breakdown of the asset below the upward-sloping trendline results in a sharp downfall.
The precious metal trades below the 20-day Exponential Moving Average (EMA) around $3,334, suggesting that the near-term trend is uncertain.
The 14-day Relative Strength Index (RSI) oscillates inside the 40.00-60.00 range, indicating a sideways trend.
Looking up, the Gold price would enter in an unchartered territory after breaking above the psychological level of $3,500 decisively. Potential resistances would be $3,550 and $3,600.
Alternatively, a downside move by the Gold price below the May 29 low of $3,245 would drag it towards the round-level support of $3,200, followed by the May 15 low at $3,121.
Gold daily chart
Gold FAQs
Gold has played a key role in human’s history as it has been widely used as a store of value and medium of exchange. Currently, apart from its shine and usage for jewelry, the precious metal is widely seen as a safe-haven asset, meaning that it is considered a good investment during turbulent times. Gold is also widely seen as a hedge against inflation and against depreciating currencies as it doesn’t rely on any specific issuer or government.
Central banks are the biggest Gold holders. In their aim to support their currencies in turbulent times, central banks tend to diversify their reserves and buy Gold to improve the perceived strength of the economy and the currency. High Gold reserves can be a source of trust for a country’s solvency. Central banks added 1,136 tonnes of Gold worth around $70 billion to their reserves in 2022, according to data from the World Gold Council. This is the highest yearly purchase since records began. Central banks from emerging economies such as China, India and Turkey are quickly increasing their Gold reserves.
Gold has an inverse correlation with the US Dollar and US Treasuries, which are both major reserve and safe-haven assets. When the Dollar depreciates, Gold tends to rise, enabling investors and central banks to diversify their assets in turbulent times. Gold is also inversely correlated with risk assets. A rally in the stock market tends to weaken Gold price, while sell-offs in riskier markets tend to favor the precious metal.
The price can move due to a wide range of factors. Geopolitical instability or fears of a deep recession can quickly make Gold price escalate due to its safe-haven status. As a yield-less asset, Gold tends to rise with lower interest rates, while higher cost of money usually weighs down on the yellow metal. Still, most moves depend on how the US Dollar (USD) behaves as the asset is priced in dollars (XAU/USD). A strong Dollar tends to keep the price of Gold controlled, whereas a weaker Dollar is likely to push Gold prices up.
Recommended Articles


