NZD/JPY price analysis: Cross struggles to maintain upward momentum

Source Fxstreet
  • NZD/JPY trades near the 85.70 zone with minor gains on Friday.
  • The pair maintains a bearish outlook despite mixed technical signals.
  • Key support is clustered below 85.60, with resistance near 86.00.

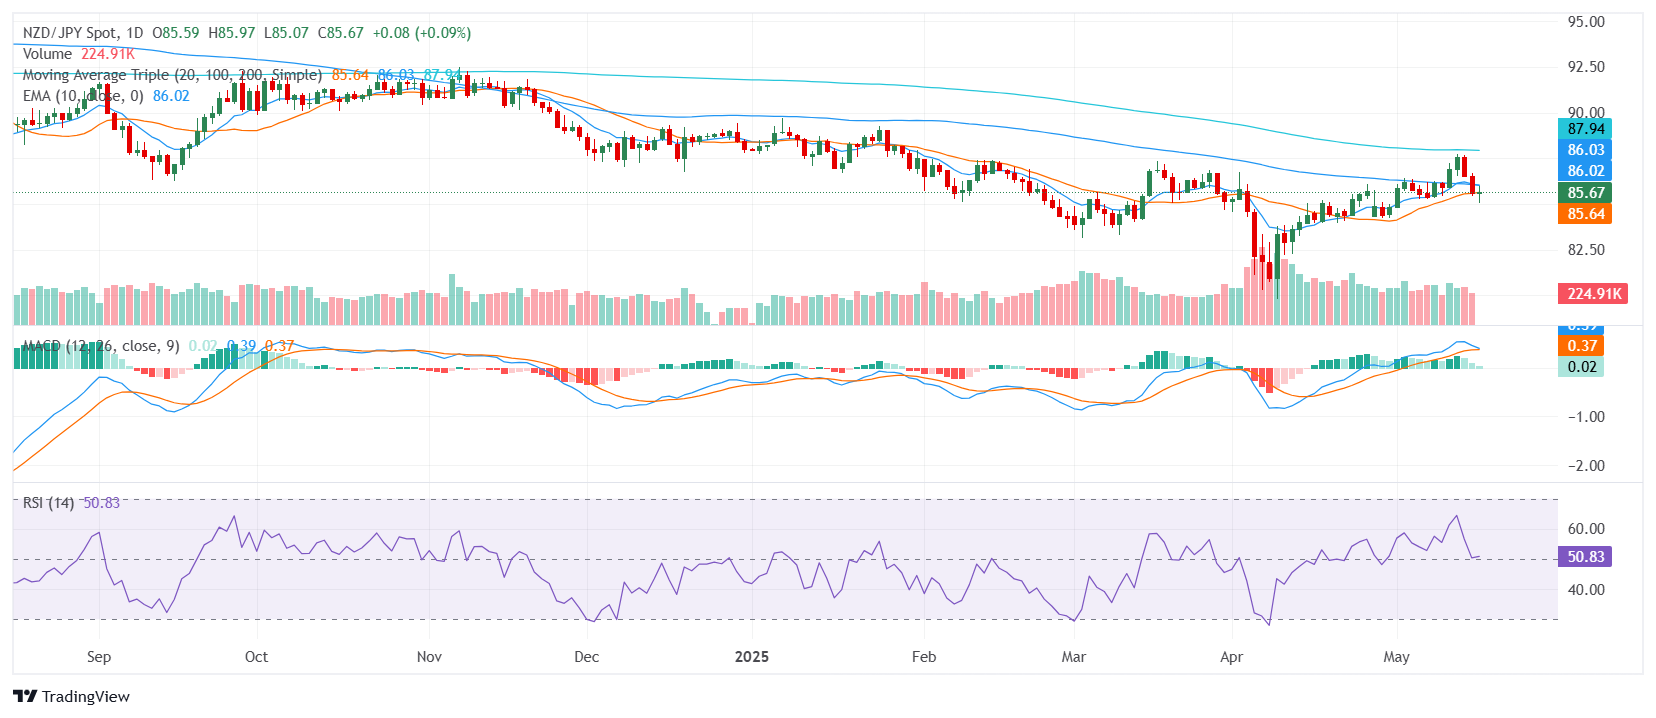
The NZD/JPY pair is attempting to hold on to modest gains as it trades near the 85.70 zone ahead of the Asian session on Friday. Despite the slight uptick, the broader technical picture remains tilted to the downside, reflecting the influence of longer-term bearish signals that have kept the pair within a tight range recently. Traders appear hesitant to push the pair significantly higher, reflecting a cautious tone as they assess the balance of technical indicators.

NZD/JPY presents a complex technical backdrop, with short-term signals offering a mixed picture. The 20-day Simple Moving Average (SMA) currently points to a buy signal, reflecting recent strength. However, this is overshadowed by the 100-day and 200-day SMAs, both indicating a bearish outlook, highlighting the broader downward pressure. The 10-day Exponential Moving Average (EMA) and 10-day SMA, also positioned in the 80s, reinforce this bearish view, aligning with the longer-term trend.

Momentum indicators provide a similarly mixed signal. The Relative Strength Index (RSI) is in the 50s, suggesting neutral momentum, while the Moving Average Convergence Divergence (MACD) signals mild buy pressure, adding a hint of bullish potential. However, the Stochastic %K (14, 3, 3) remains in the 40s, indicating a more cautious stance, while the Commodity Channel Index (20) also signals neutrality, confirming the lack of a clear directional bias. The Average Directional Index (14), positioned around 15, underscores this neutral tone, indicating a market lacking strong trend conviction.

For now, immediate support is seen around 85.64, with additional layers at 85.51 and 85.50. On the upside, resistance is likely to emerge around 85.70, followed closely by 85.77 and 86.03, potentially limiting any recovery attempts in the near term.

Daily Chart
Disclaimer: For information purposes only. Past performance is not indicative of future results.
placeholder
Gold price edges higher as USD sinks to over three-year low on Fed independence fearsGold price (XAU/USD) is trading with a mild positive bias for the second consecutive day on Thursday, albeit lacking follow-through amid mixed fundamental cues.
Author  FXStreet
14 hours ago
Gold price (XAU/USD) is trading with a mild positive bias for the second consecutive day on Thursday, albeit lacking follow-through amid mixed fundamental cues.
placeholder
Litecoin Price Forecast: LTC holders’ profit-taking activity reaches three-month highLitecoin (LTC) is stabilizing at around $85 at the time of writing on Thursday, having recovered 6% so far this week.
Author  FXStreet
14 hours ago
Litecoin (LTC) is stabilizing at around $85 at the time of writing on Thursday, having recovered 6% so far this week.
placeholder
Bitcoin Eyes $120K? Analyst Reveals What Comes After BTC’s 50-Day EMA BreakoutBitcoin has resumed its upward movement, maintaining strength above the $107,000 level as market momentum builds toward the asset’s recent all-time high above $111,000. As of this writing, BTC is
Author  NewsBTC
14 hours ago
Bitcoin has resumed its upward movement, maintaining strength above the $107,000 level as market momentum builds toward the asset’s recent all-time high above $111,000. As of this writing, BTC is
placeholder
Stellar Price Forecast: XLM derivatives data hint at double-digit rally as bullish bets surgeStellar (XLM) is hovering around $0.242 at the time of writing on Thursday, having recovered nearly 6% so far this week. The derivatives data suggest rising investor confidence as XLM’s funding rate turns positive and the bullish bets reach their highest level in over a month.
Author  FXStreet
14 hours ago
Stellar (XLM) is hovering around $0.242 at the time of writing on Thursday, having recovered nearly 6% so far this week. The derivatives data suggest rising investor confidence as XLM’s funding rate turns positive and the bullish bets reach their highest level in over a month.
placeholder
Bitcoin Cash Price Prediction: BCH targets 52-week high as on-chain data indicate room for growthBitcoin Cash (BCH) is trading in the green by 2% at press time on Thursday, following a 6.39% price surge on Wednesday. Rising in a parallel channel pattern, BCH shows signs of increasing bullish momentum and nearing the $500 psychological level.
Author  FXStreet
14 hours ago
Bitcoin Cash (BCH) is trading in the green by 2% at press time on Thursday, following a 6.39% price surge on Wednesday. Rising in a parallel channel pattern, BCH shows signs of increasing bullish momentum and nearing the $500 psychological level.
Related Instrument
goTop
quote