
AUD/USD Price Forecast: Makes an effort to hold breakout above 0.6700
- AUD/USD refreshes yearly high near 0.6740 as antipodeans outperform.
- The US Dollar falls as market sentiment turns favorable for risky assets.
- Investors await the Australian CPI and the US NFP data.
The AUD/USD pair posts a fresh yearly high at 0.6740 during the European trading session on Tuesday. The Aussie pair trades firmly as antipodeans outperform amid risk-on market sentiment. The appeal of risky assets increases as investors digest the United States (US) military action in Venezuela, which boosted safe-haven demand on Monday.
Australian Dollar Price Today
The table below shows the percentage change of Australian Dollar (AUD) against listed major currencies today. Australian Dollar was the strongest against the Swiss Franc.
| USD | EUR | GBP | JPY | CAD | AUD | NZD | CHF | |
|---|---|---|---|---|---|---|---|---|
| USD | 0.02% | -0.05% | -0.03% | 0.03% | -0.07% | -0.07% | 0.09% | |
| EUR | -0.02% | -0.07% | -0.07% | 0.01% | -0.09% | -0.10% | 0.07% | |
| GBP | 0.05% | 0.07% | 0.00% | 0.08% | -0.02% | -0.03% | 0.14% | |
| JPY | 0.03% | 0.07% | 0.00% | 0.07% | -0.03% | -0.04% | 0.13% | |
| CAD | -0.03% | -0.01% | -0.08% | -0.07% | -0.10% | -0.11% | 0.05% | |
| AUD | 0.07% | 0.09% | 0.02% | 0.03% | 0.10% | -0.00% | 0.15% | |
| NZD | 0.07% | 0.10% | 0.03% | 0.04% | 0.11% | 0.00% | 0.16% | |
| CHF | -0.09% | -0.07% | -0.14% | -0.13% | -0.05% | -0.15% | -0.16% |
The heat map shows percentage changes of major currencies against each other. The base currency is picked from the left column, while the quote currency is picked from the top row. For example, if you pick the Australian Dollar from the left column and move along the horizontal line to the US Dollar, the percentage change displayed in the box will represent AUD (base)/USD (quote).
Improving market sentiment has also weighed on the US Dollar (USD), contributing to strength in the Aussie pair. As of writing, the US Dollar Index (DXY), which tracks the Greenback’s value against six major currencies, trades slightly lower to near 98.30.
Going forward, the Australian Dollar will be influenced by the Consumer Price Index (CPI) data for November, which will be released on Wednesday. Inflation in Australia is expected to have grown at an annualized pace of 3.7%, slower than 3.8% in October. Investors will pay close attention to the Australian CPI data as the Reserve Bank of Australia (RBA) signaled in the last policy meeting that monetary conditions could tighten if inflation proves to be persistent.
Meanwhile, the US Dollar will be impacted by the United States (US) Nonfarm Payrolls (NFP) data for December, which is scheduled to be release on Friday. The US NFP data will influence market expectations for the Federal Reserve’s (Fed) monetary policy outlook.
AUD/USD technical analysis
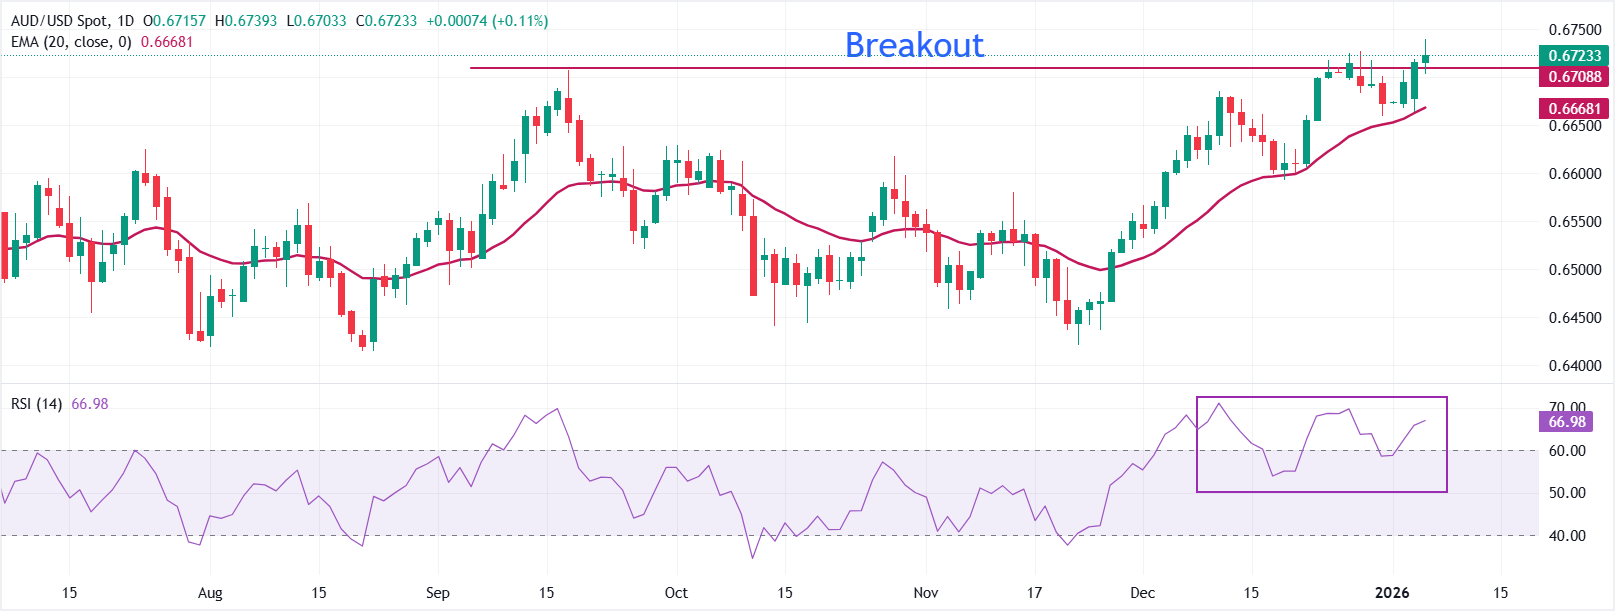
AUD/USD trades slightly higher to near 0.6723 as of writing. The pair stands above the rising 20-day Exponential Moving Average (EMA), which continues to edge higher and supports a bullish bias. Holding over this gauge keeps the upside tone intact.
The 14-day Relative Strength Index (RSI) at 66.93 sits in bullish territory and confirms improving momentum.
The ascending 20-day EMA should act as a dynamic floor on pullbacks, while a daily close below it would soften the outlook and lead to a deeper retracement toward the round-level support of 0.6600. Conversely, a sustained trade above the 20-day EMA would keep the path open for incremental gains toward the October 2024 high of 0.6935.
(The technical analysis of this story was written with the help of an AI tool.)
US Dollar FAQs
The US Dollar (USD) is the official currency of the United States of America, and the ‘de facto’ currency of a significant number of other countries where it is found in circulation alongside local notes. It is the most heavily traded currency in the world, accounting for over 88% of all global foreign exchange turnover, or an average of $6.6 trillion in transactions per day, according to data from 2022. Following the second world war, the USD took over from the British Pound as the world’s reserve currency. For most of its history, the US Dollar was backed by Gold, until the Bretton Woods Agreement in 1971 when the Gold Standard went away.
The most important single factor impacting on the value of the US Dollar is monetary policy, which is shaped by the Federal Reserve (Fed). The Fed has two mandates: to achieve price stability (control inflation) and foster full employment. Its primary tool to achieve these two goals is by adjusting interest rates. When prices are rising too quickly and inflation is above the Fed’s 2% target, the Fed will raise rates, which helps the USD value. When inflation falls below 2% or the Unemployment Rate is too high, the Fed may lower interest rates, which weighs on the Greenback.
In extreme situations, the Federal Reserve can also print more Dollars and enact quantitative easing (QE). QE is the process by which the Fed substantially increases the flow of credit in a stuck financial system. It is a non-standard policy measure used when credit has dried up because banks will not lend to each other (out of the fear of counterparty default). It is a last resort when simply lowering interest rates is unlikely to achieve the necessary result. It was the Fed’s weapon of choice to combat the credit crunch that occurred during the Great Financial Crisis in 2008. It involves the Fed printing more Dollars and using them to buy US government bonds predominantly from financial institutions. QE usually leads to a weaker US Dollar.
Quantitative tightening (QT) is the reverse process whereby the Federal Reserve stops buying bonds from financial institutions and does not reinvest the principal from the bonds it holds maturing in new purchases. It is usually positive for the US Dollar.
Recommended Articles


