


GBP/JPY Price Forecast: Hits five week high near 204.50
- GBP/JPY rises 0.33% to 204.53 as geopolitical strains weigh on the Yen and support Sterling strength.
- Bulls need a clean break above 204.50 to target 205.00, 205.32, and potentially the 206.00 handle.
- A drop below 204.00 could prompt a deeper pullback toward 202.71 and the 202.00 support region.
The GBP/JPY rallies to a five-week high of 204.53 on Monday, up by 0.33% as the Japanese Yen weakens on growing tensions between China and Japan.
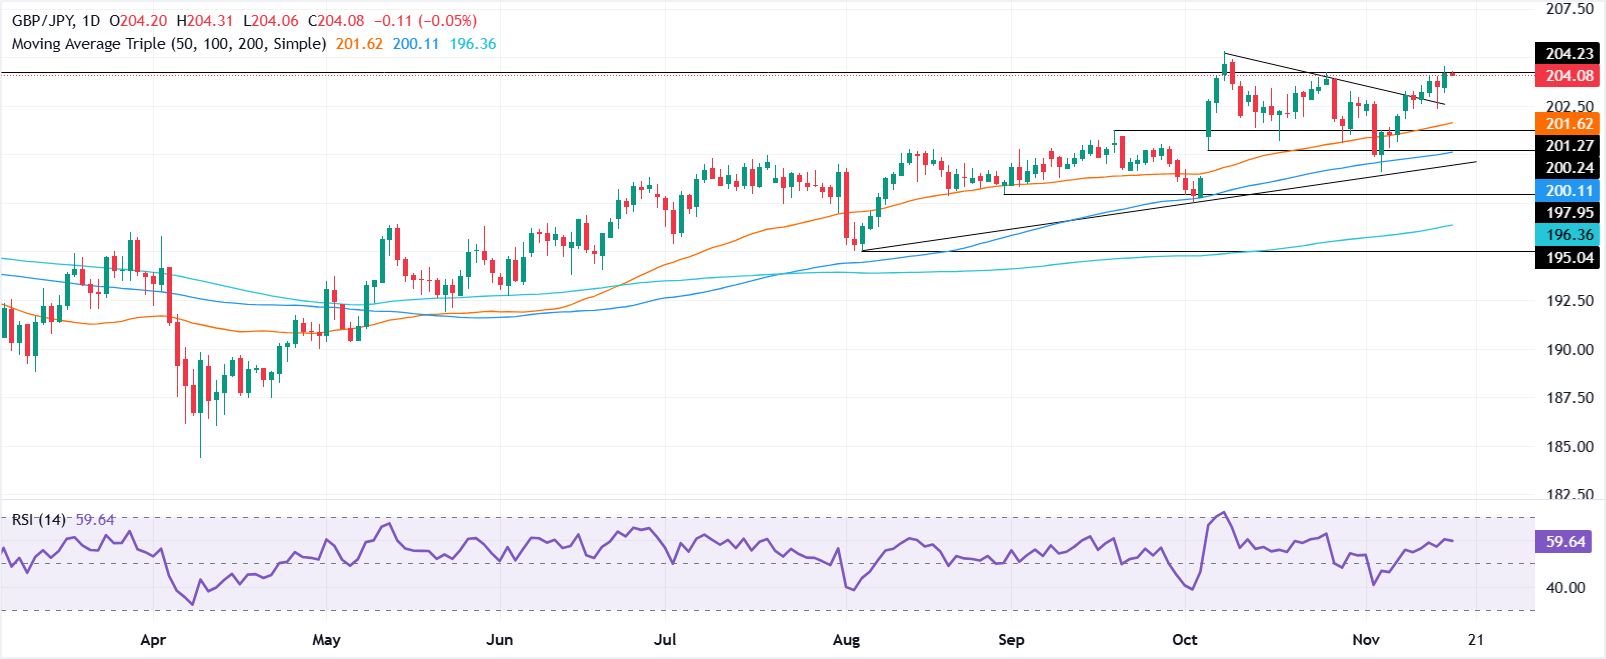
GBP/JPY Price Forecast: Technical outlook
The GBP/JPY technical picture shows the pair is neutral biased tilted to the upside with key resistance levels found at 204.50. The Relative Strength Index (RSI) is bullish, though it shows that buyers are losing some momentum.
For a bullish continuation, buyers must clear the 204.50 area, ahead of challenging 205.00. Once surpassed, the next stop would be the October 8 high at 205.32, followed by 206.00.
Conversely if sellers push GBP/JPY below 204.00, the pair could challenge the 20-day SMA at 202.71. On further weakness the next support is 202.00
GBP/JPY Price Chart – Daily
Pound Sterling Price Today
The table below shows the percentage change of British Pound (GBP) against listed major currencies today. British Pound was the strongest against the Australian Dollar.
| USD | EUR | GBP | JPY | CAD | AUD | NZD | CHF | |
|---|---|---|---|---|---|---|---|---|
| USD | 0.00% | 0.05% | -0.02% | 0.03% | 0.11% | 0.06% | -0.06% | |
| EUR | -0.00% | 0.05% | -0.02% | 0.02% | 0.11% | 0.06% | -0.06% | |
| GBP | -0.05% | -0.05% | -0.06% | -0.02% | 0.06% | 0.02% | -0.11% | |
| JPY | 0.02% | 0.02% | 0.06% | 0.03% | 0.12% | 0.06% | -0.05% | |
| CAD | -0.03% | -0.02% | 0.02% | -0.03% | 0.09% | 0.04% | -0.09% | |
| AUD | -0.11% | -0.11% | -0.06% | -0.12% | -0.09% | -0.05% | -0.16% | |
| NZD | -0.06% | -0.06% | -0.02% | -0.06% | -0.04% | 0.05% | -0.12% | |
| CHF | 0.06% | 0.06% | 0.11% | 0.05% | 0.09% | 0.16% | 0.12% |
The heat map shows percentage changes of major currencies against each other. The base currency is picked from the left column, while the quote currency is picked from the top row. For example, if you pick the British Pound from the left column and move along the horizontal line to the US Dollar, the percentage change displayed in the box will represent GBP (base)/USD (quote).
Recommended Articles


