
AUD/USD Price Forecast: Below 0.6415, the pair might fall to 0.6375
- Aussie Dollar remains depressed, with bears testing two-month lows at 0.6415.
- US Dollar is outperforming its peers in risk-averse markets, ahead of Fed Powell's speech.
- AUD/USD's immediate trend is bearish, with the next downside targets at 0.6400 and 0.6365.
Aussie Dollar’s upside attempts have been contained below 0.6430 so far on Friday, and the pair turned lower again to two-month lows at the 0.6415 area, which is being tested at the time of writing.
The US Dollar is outperforming its main peers, underpinned by a moderate risk-averse market. Investors are wary of selling US Dollars, ahead of a speech by Fed Chair Jerome Powell, who is expected to give some clues about the bank’s next monetary policy steps.
AUD/USD is on track for a 1.3% weekly decline
This leaves the pair on the defensive, after a nearly 1.3% sell-off so far this week. In the absence of key macroeconomic data, the cautious market mood has been bleeding the risk-sensitive Australian Dollar this week, with upbeat US figures prompting investors to pare bets of Fed cuts and posing additional support for the Greenback.
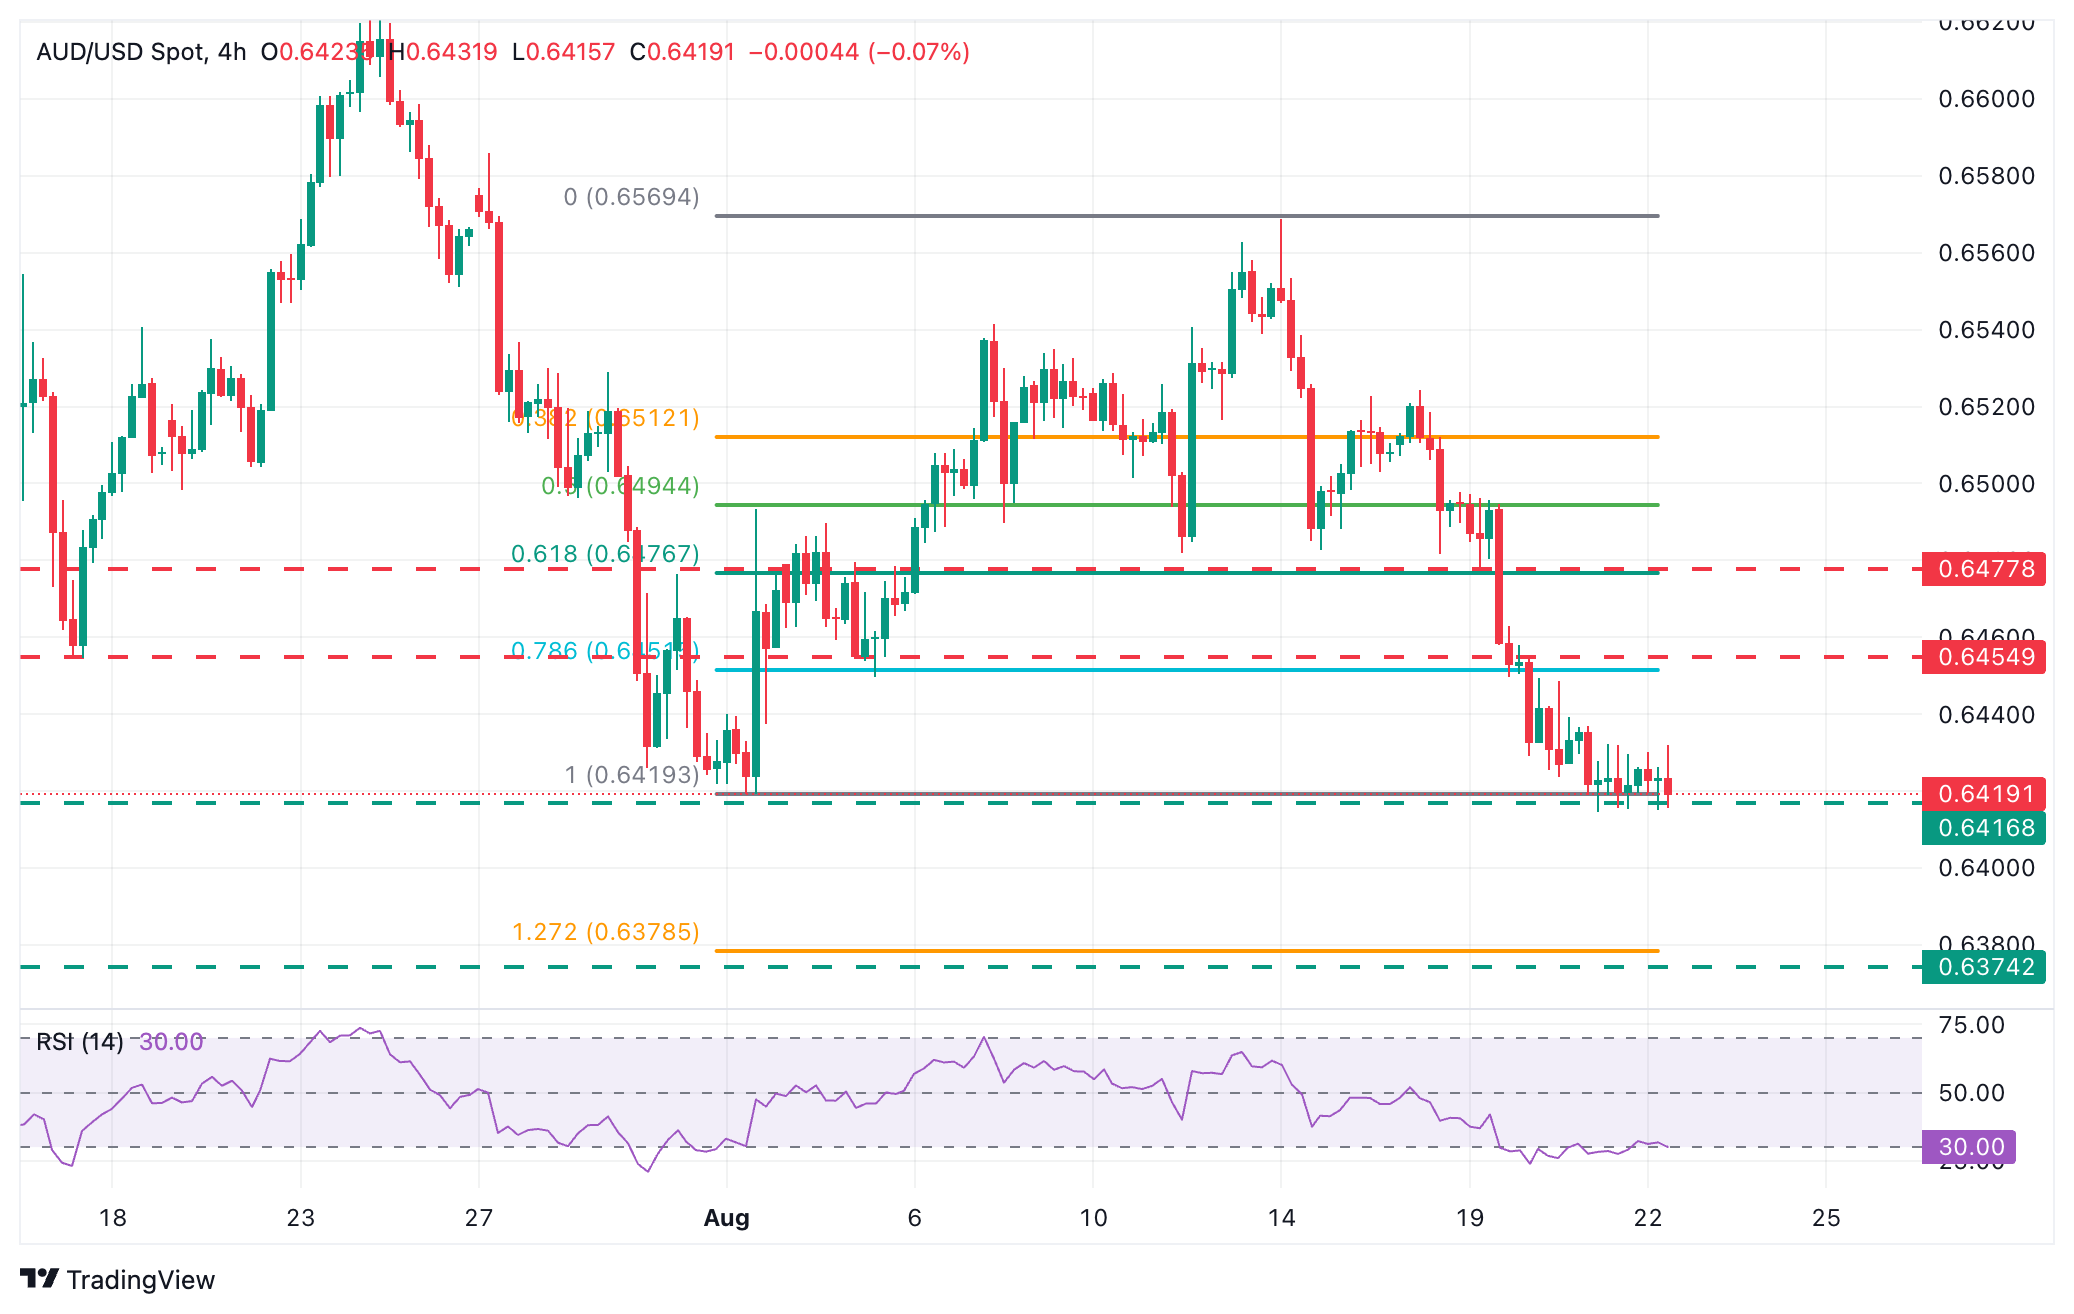
The technical picture, thus, is strongly bearish, with sellers pushing against support near the August 1 low of 0.6415 at the moment. Below here, the psychological level at 0.6400 might provide some support, but the 0.6375 level, where the June 23 low meets the 127.2 Fibiopnacci retracement of the early August rally, looks like a more plausible level.
To the upside, immediate resistance is at the mentioned 0.6435 intra-day high. Further up, the area between the August 5 low and August 20 high at 0.6450-0.6455 might challenge bulls ahead of the previous support near the 0.6480 area, where bears were contained on August 12, 14, and 18.
Australian Dollar Price This week
The table below shows the percentage change of Australian Dollar (AUD) against listed major currencies this week. Australian Dollar was the strongest against the New Zealand Dollar.
| USD | EUR | GBP | JPY | CAD | AUD | NZD | CHF | |
|---|---|---|---|---|---|---|---|---|
| USD | 0.94% | 1.04% | 1.06% | 0.69% | 1.39% | 2.03% | 0.36% | |
| EUR | -0.94% | 0.09% | 0.10% | -0.25% | 0.46% | 1.05% | -0.57% | |
| GBP | -1.04% | -0.09% | -0.10% | -0.33% | 0.37% | 0.96% | -0.70% | |
| JPY | -1.06% | -0.10% | 0.10% | -0.34% | 0.35% | 0.99% | -0.69% | |
| CAD | -0.69% | 0.25% | 0.33% | 0.34% | 0.67% | 1.33% | -0.36% | |
| AUD | -1.39% | -0.46% | -0.37% | -0.35% | -0.67% | 0.59% | -1.03% | |
| NZD | -2.03% | -1.05% | -0.96% | -0.99% | -1.33% | -0.59% | -1.67% | |
| CHF | -0.36% | 0.57% | 0.70% | 0.69% | 0.36% | 1.03% | 1.67% |
The heat map shows percentage changes of major currencies against each other. The base currency is picked from the left column, while the quote currency is picked from the top row. For example, if you pick the Australian Dollar from the left column and move along the horizontal line to the US Dollar, the percentage change displayed in the box will represent AUD (base)/USD (quote).
Recommended Articles


