
EUR/USD Price Forecast: Tests support around 1.1350, upside appears due to bullish bias


EUR/USD may revisit the April 21 high of 1.1573, marking its strongest level since November 2021.
The RSI remains above the 50 level, reinforcing the ongoing bullish sentiment.
The pair is currently testing key support at the nine-day EMA, around 1.1320.
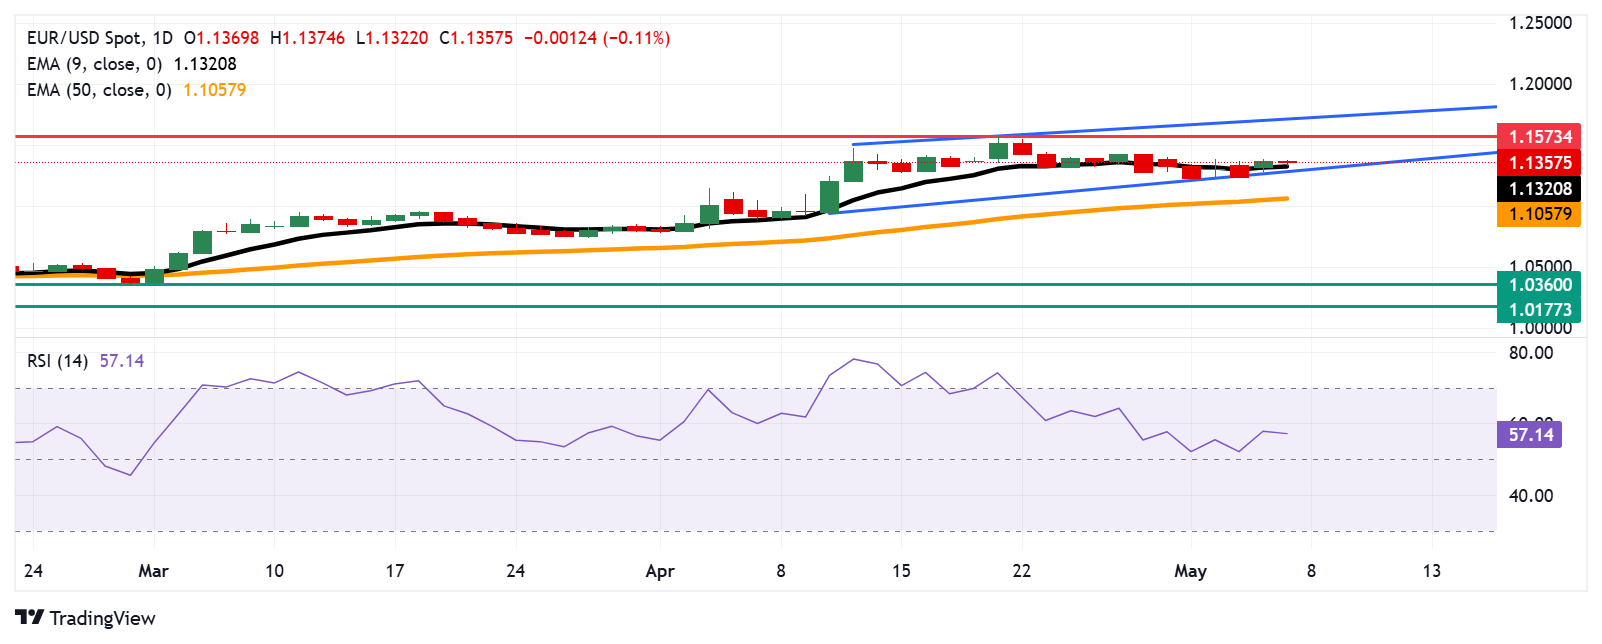
EUR/USD retraces its recent gains from the previous session, hovering near 1.1360 during Wednesday’s Asian session. Technical analysis on the daily chart continues to show a bullish bias, with the pair staying within an ascending channel pattern.
The EUR/USD pair remains slightly above the nine-day Exponential Moving Average (EMA), signaling strong short-term bullish momentum. The 14-day Relative Strength Index (RSI) also holds above the 50 mark, further supporting the prevailing bullish bias.
On the upside, the EUR/USD pair could retest the April 21 high of 1.1573 — its highest level since November 2021 — with the next resistance seen near the upper boundary of the ascending channel around 1.1730.
The EUR/USD pair is testing key support at the nine-day EMA near 1.1320, followed by the ascending channel’s lower boundary around 1.1300. A break below this crucial support zone could erode the bullish bias and open the door for a move toward the 50-day EMA around 1.1057.
Further downside pressure may weaken medium-term momentum, potentially extending the decline toward the six-week low of 1.0360, last seen on February 28.
EUR/USD: Daily Chart
Euro PRICE Today
The table below shows the percentage change of Euro (EUR) against listed major currencies today. Euro was the weakest against the US Dollar.
| USD | EUR | GBP | JPY | CAD | AUD | NZD | CHF | |
|---|---|---|---|---|---|---|---|---|
| USD | 0.06% | 0.11% | 0.46% | 0.10% | 0.18% | 0.03% | 0.30% | |
| EUR | -0.06% | 0.05% | 0.39% | 0.04% | 0.12% | -0.03% | 0.24% | |
| GBP | -0.11% | -0.05% | 0.34% | -0.00% | 0.07% | -0.07% | 0.19% | |
| JPY | -0.46% | -0.39% | -0.34% | -0.35% | -0.28% | -0.37% | -0.13% | |
| CAD | -0.10% | -0.04% | 0.00% | 0.35% | 0.08% | -0.07% | 0.19% | |
| AUD | -0.18% | -0.12% | -0.07% | 0.28% | -0.08% | -0.14% | 0.11% | |
| NZD | -0.03% | 0.03% | 0.07% | 0.37% | 0.07% | 0.14% | 0.26% | |
| CHF | -0.30% | -0.24% | -0.19% | 0.13% | -0.19% | -0.11% | -0.26% |
The heat map shows percentage changes of major currencies against each other. The base currency is picked from the left column, while the quote currency is picked from the top row. For example, if you pick the Euro from the left column and move along the horizontal line to the US Dollar, the percentage change displayed in the box will represent EUR (base)/USD (quote).
* The content presented above, whether from a third party or not, is considered as general advice only. This article should not be construed as containing investment advice, investment recommendations, an offer of or solicitation for any transactions in financial instruments.


