
Bitcoin Price Forecast: BTC on the verge of a breakdown amid possible US strike on Iran


Bitcoin price finds support around the 50-day EMA at $103,100; a decisive close below this level could trigger a sharp correction.
Reports that US officials are preparing for a strike on Iran in the coming days could further weigh on sentiment.
US spot Bitcoin ETFs recorded $389.57 million in inflows on Wednesday, marking the eighth consecutive day of positive flows.
Bitcoin (BTC) price edges slightly higher, trading near $104,700 at the time of writing on Thursday, after stabilizing above a key level, the 50-day Exponential Moving Average (EMA) at $103,100. A breach below this level could trigger a sharp fall in BTC. The risk aversion could weigh in, as reports say US officials are preparing for a strike on Iran in the coming days. Despite this risk-off sentiment in global markets, institutional demand remained robust, with a positive inflow in US spot Bitcoin Exchange Traded Funds (ETFs) for the last eight consecutive days.
US prepares strike on Iran, says Bloomberg
The ongoing seven-day war between Iran and Israel took a major turn early on Thursday, as the news came in that the US officials are preparing for a strike on Iran in the coming days, according to Bloomberg.

The chart below shows that the Asian markets reacted negatively to this news. However, the largest cryptocurrency by market capitalization had a mild effect, as BTC holds around $104,700 during the early European session.
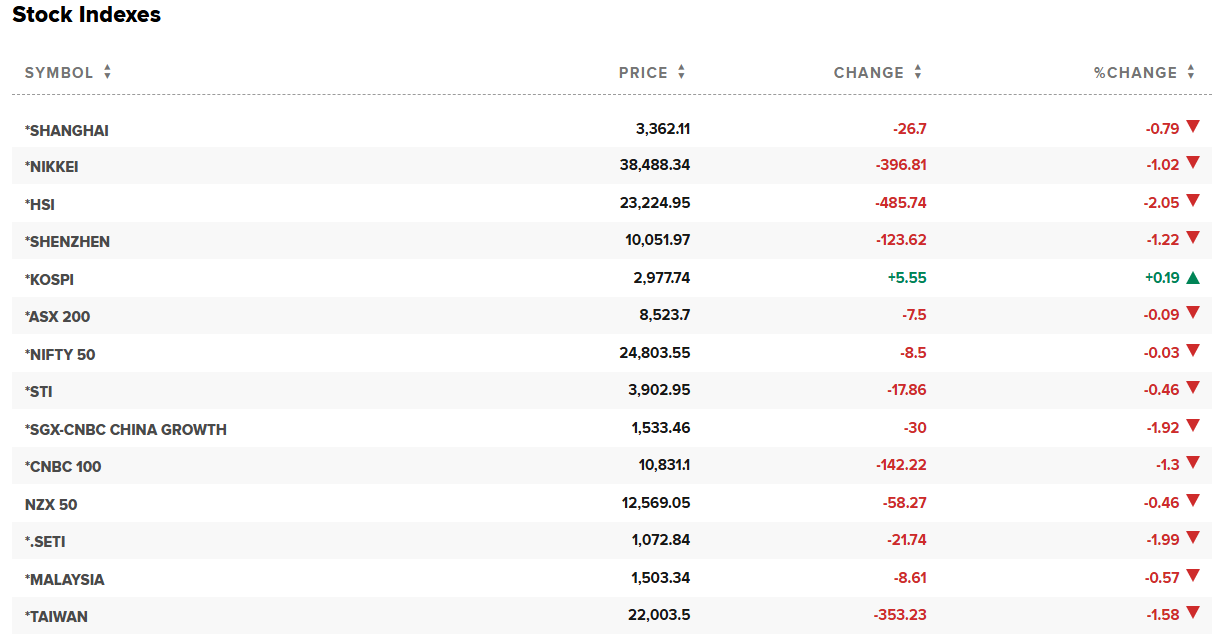
Asian markets chart.
However, BTC traders should still remain cautious, as volatility could increase if the US attacks Iran in the upcoming days, which could further weigh on sentiment, potentially causing a sharp decline in the BTC price.
US Fed holds interest rates amid tariffs and Israel-Iran conflict
The US Federal Reserve (Fed) kept the interest rate unchanged at the 4.25%–4.50% range at its June meeting on Wednesday, as widely expected. The Federal Open Market Committee (FOMC) still sees around 50 basis points of interest rate cuts through the end of 2025.
Fed Chair Jerome Powell warned that ongoing policy uncertainty will keep the Fed in a rate-hold stance, and any rate cuts will be contingent on labor and inflation data.
The markets remained neutral, as an unchanged interest rate was highly expected.
On Thursday, US President Donald Trump posted on his Truth Social account, “Too Late—Powell is the WORST. A real dummy, who’s costing America $Billions!”

Some signs of optimism
Despite the fear and uncertainty regarding geopolitical conflicts, BTC shows some signs of optimism. Santiment's Bitcoin positive vs. negative commentary across social media data shows that Bitcoin sentiment from retail traders reaches 1.03 bullish comments for every 1 bearish comment, a level not seen since the Fear, Uncertainty and Doubt (FUD) during the initial tariff reactions on April 6. Historically, the markets have moved in opposite directions to retail sentiment, indicating early bullish signs for BTC.
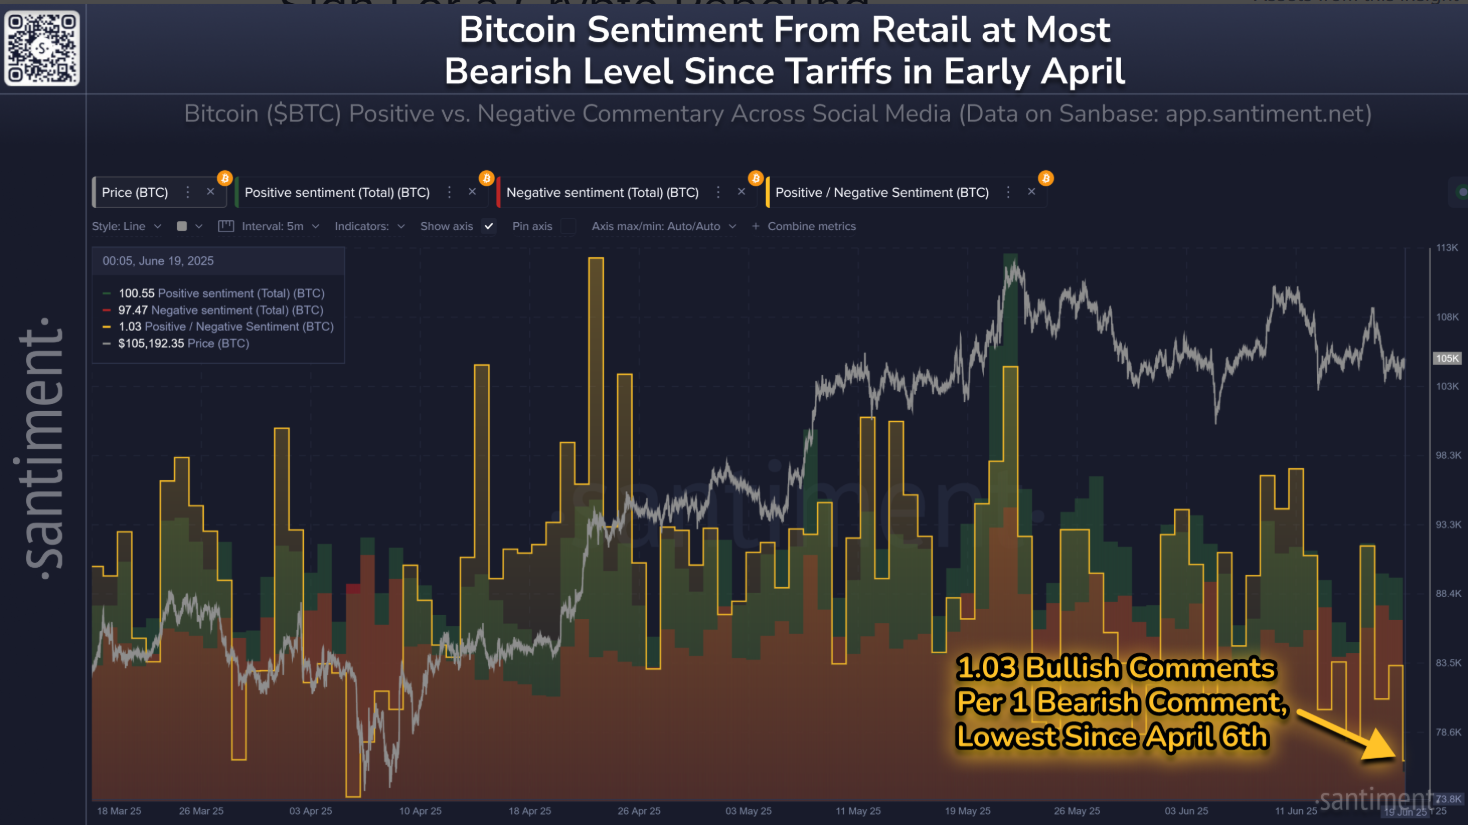
Retail sentiment chart. Source: Santiment
Looking at the institutional demand also remains strong. According to SoSoValue data, US spot Bitcoin Exchange Traded Funds (ETFs) recorded an inflow of $389.57 million on Wednesday, continuing its eight-day streak of gains since June 9. If these inflows continue, it could serve as a cushion for any price dips in BTC.
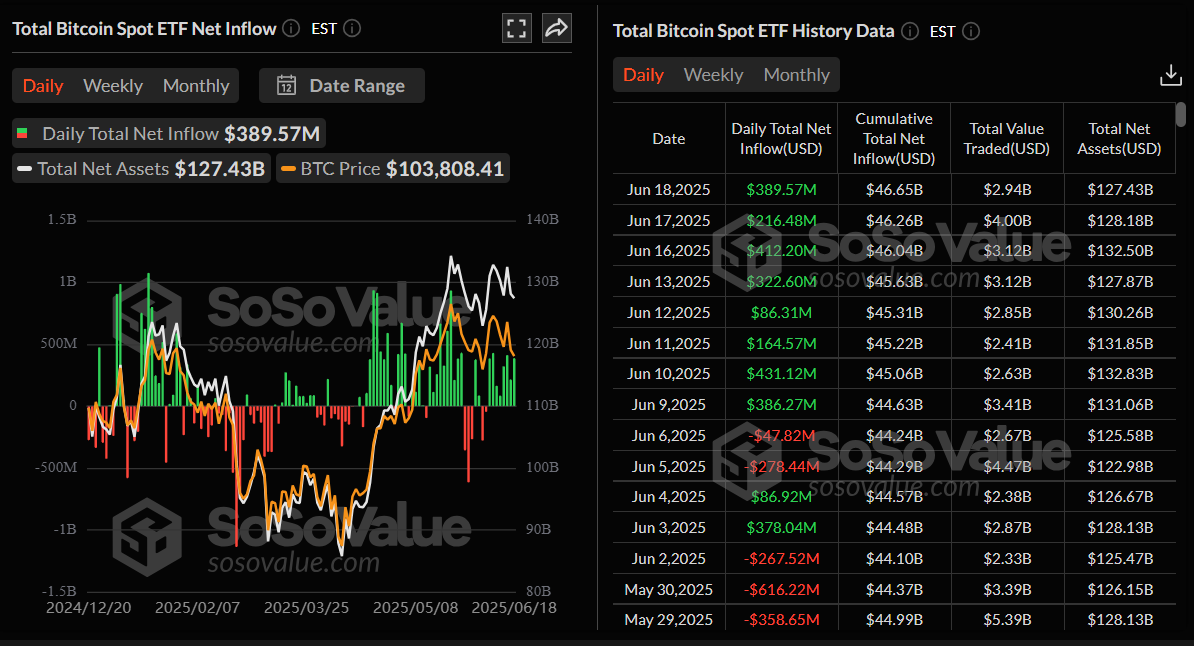
Total Bitcoin Sport ETF net inflow daily chart. Source: SoSoValue
Bitcoin Price Forecast: 50-day EMA holding BTC for now
Bitcoin price drew liquidity from its Fair Value Gap (FVG) around $108,064 on Monday and declined by 2.1% the following day. BTC has retested and found support multiple times around the 50-day Exponential Moving Average (EMA) at approximately $103,100, highlighting its strength as dynamic support. At the time of writing on Thursday, BTC trades at around $104,800.
If BTC continues its pullback and closes below the 50-day EMA at $103,100 on a daily basis, it could extend the decline to retest its key psychologically important level at $100,000.
The Relative Strength Index (RSI) momentum indicator on the daily chart reads 47, below its neutral level of 50, indicating that bearish momentum is gaining traction. The Moving Average Convergence Divergence (MACD) indicator displayed a bearish crossover last week. It also shows rising red histogram bars below its neutral level, indicating bearish momentum and giving credence to the downward trend.
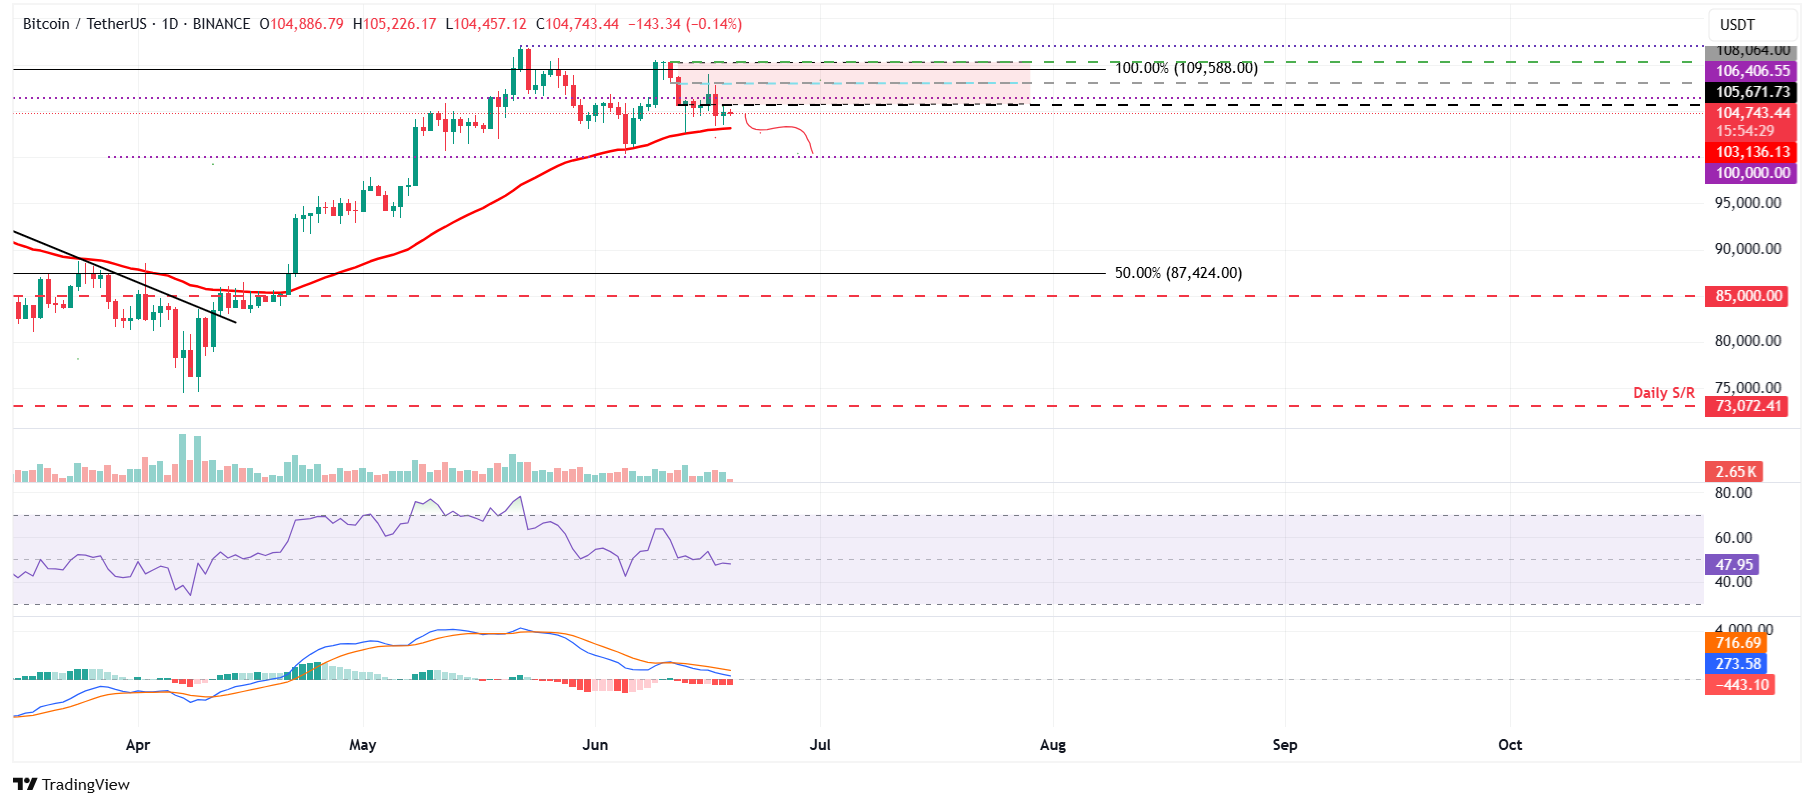
BTC/USDT daily chart
On the contrary, if BTC closes above its FVG level at $108,064, it could extend the recovery toward retesting its May 22 all-time high of $111,980.
* The content presented above, whether from a third party or not, is considered as general advice only. This article should not be construed as containing investment advice, investment recommendations, an offer of or solicitation for any transactions in financial instruments.


