
Gold edges lower as fears in the Middle East conflict ease
- Gold remains highly sensitive to macro and geopolitical developments, with all eyes on the Israel-Iran conflict.
- The US Dollar whipsaws with traders weighing interest rate expectations against safe-haven demand.
- XAU/USD treads cautiously after President Trump announces a two-week deadline for his decision on Iran, limiting Gold’s declines as investors wait for the next big move.
Gold (XAU/USD) is weakening on Friday, trading around $3,355 at the time of writing, as the yellow metal extends its pullback from the weekly high near $3,452 recorded on Monday.
However, the broader macro backdrop still favours Gold in the medium term, with ongoing demand from central banks and persistent geopolitical risks offering support.
This week, the Federal Reserve (Fed), the European Central Bank (ECB), and the Bank of England (BoE) all delivered cautious monetary policy updates, underscoring the risk that interest rates may stay elevated for longer.
Still, the near-term pullback in the Gold price is driven by US Dollar (USD) strength, firm Treasury yields, and reduced Fed rate-cut expectations, all of which have limited XAU/USD appeal for now.
Additionally, US President Trump convened a second high-level Situation Room meeting on Thursday. Trump has given officials a two-week deadline to present viable military and diplomatic strategies.
Concerns are mounting, especially if tensions disrupt the Strait of Hormuz, a key energy chokepoint.
Daily digest market movers: Gold remains on edge as the US continues to drive sentiment
- The Fed, ECB, and BoE speakers all struck cautious tones throughout the week, with Gold weighing the implications of rising yields against its safe-haven appeal.
- The Fed held rates at the 4.25%–4.50% range, maintaining projections for two rate cuts later this year, though Chair Jerome Powell emphasized a data-dependent approach, citing persistent inflation and geopolitical uncertainty.
- The ECB made it clear that further cuts will depend on progress in inflation data.
- Meanwhile, the BoE voted 6–3 to keep its Bank Rate at 4.25%, with three members backing a 25-basis-point cut.
- Governor Andrew Bailey acknowledged that rate reductions are likely, but will be “gradual and carefully considered.”
- Iran’s expanding stockpile of enriched uranium has reignited global concerns, with the US and Israel reaffirming opposition to a nuclear-armed Iran.
- The Russian Foreign Ministry warned that any US military intervention in Iran would be “extremely dangerous” and could lead to “unpredictable negative consequences.” These statements were released on Thursday by numerous News Agencies.
- On Friday, Israeli Défense Minister Israel Katz declared that Iran’s Supreme Leader Ayatollah Khamenei “cannot continue to exist,” intensifying geopolitical tensions in the region.
- Markets are digesting the implications of that meeting, which reportedly included evaluations of Iran’s fortified Fordow nuclear facility and potential pre-emptive strike options.
- Discussions are reportedly set to include Iran’s underground Fordow nuclear site, suggesting the possibility of direct US involvement.
- Roughly 20% of global Oil and Gas flows through the Strait of Hormuz. A disruption could spike Oil and energy prices. This could fuel inflation and pressure global central banks to leave interest rates higher for longer to tame rampant price pressures.
Technical analysis: Gold retreats, testing the 20-day SMA
XAU/USD price action reflects a deeper retracement of the April rally, with bulls failing to reclaim the $3,400 barrier and momentum indicators tilting lower.
The move comes as part of a broader Fibonacci retracement from the April swing low near $2,956 to the record high of $3,500.
After holding near the 23.6% Fibonacci retracement level earlier this week, Gold has now broken below that support at $3,371, exposing lower retracement levels and weakening the short-term technical outlook.
With the 20-day Simple Moving Average (SMA) being tested at $3,350, the next downside target lies at the 50-day SMA near $3,318, followed closely by the 38.2% Fibonacci retracement at $3,292.
These levels represent the first major test of the rally's durability. A break below that zone could expose horizontal support near $3,200, which supported multiple lows in April and May.
Upside levels to watch include the 23.6% Fibonacci retracement at $3,371, which now acts as resistance, and $3,400, a key psychological barrier.
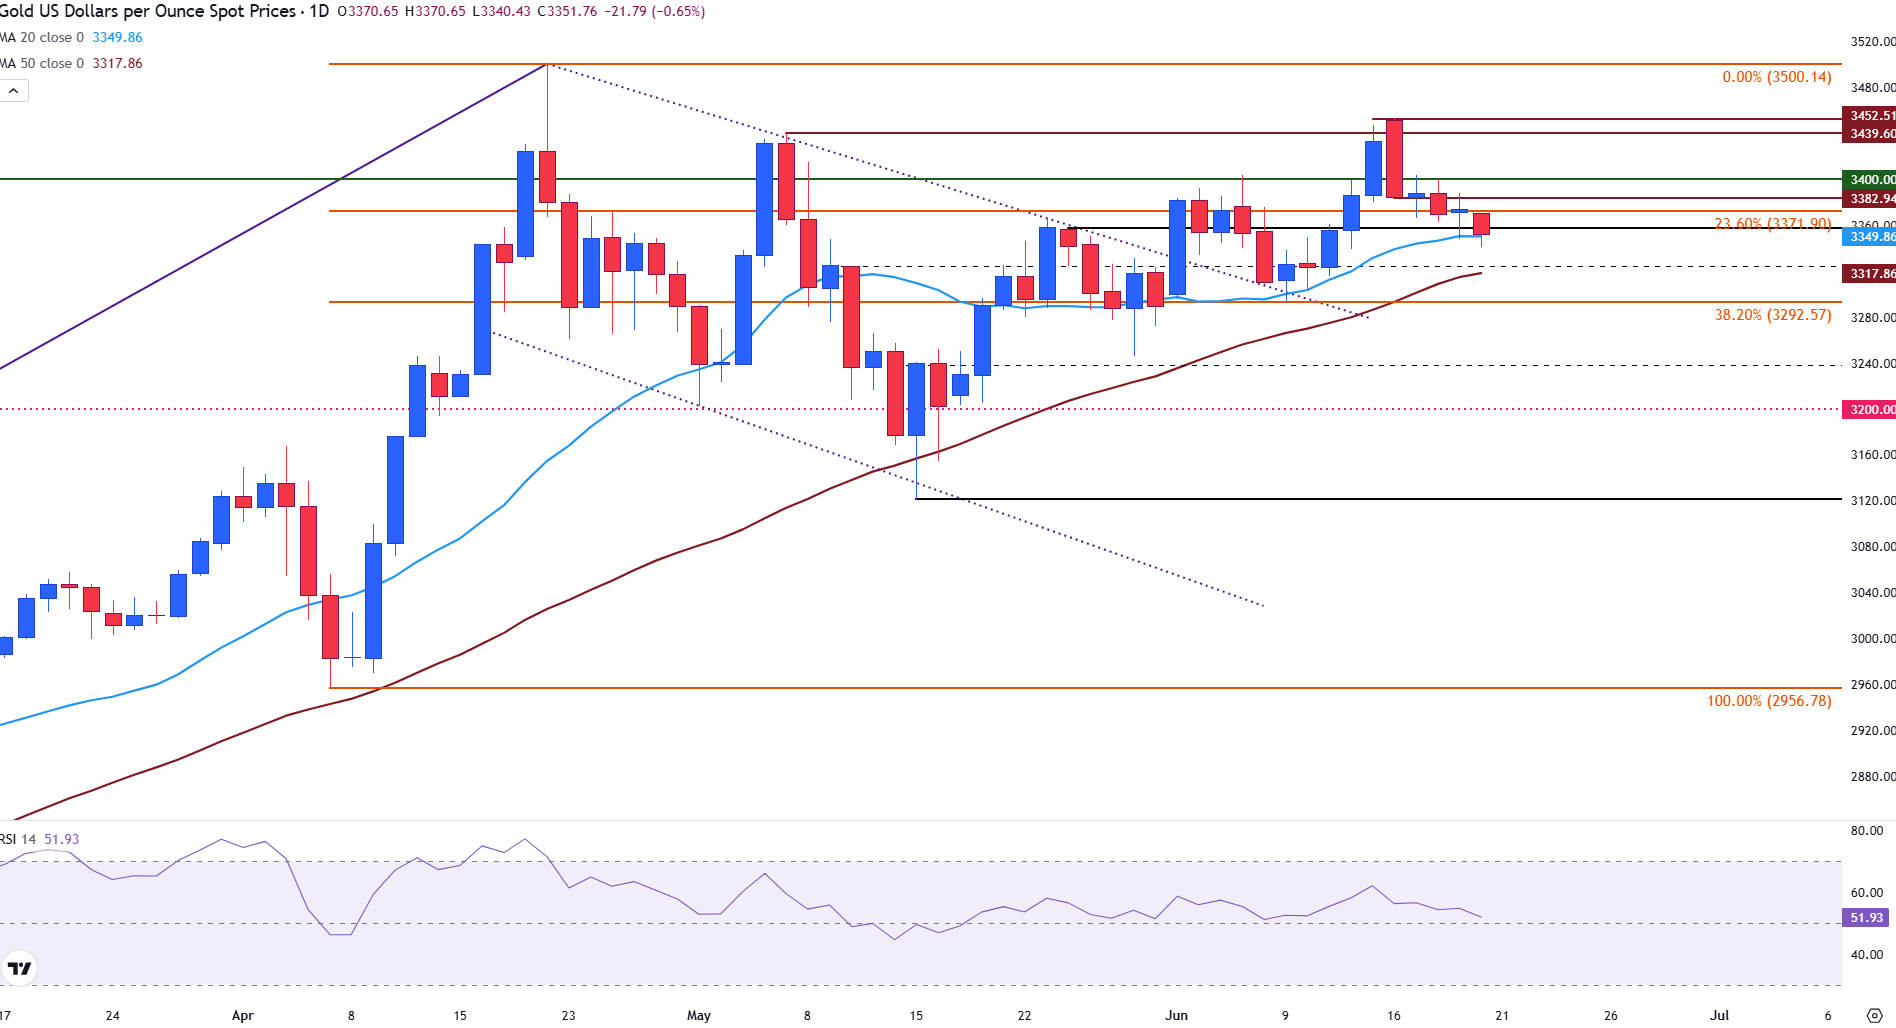
Above that level, Gold faces the post-breakout high of $3,452, both of which rejected recent bullish attempts.
Only a sustained close above these levels would revive the bullish bias and reopen a path toward retesting the all-time high of $3,500.
The Relative Strength Index (RSI) indicator prints at 52 on the daily chart, gradually slipping lower and signaling waning buying pressure and bullish momentum.
While not yet in oversold territory, the indicator suggests buyers are backing off, leaving Gold vulnerable to deeper retracements.
Gold FAQs
Gold has played a key role in human’s history as it has been widely used as a store of value and medium of exchange. Currently, apart from its shine and usage for jewelry, the precious metal is widely seen as a safe-haven asset, meaning that it is considered a good investment during turbulent times. Gold is also widely seen as a hedge against inflation and against depreciating currencies as it doesn’t rely on any specific issuer or government.
Central banks are the biggest Gold holders. In their aim to support their currencies in turbulent times, central banks tend to diversify their reserves and buy Gold to improve the perceived strength of the economy and the currency. High Gold reserves can be a source of trust for a country’s solvency. Central banks added 1,136 tonnes of Gold worth around $70 billion to their reserves in 2022, according to data from the World Gold Council. This is the highest yearly purchase since records began. Central banks from emerging economies such as China, India and Turkey are quickly increasing their Gold reserves.
Gold has an inverse correlation with the US Dollar and US Treasuries, which are both major reserve and safe-haven assets. When the Dollar depreciates, Gold tends to rise, enabling investors and central banks to diversify their assets in turbulent times. Gold is also inversely correlated with risk assets. A rally in the stock market tends to weaken Gold price, while sell-offs in riskier markets tend to favor the precious metal.
The price can move due to a wide range of factors. Geopolitical instability or fears of a deep recession can quickly make Gold price escalate due to its safe-haven status. As a yield-less asset, Gold tends to rise with lower interest rates, while higher cost of money usually weighs down on the yellow metal. Still, most moves depend on how the US Dollar (USD) behaves as the asset is priced in dollars (XAU/USD). A strong Dollar tends to keep the price of Gold controlled, whereas a weaker Dollar is likely to push Gold prices up.
Recommended Articles


