

Shiba Inu price prediction 2026-2032: Will SHIB skyrocket soon?
Key Takeaways
- In 2026, the Shiba Inu coin price prediction suggests a maximum value of $0.00001775.
- In 2029, SHIB is expected to reach a maximum value of $0.00002290.
- The price of Shiba Inu is predicted to reach a maximum value of $0.00004280 in 2032.
Shiba Inu (SHIB) was initially launched as a meme coin with ambitions to surpass Dogecoin’s popularity and market presence. Over time, Shiba coin has continued to expand its ecosystem through Shibarium, ShibaSwap, and new utility-driven updates. Recent developments show growing activity as the team launched “Shib Owes You” (SOU), introduced AI tools through “Shibarium Skills,” and addressed RPC connection issues affecting users.
At the same time, SHIB gained real-world utility after integrating with OnePay, a payment network backed by Walmart. Shibarium also surpassed 270 million wallet addresses, showing steady adoption and increasing on-chain activity.
As Shiba Coin’s ecosystem grows, questions arise about SHIB’s market capitalization and its price trajectory. How much will Shiba Inu be worth in the coming years? Will the advancements drive SHIB to new highs and impact the market’s price action?
Will SHIB ever reach $1? In this Shiba Inu price prediction, analyzed by Cryptopolitan, we’ll determine future SHIB price trends between 2026 and 2032.
Overview
| Cryptocurrency | Shiba Inu |
| Token | SHIB |
| Price | $0.00000620 |
| Market Cap | $3.67B |
| Trading Volume (24-hour) | $96.45M |
| Circulating Supply | 589.24T SHIB |
| All-time High | $0.00008845 (Oct 27, 2021) |
| All-time Low | $0.00000000008165 (Aug 31, 2020) |
| 24-hour high | $0.000006316 |
| 24-hour low | $0.000006186 |
Shiba Inu price prediction: Technical Analysis
| Metric | Value |
|---|---|
| Volatility | 2.45% (Medium) |
| 50-Day SMA | $ 0.0000006012 |
| 14-Day RSI | 58.01 (Neutral) |
| Market Sentiment | Neutral |
| Fear & Greed Index | 47 (Neutral) |
| Green Days | 15/30 (50%) |
| 200-Day SMA | $ 0.0000007438 |
Shiba Inu price analysis
- The current SHIB price analysis shows the price consolidating near $0.00000620.
- Today, SHIB is slightly bearish, down around 1.12% over the past 24 hours.
- SHIB faces immediate resistance near $0.00000627 and the current support at $0.00000618
On May 3, 2026, Shiba Inu (SHIB) is trading at $0.00000620, which shows a moderate bearish pressure after failing to sustain upward momentum. The overall market trend remains sideways-to-weak, with price action stabilizing after a prolonged downtrend. The market activity has moderate trading volume, suggesting cautious participation from traders rather than strong conviction.
Shiba Inu price analysis 1-day chart
The one-day SHIB price chart shows a consolidation phase following a steady decline over recent months. The price is moving near $0.00000620, with small-bodied candlesticks reflecting indecision in the market.
Resistance is at $0.00000627, which is the recent high, while immediate support lies around $0.00000618, which has been tested over the last 24 hours. A breakdown below this level could extend losses, while a breakout above resistance may trigger a short-term recovery.
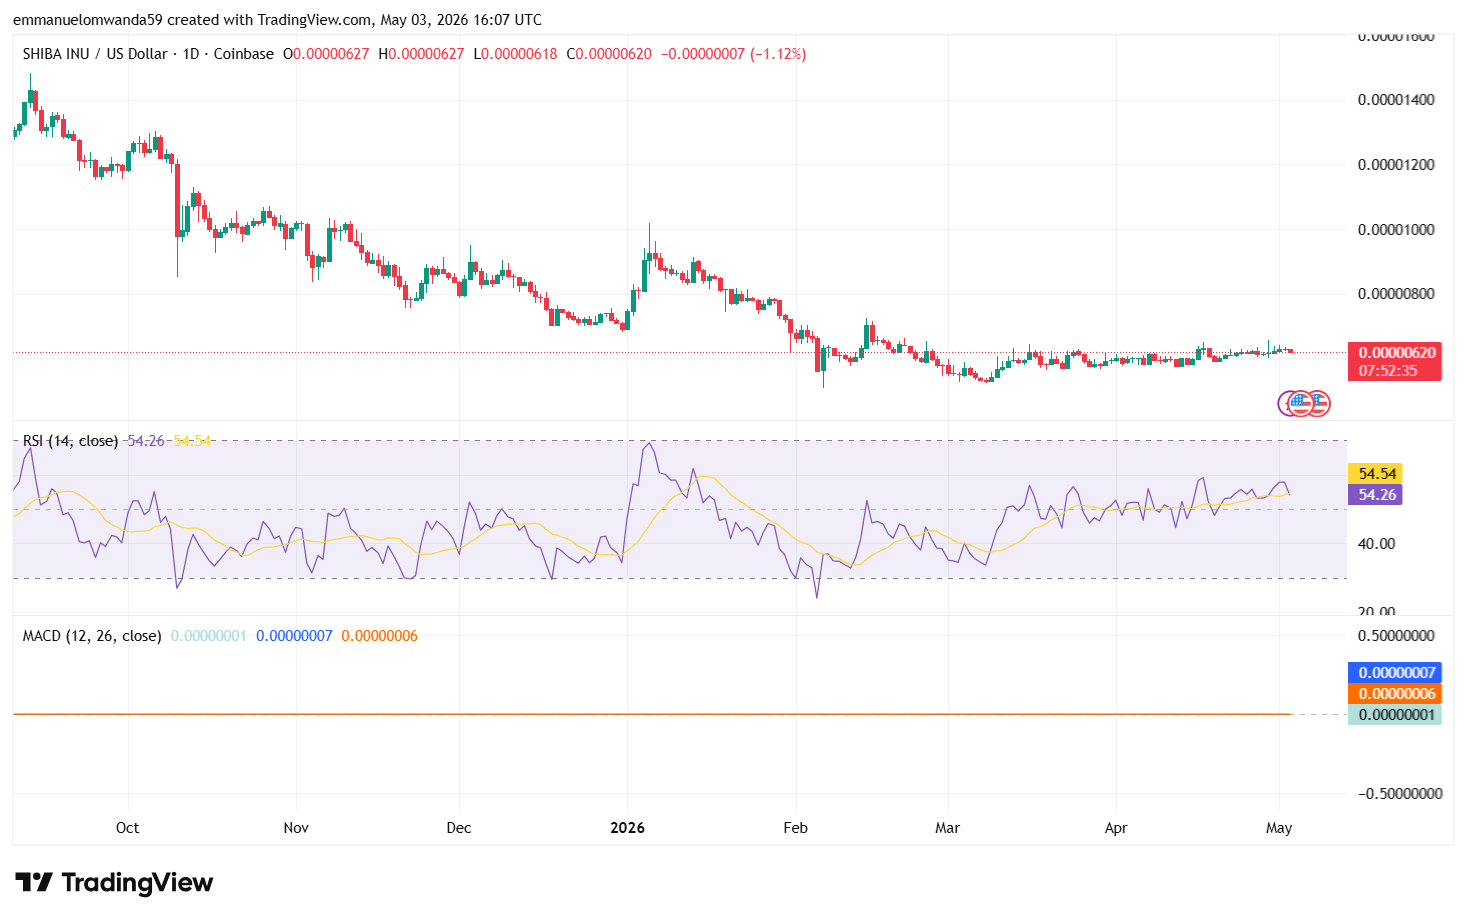
The Relative Strength Index (RSI) stands at 54.26, placing it in the neutral zone. The RSI line is slightly upward-sloping, indicating mild buying pressure returning. However, it is not strong enough yet to confirm a bullish reversal.
The MACD indicator remains close to the signal line with minimal histogram expansion, suggesting weak momentum and no clear trend dominance.
SHIB/USD 4-hour price chart shows Sideways momentum with weak bullish attempts
The 4-hour Shiba Inu price chart suggests that the market is moving sideways, with buyers attempting to hold the price near $0.00000620, but without strong momentum to break higher. Sellers are still active around recent highs, limiting upside movement.
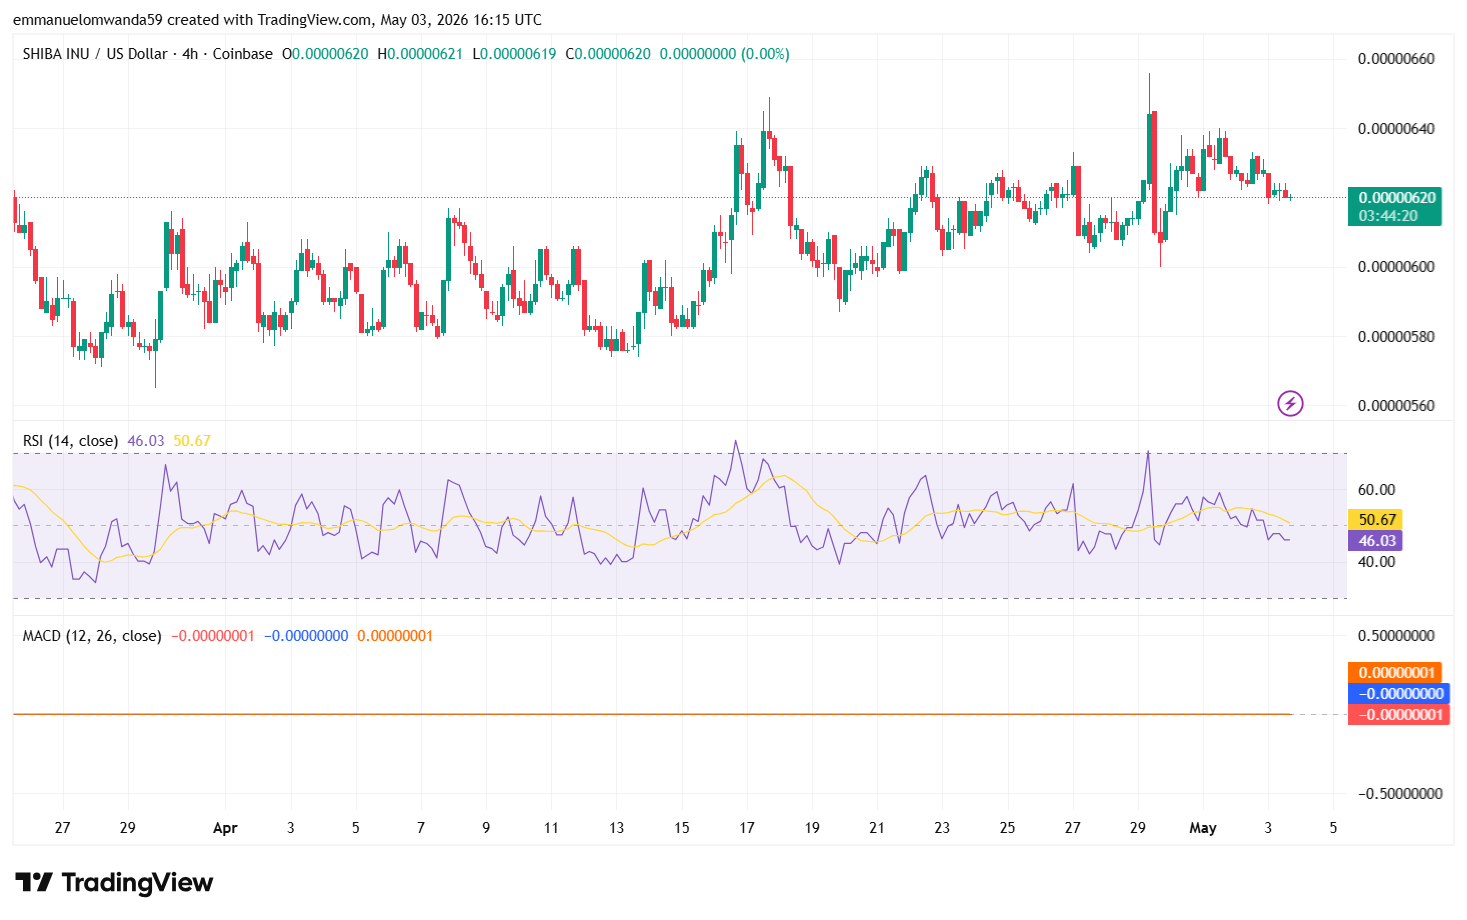
The RSI indicator is at 46.03, slightly below the neutral 50 level, indicating mild bearish pressure in the short term. The RSI line trending below its average also reflects weakening buying strength.
However, the MACD indicator is flat and near the signal line, showing very low momentum. The histogram is minimal, suggesting that neither buyers nor sellers currently dominate the trend.
The 4-hour chart reflects a balanced but slightly bearish market, where consolidation continues unless a breakout above $0.00000640 or a drop below $0.00000600 occurs.
What to expect from the SHIB price analysis next?
Shiba Inu technical indicators: Levels and action
Daily simple moving average (SMA)
| Period | Value | Action |
| SMA 3 | $0.000006259 | SELL |
| SMA 5 | $0.000006213 | BUY |
| SMA 10 | $0.000006198 | BUY |
| SMA 21 | $0.000006109 | BUY |
| SMA 50 | $0.000006012 | BUY |
| SMA 100 | $0.000006166 | BUY |
| SMA 200 | $0.000007438 | SELL |
Daily exponential moving average (EMA)
| Period | Value | Action |
| EMA 3 | $0.000006254 | SELL |
| EMA 5 | $0.000006232 | SELL |
| EMA 10 | $0.000006193 | BUY |
| EMA 21 | $0.000006129 | BUY |
| EMA 50 | $0.000006102 | BUY |
| EMA 100 | $0.000006458 | SELL |
| EMA 200 | $0.000007564 | SELL |
What to expect from the SHIB price analysis next?
SHIB is likely to continue sideways consolidation, with a slight bearish bias unless buyers push above $0.00000640.A break below $0.00000600 could trigger further downside, while a breakout may start a short-term recovery.
Is Shiba Inu a good investment?
Shiba Inu (SHIB) is currently consolidating between key support and resistance. A breakout above resistance could lead to gains, while failure to hold support may cause further downside. SHIB may suit investors comfortable with volatility, but it’s important to monitor price action closely before making any investment decision.
Why is Shiba Inu down today?
SHIB is down today mainly due to technical selling pressure, as the price remains below key moving averages acting as resistance. There’s no major negative news, meaning the drop is driven by normal market behavior like profit-taking and weak buying demand. In the short term, SHIB may stay neutral-to-bearish, holding above $0.000006185 for a possible bounce, but a break below could lead to further downside.
Recent news on Shiba Inu
Japan’s Rakuten Wallet, a major regulated exchange, announced it will list SHIB for spot trading starting April 15. This follows SHIB’s earlier inclusion on Japan’s “Green List,” alongside Bitcoin and Ethereum, thereby streamlining compliance for domestic exchanges.
SHIBIZENS NEWS UPDATE | Last 24h| 4/10/26
Market Overview 🔸 BTC: $71,800 – $72,200 🔸 ETH: ~$2,250 🔸 Total Market Cap: ~$2.6T 🔸 24h Volume: Elevated due to volatility 🔸 Fear & Greed Index: 41 (Fear) 🔸 Altcoin Season Index: 32 (Bitcoin dominance phase)
1. Japan classifies… pic.twitter.com/fU0oQlBt03
— Shibarium | SHIB.IO (@Shibizens) April 10, 2026
Shiba Inu (SHIB) has been included in SBI VC Trade’s “Rent Coin” lending program in Japan, offering yields of around 2% to 5% APY over a ~28-day term. The move follows SHIB’s addition to Japan’s Green List, reinforcing its status as a regulated asset and expanding its use into lending and passive income services.
Will SHIB reach $0.00005?
Yes, according to crypto experts’ long-term predictions, SHIB’s role in the cryptocurrency market is projected to lead it to reach $0.00005 behold 2032.
Will SHIB reach $100?
SHIB’s goal of reaching $100 is virtually impossible given its vast circulating supply in the meme coin market, which significantly influences its price movements. Additionally, to get the $100 mark, SHIB would require a significant increase in its market cap, which is beyond imagination for a meme coin.
Does SHIB have an excellent long-term future?
The Shiba Inu price made headlines in January 2025 after Shytoshi Kusama, the lead developer, stepped down. However, SHIB shows some positive movement, suggesting the ecosystem may have a promising long-term future.
However, its success will also depend on macroeconomic factors, partnerships, broader market adoption trends, and other regulatory developments that influence market cycles. You are advised to seek investment advice, do your own research, and gather expert opinions before investing in the highly volatile crypto market.
Shiba Inu price prediction for May 2026
The Shiba Inu price forecast for May 2026 is expected to range from $0.00000560 to $0.000007757. The average price for SHIB is projected to be around $0.00000668, assuming a gradual recovery and moderate buying interest.
| Month | Potential low | Potential average | Potential high |
|---|---|---|---|
| May 2026 | $0.00000560 | $0.00000668 | $0.000007757 |
Shiba Inu price prediction 2026
The shiba inu cost in 2026 is predicted to range from a minimum of $0.000005173 to a maximum of $0.000027, with an average price of $0.000016086. The Shiba Inu price prediction for 2026 suggests a potential high of $0.000027 and a low of $0.000005173.
| Year | Potential low | Potential average | Potential high |
|---|---|---|---|
| 2026 | $0.000005173 | $0.000016086 | $0.000027 |
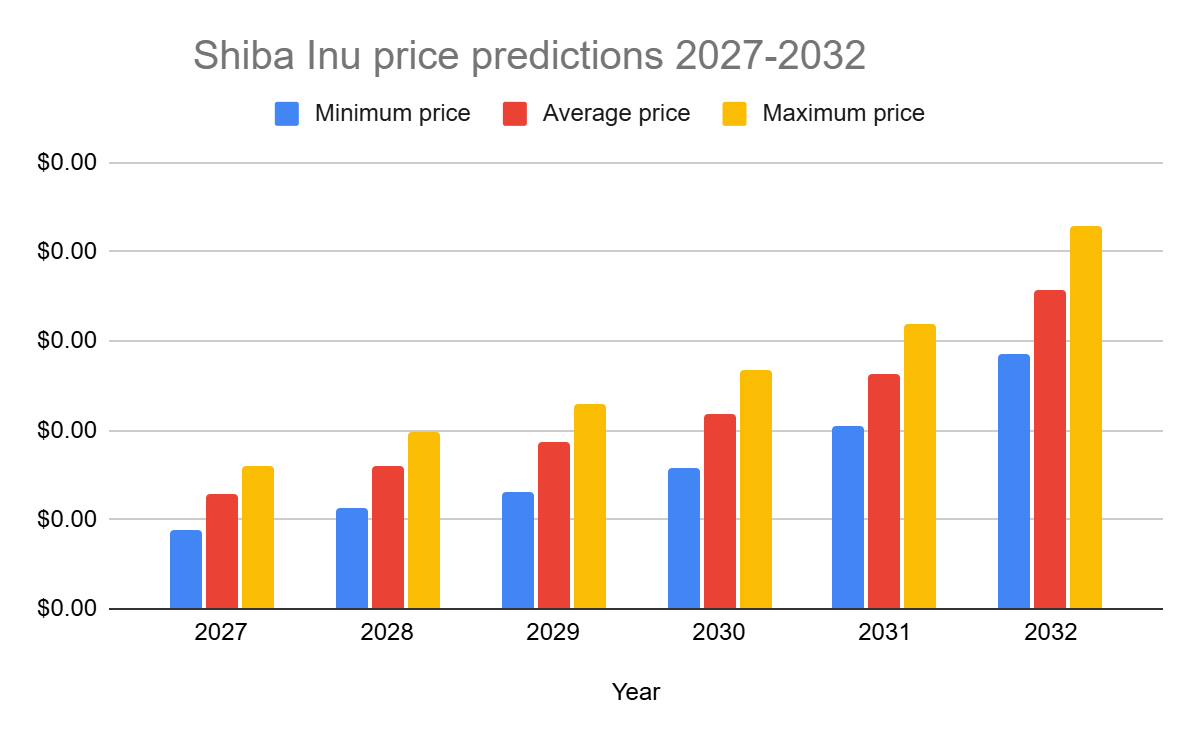
Shiba Inu price predictions 2027-2032
| Year | Minimum price | Average price | Maximum price |
|---|---|---|---|
| 2027 | $0.00000890 | $0.00001280 | $0.00001610 |
| 2028 | $0.00001140 | $0.00001590 | $0.00001980 |
| 2029 | $0.00001320 | $0.00001870 | $0.00002290 |
| 2030 | $0.00001580 | $0.00002190 | $0.00002680 |
| 2031 | $0.00002040 | $0.00002630 | $0.00003190 |
| 2032 | $0.00002860 | $0.00003570 | $0.00004280 |
Shiba Inu Price Prediction 2027
In 2027, the price of Shiba Inu is projected to reach a minimum level of $0.00000890. The SHIB price could rise to a maximum of $0.00001610, with an average trading price of $0.00001280 as the market gradually recovers and the ecosystem grows.
Shiba Inu Price Prediction 2028
The price of Shiba Inu is expected to reach a minimum level of $0.00001140 in 2028. The SHIB price could climb to a maximum level of $0.00001980, with an average price of $0.00001590 throughout the year.
Shiba Inu Price Prediction 2029
In 2029, the price of Shiba Inu is predicted to reach a minimum level of $0.00001320. The SHIB price could reach a maximum level of $0.00002290, with an average trading price of $0.00001870.
Shiba Inu Price Prediction 2030
In 2030, Shiba Inu is forecast to trade at a minimum value of $0.00001580. The price could reach a maximum of $0.00002680, with an average trading value of $0.00002190.
Shiba Inu Price Prediction 2031
In 2031, the price of Shiba Inu is expected to reach a minimum value of $0.00002040. The SHIB price could reach a maximum value of $0.00003190, with an average value of $0.00002630.
Shiba Inu Price Prediction 2032
Shiba Inu price is forecast to reach a lowest level of $0.00002860 in 2032. The SHIB price could reach a maximum level of $0.00004280, with an average forecast price of $0.00003570.
Shiba Inu market price prediction: Analysts’ SHIB price forecast
| Firm Name | 2026 | 2027 |
| DigitalCoinPrice | $0.0000155 | $0.0000216 |
| CoinCodex | $0.00001030 | $0.00001299 |
Cryptopolitan’s Shiba Inu price prediction
Our predictions show that the Shiba Inu cryptocurrency will achieve a minimum value of $0.00000545 in 2026. The Shiba Inu price could reach a maximum value of $0.00001775, with an average trading price of $0.00001160 throughout 2026. Please note that the content provided and other content on this page are for informational purposes only and do not constitute investment advice. Seek independent professional consultation or do your research.
Shiba Inu historic price sentiment
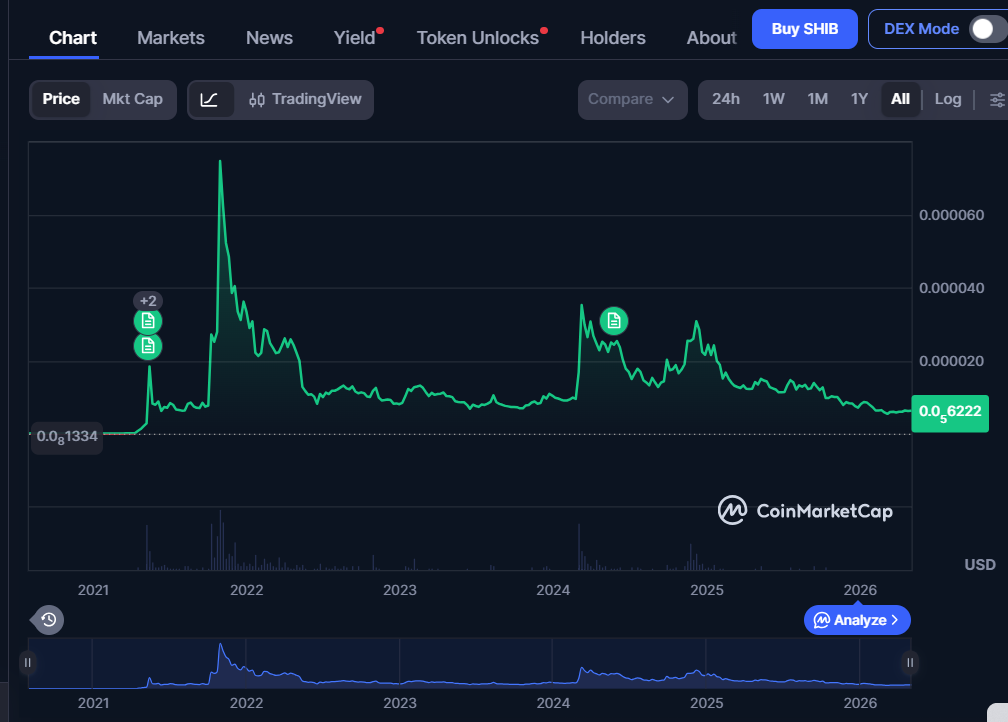
- Shiba Inu surged over 300% shortly after launch, triggering a trading frenzy similar to Dogecoin’s early 2021 rally. During this period, many investors rushed to buy SHIB on easy-to-use platforms as its popularity surged and exchanges quickly listed the token to meet demand.
- Shiba Inu’s price action has been marked by significant volatility, with sharp spikes and corrections driven by community hype, market sentiment, and broader crypto trends.
- In 2022, SHIB started near $0.000025 but dropped to around $0.000008 by May, then moved between $0.000007 and $0.000010 for the rest of the year.
- In early 2023, Shiba Inu briefly spiked to $0.000015 in February but declined gradually, stabilizing around $0.000010 by June 2023 and closing the year at $0.00001033.
- In March 2024, SHIB climbed to $0.000045 before consolidating between $0.000017 and $0.000029. By late 2024, the price moved between $0.000015 and $0.000033.
- In 2025, SHIB gradually declined from $0.000021 to below $0.000009 by December, despite brief rebounds during the year.
- In early 2026, SHIB briefly recovered to $0.0000098 in January but fell to the $0.0000065 range in February.
- In January 2026, Shiba Inu jumped from about $0.0000087 to near $0.0000098 before pulling back and stabilizing around $0.0000093.
- As of February 2026, Shiba Inu (SHIB) experienced volatility, fluctuating between approximately $0.0000065 and $0.0000068, with short-term rebounds failing to sustain upward momentum.
- At the start of March 2026, Shiba Inu (SHIB) remained under pressure, trading around $0.0000054 after slipping from the February range.
- Shiba Inu (SHIB) experienced a bullish momentum on March 16, 2026, with the price rising 8% in 24 hours to approximately and over 17% for the week.
- By the end of March 2026, Shiba Inu (SHIB) traded at around $0.0000058 after failing to sustain recoveries from mid-month gains.
- By mid-April 2026, Shiba Inu (SHIB) traded around $0.0000061, showing slight stabilization after recovering from the early March range, though buying momentum remained limited.
- At the start of May 2026, Shiba Inu (SHIB) traded around $0.0000062, moving in a tight range with slight consolidation, as the market showed weak momentum and no strong buying pressure.
Recommended Articles


