
Ripple Price Forecast: XRP extends recovery as Open Interest resets to Q2 levels
- XRP rises for the third consecutive day, signaling bullish sentiment on Monday.
- The XRP futures Open Interest dips to $3.53 billion after a cascade of volatile deleveraging events.
- Traders pile into long positions as funding rates rebound, asserting risk-on sentiment.
Ripple (XRP) is extending its recovery, trading above $2.45 at the time of writing on Monday. Bulls have tightened their grip on the market since Friday's sell-off, which tested support at $2.18 amid last week's volatile conditions. If bullish sentiment steadies this week, XRP may broaden the uptrend above the next key hurdle at $2.61.
XRP futures Open Interest shows stability
The XRP futures derivatives market is at the weakest level since April, following recent deleveraging events. On October 11, approximately $611 million in long positions and $90 million in shorts were liquidated, as market participants reacted to United States (US) President Donald Trump's signal for a potential 100% additional tariff on Chinese goods.
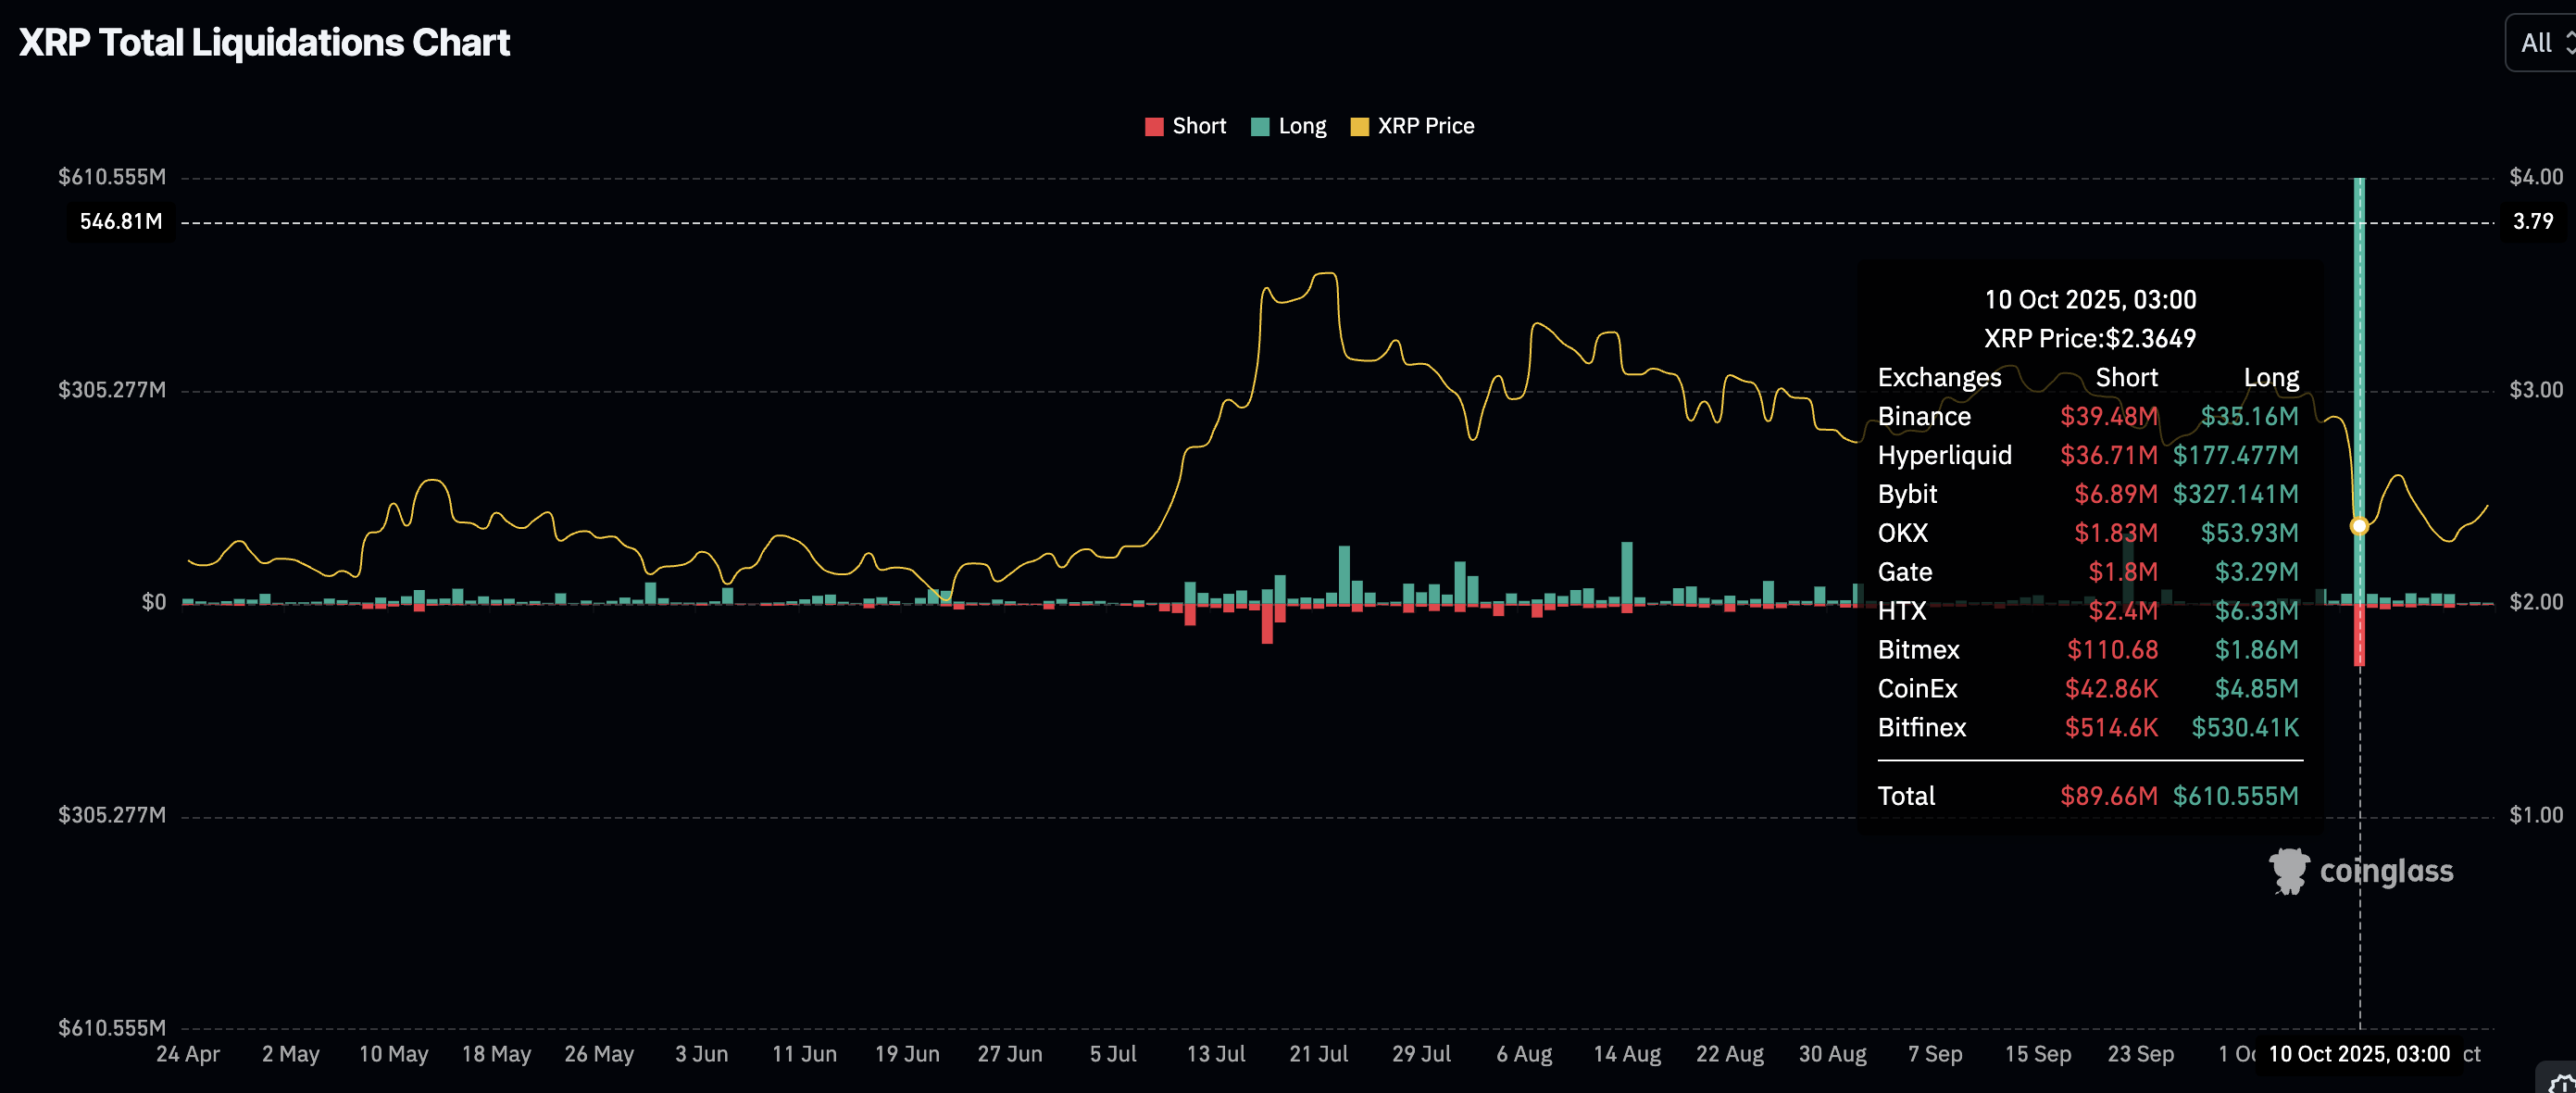
XRP liquidations | Source: CoinGlass
The trade standoff between the US and China remains delicate, highlighting existing macroeconomic uncertainty. Meanwhile, the larger cryptocurrency market lacks immediate price catalysts, but high volatility significantly increases risks.
It is this volatility that triggered another sell-off on Friday, leaving investors counting losses as the price of XRP declined to $2.18. According to CoinGlass data, the XRP futures Open Interest (OI) averages at $3.53 billion on Monday, the lowest level since late April.
OI is a measure of the notional value of outstanding futures contracts. It peaked at $10.94 billion after XRP achieved a new record high of $3.66 in mid-July, according to CoinGlass data. This persistent decline in OI suggests that the pool of XRP buyers continues to shrink amid increasing bearish pressure. If the downtrend in OI extends, it would be difficult for XRP to sustain the uptrend amid low retail demand and a sticky risk-off sentiment.
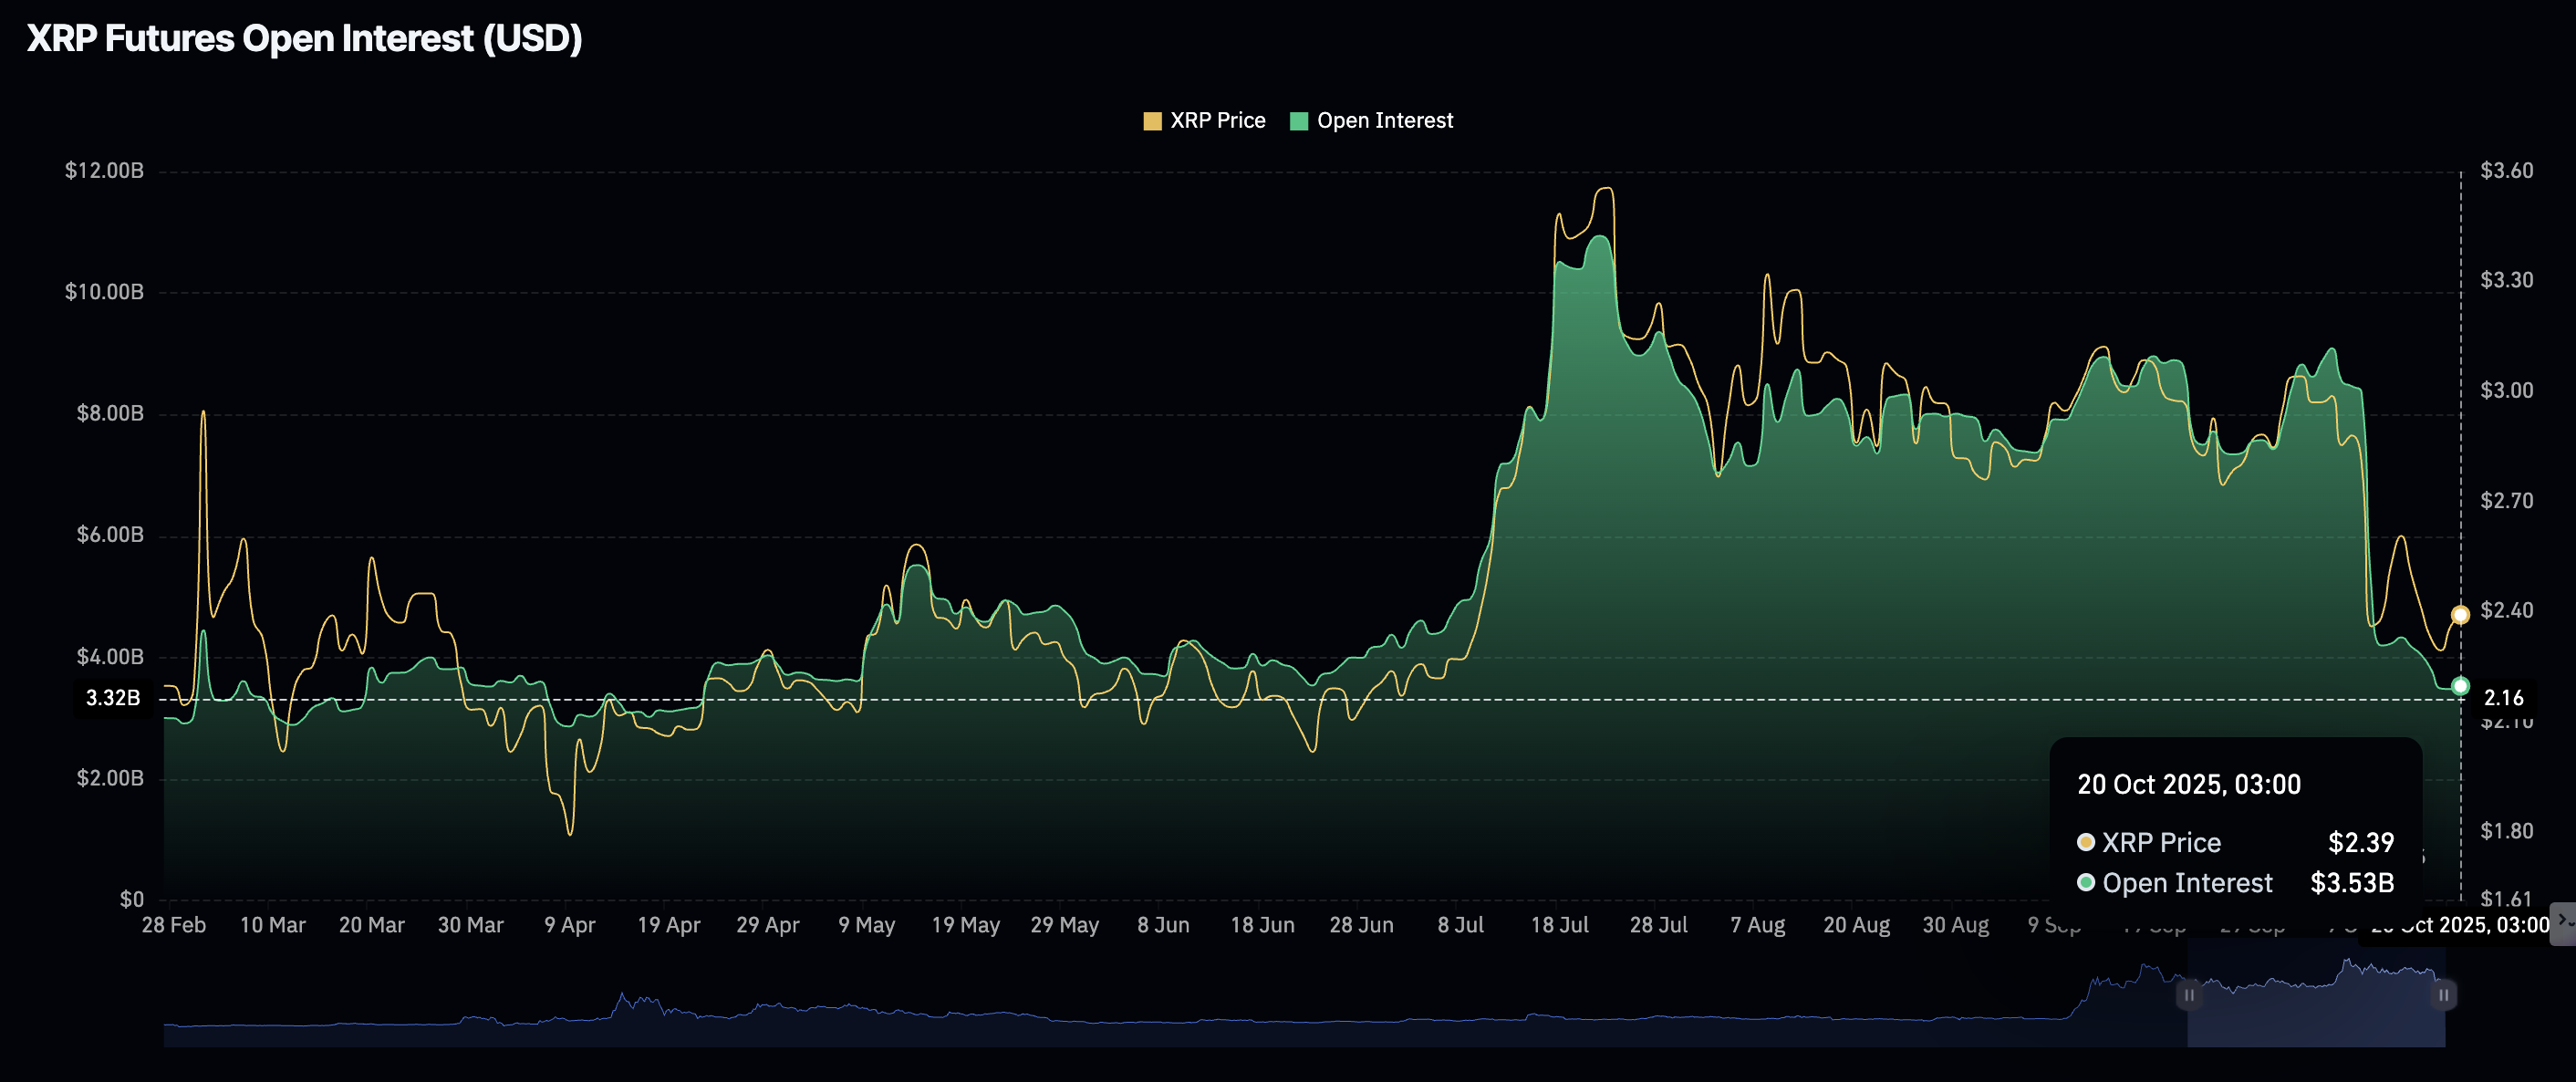
XRP Futures Open Interest | Source: CoinGlass
Technical outlook: XRP bulls battle to regain control
XRP is stretching out its recovery, reflecting a bullish wave in the broader cryptocurrency market on Monday. The token holds above $2.45 at the time of writing, bolstered by the Relative Strength Index (RSI) rebound above 40 from oversold territory on the daily chart, signaling easing bearish momentum.
With the RSI highlighting a bullish crossover above the signal line, the path of least resistance would remain upward, increasing the odds of testing the 200-day Exponential Moving Average (EMA) at $2.61.
The Moving Average Convergence Divergence (MACD) indicator shows signs of bottoming out and hints at an incoming buy signal. A buy signal occurs when the blue line crosses and settles above the red signal line, as the indicator generally rebounds. This encourages investors to increase risk exposure, contributing to buying pressure.
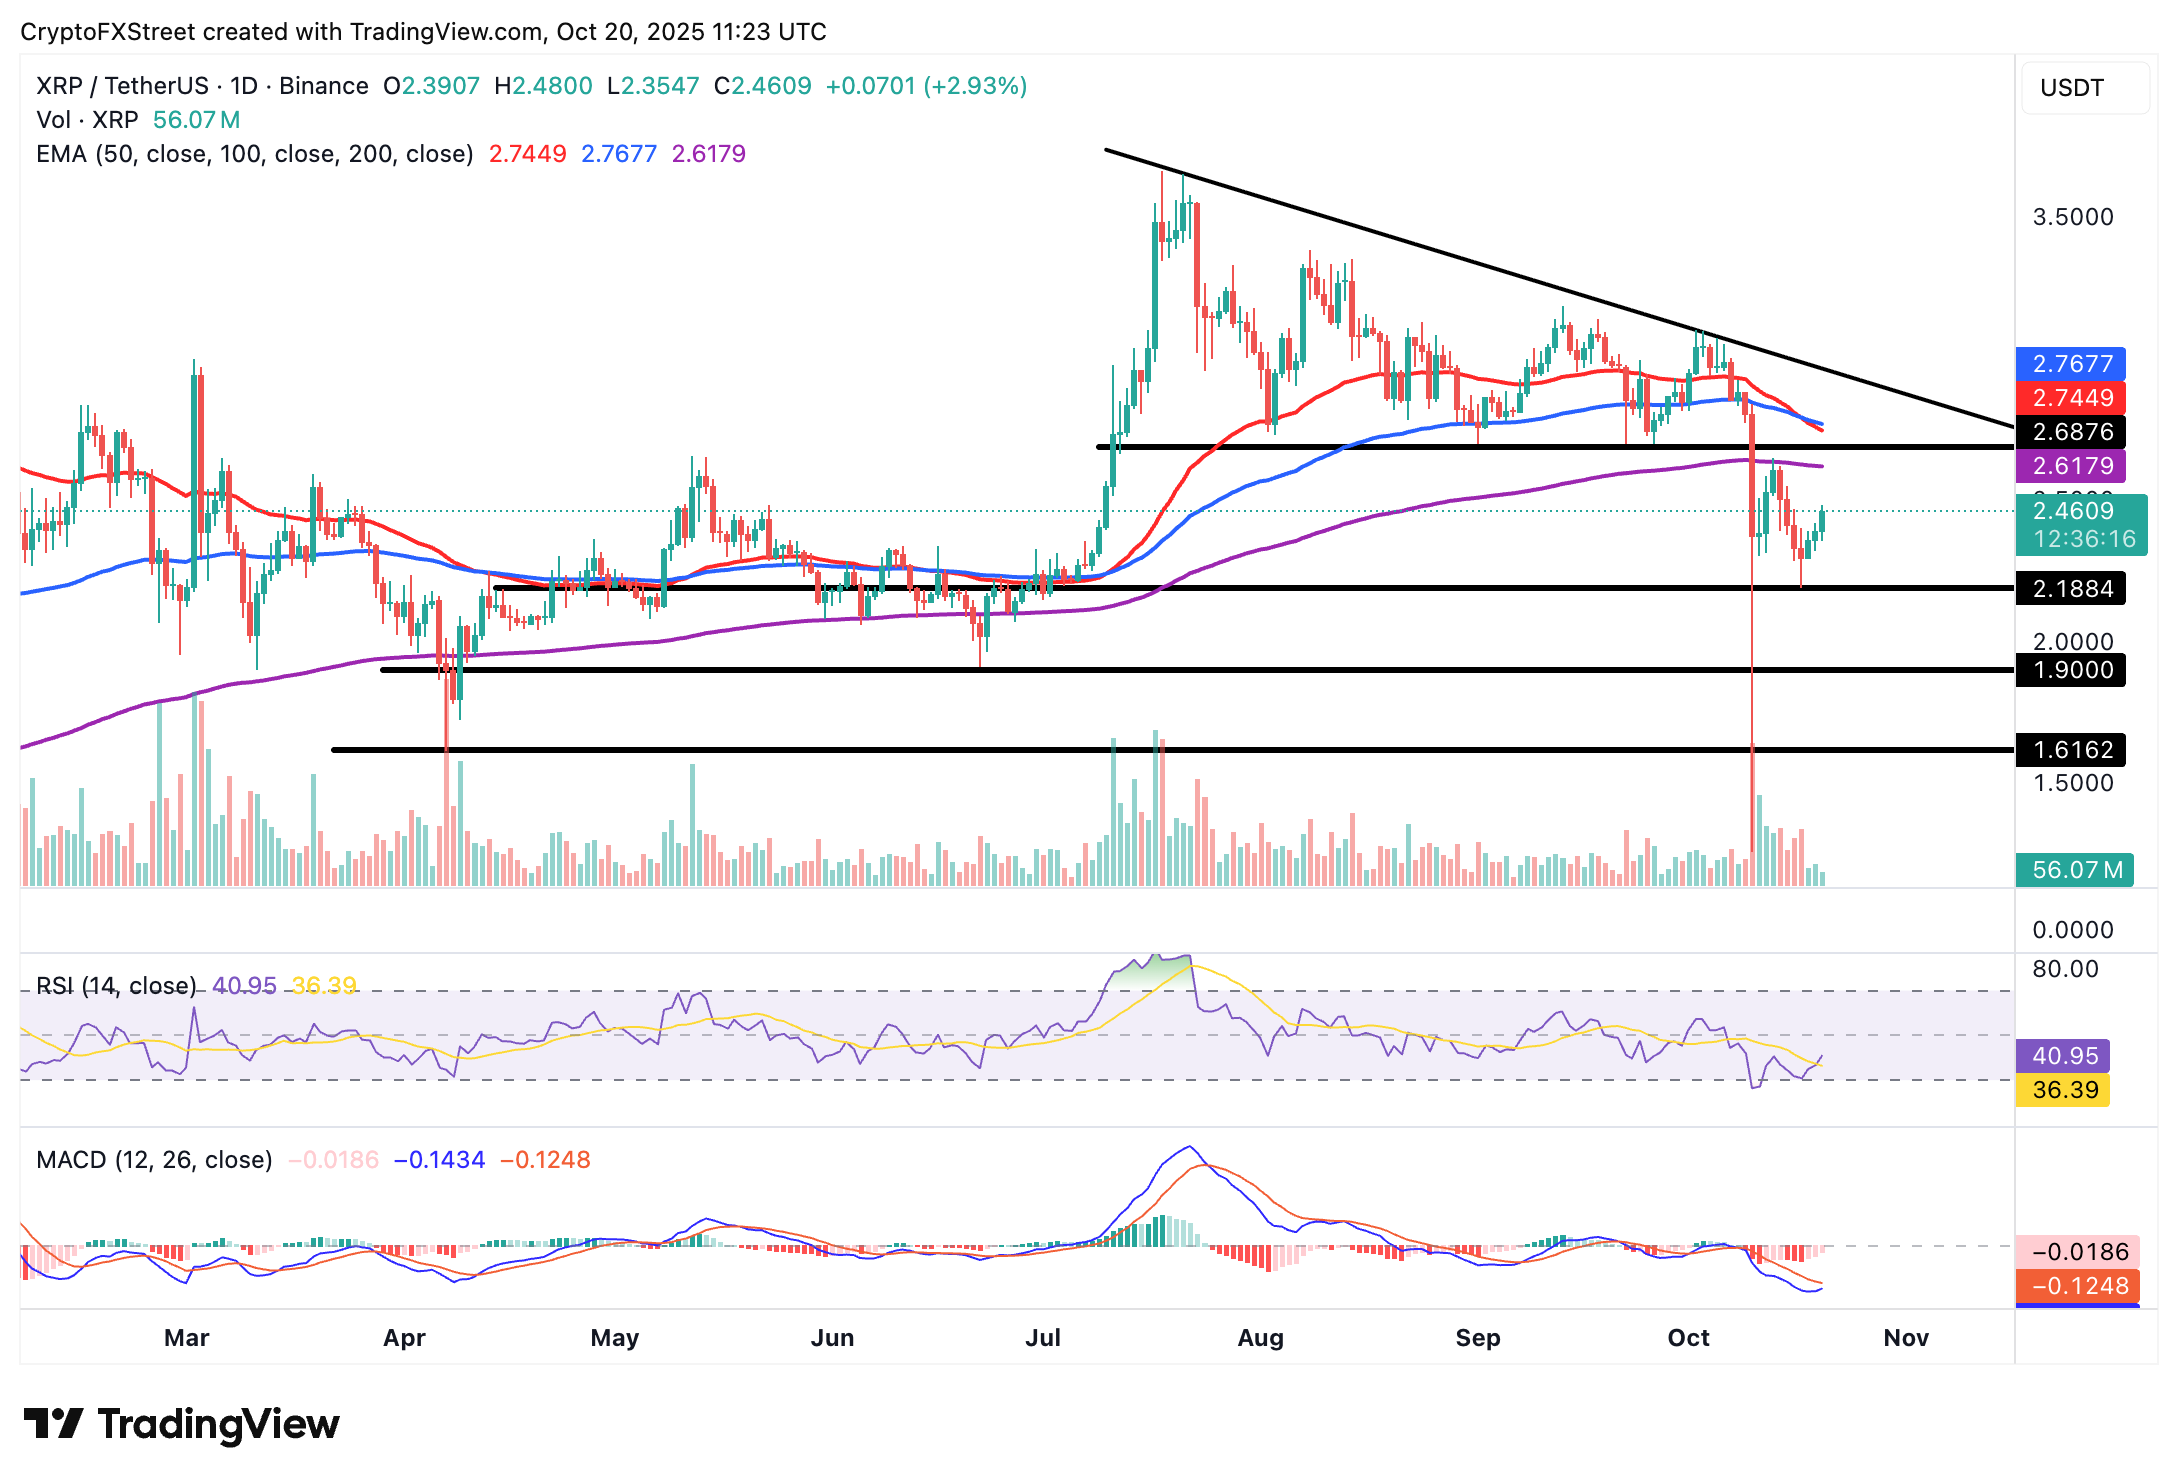
XRP/USDT daily chart
Still, traders should not ignore a recently confirmed Death Cross pattern on the same daily chart. This is a bearish pattern that forms when a shorter-term moving average crosses below the longer-term moving average.
The 50-day EMA is currently below the 100-day EMA, highlighting risk-off sentiment. Traders should keep an eye on the demand at $2.18, tested on Friday, and $1.90 tested in June, which could absorb selling pressure if shorts book early profits.
Open Interest, funding rate FAQs
Higher Open Interest is associated with higher liquidity and new capital inflow to the market. This is considered the equivalent of increase in efficiency and the ongoing trend continues. When Open Interest decreases, it is considered a sign of liquidation in the market, investors are leaving and the overall demand for an asset is on a decline, fueling a bearish sentiment among investors.
Funding fees bridge the difference between spot prices and prices of futures contracts of an asset by increasing liquidation risks faced by traders. A consistently high and positive funding rate implies there is a bullish sentiment among market participants and there is an expectation of a price hike. A consistently negative funding rate for an asset implies a bearish sentiment, indicating that traders expect the cryptocurrency’s price to fall and a bearish trend reversal is likely to occur.
Recommended Articles


