
Top Crypto Gainers: Zcash surpasses $200, Litecoin and MYX Finance gain momentum
- Zcash extends its rally above $200 as bullish momentum holds.
- Litecoin bounces off a key support, with bulls eyeing a technical breakout.
- MYX Finance edges higher in a consolidation zone, holding above a key support level.
Zcash (ZEC), Litecoin (LTC), and MYX Finance (MYX) emerge as top performers over the last 24 hours. Meanwhile, the broader cryptocurrency market remains under pressure, with Bitcoin (BTC) trading below $122,000 and total crypto market liquidations crossing $600 million during the same period.
The privacy coin rally exceeds $200, and Litecoin’s network growth could fuel the uptrend. At the same time, MYX stays on the edge, risking a bearish reversal.
Zcash rally holds steady above $200
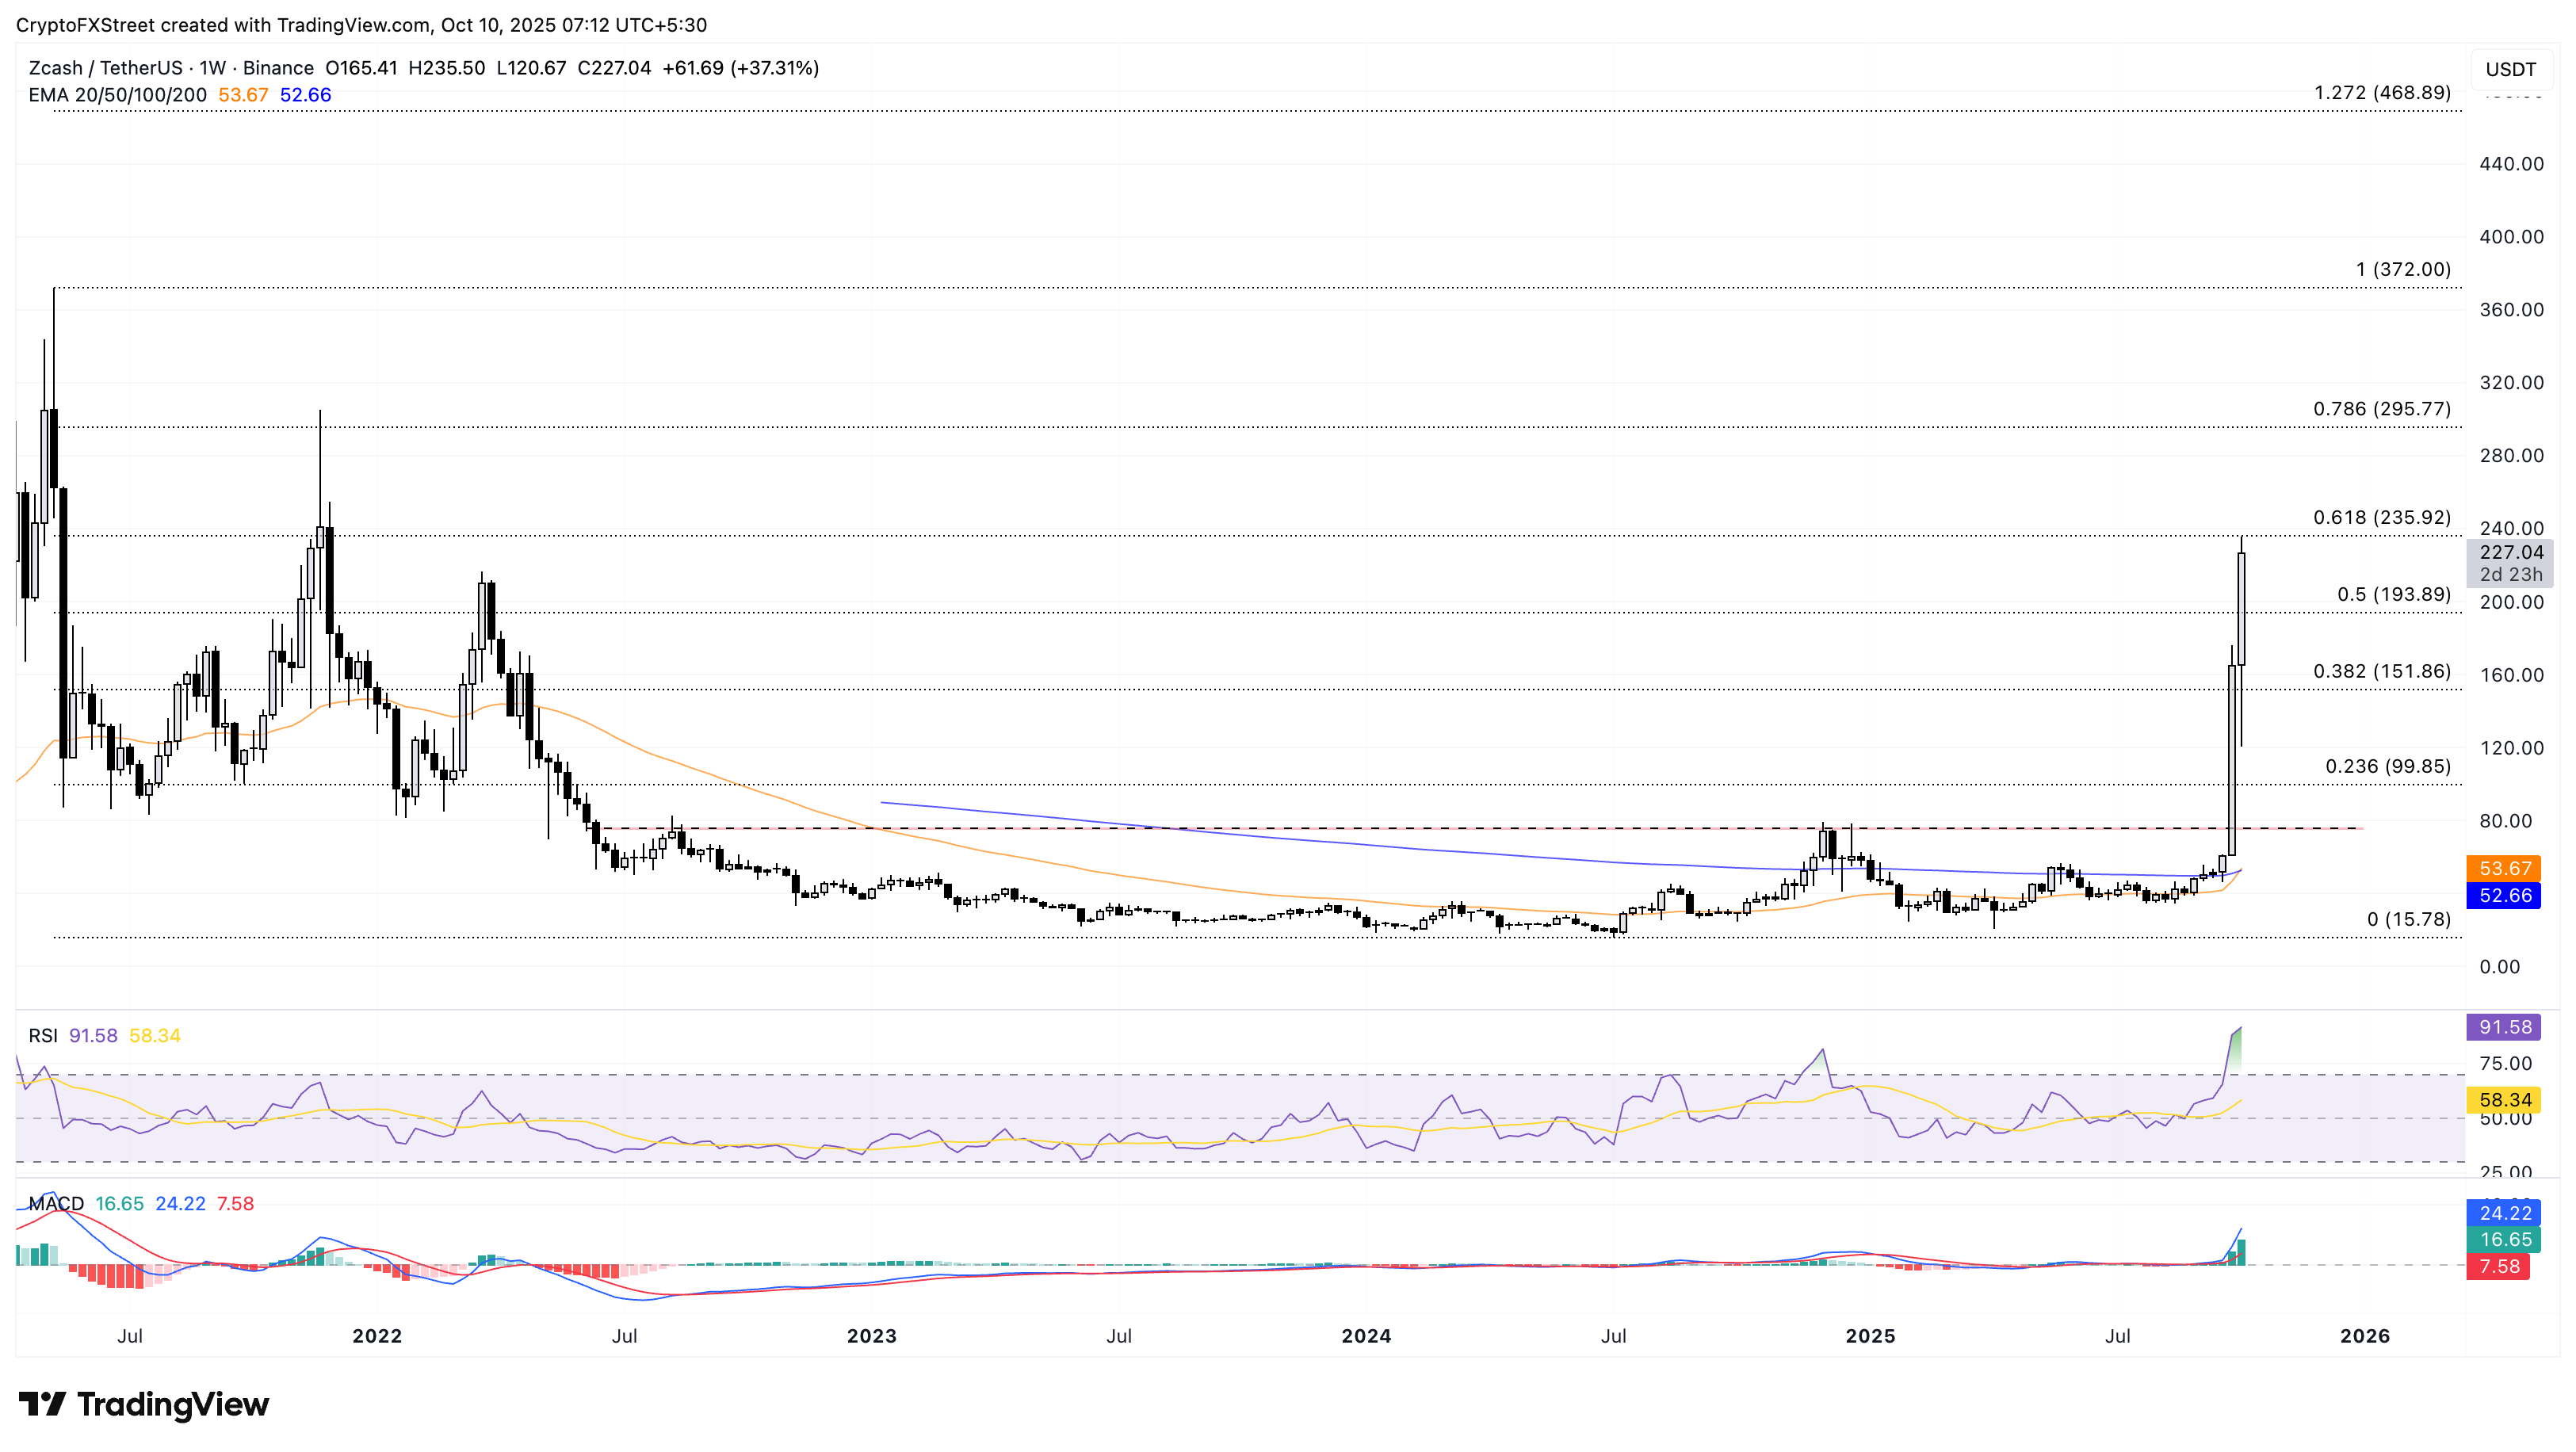
Zcash trades above $225 at press time on Friday, recording over 35% gains so far this week. The third consecutive week of profits challenges the 61.8% Fibonacci retracement level at $235.92, drawn from the May 2021 high at $372.00 to the July 2024 low at $15.78 on the weekly chart.
A decisive push above this level could extend the rally to the $295 mark, aligning with the 78.6% Fibonacci retracement level.
The Relative Strength Index (RSI) reads 91 on the weekly chart, suggesting that the ZEC rally is overheated and bears the risk of a potential reversal. Additionally, the Moving Average Convergence Divergence (MACD) holds a steady upward trend, indicating the rising buying pressure.
ZEC/USDT daily price chart.
If the ZEC rally flips from $235.92, it could retest the 50% retracement level at $193.89.
Litecoin rally outpaces on-chain usage
Litecoin edges higher by over 2% at the time of writing on Friday, adding gains on the 6% rise from the previous day. The sudden recovery outpaced the network activity, as indicated by the network value to transactions (NVT) ratio.
Santiment data shows that the NVT is at 10.26, up from 0.66 on Thursday, while transaction volume holds steady. Typically, a rise in NVT outpacing the on-chain usage indicates a speculation-driven price surge.
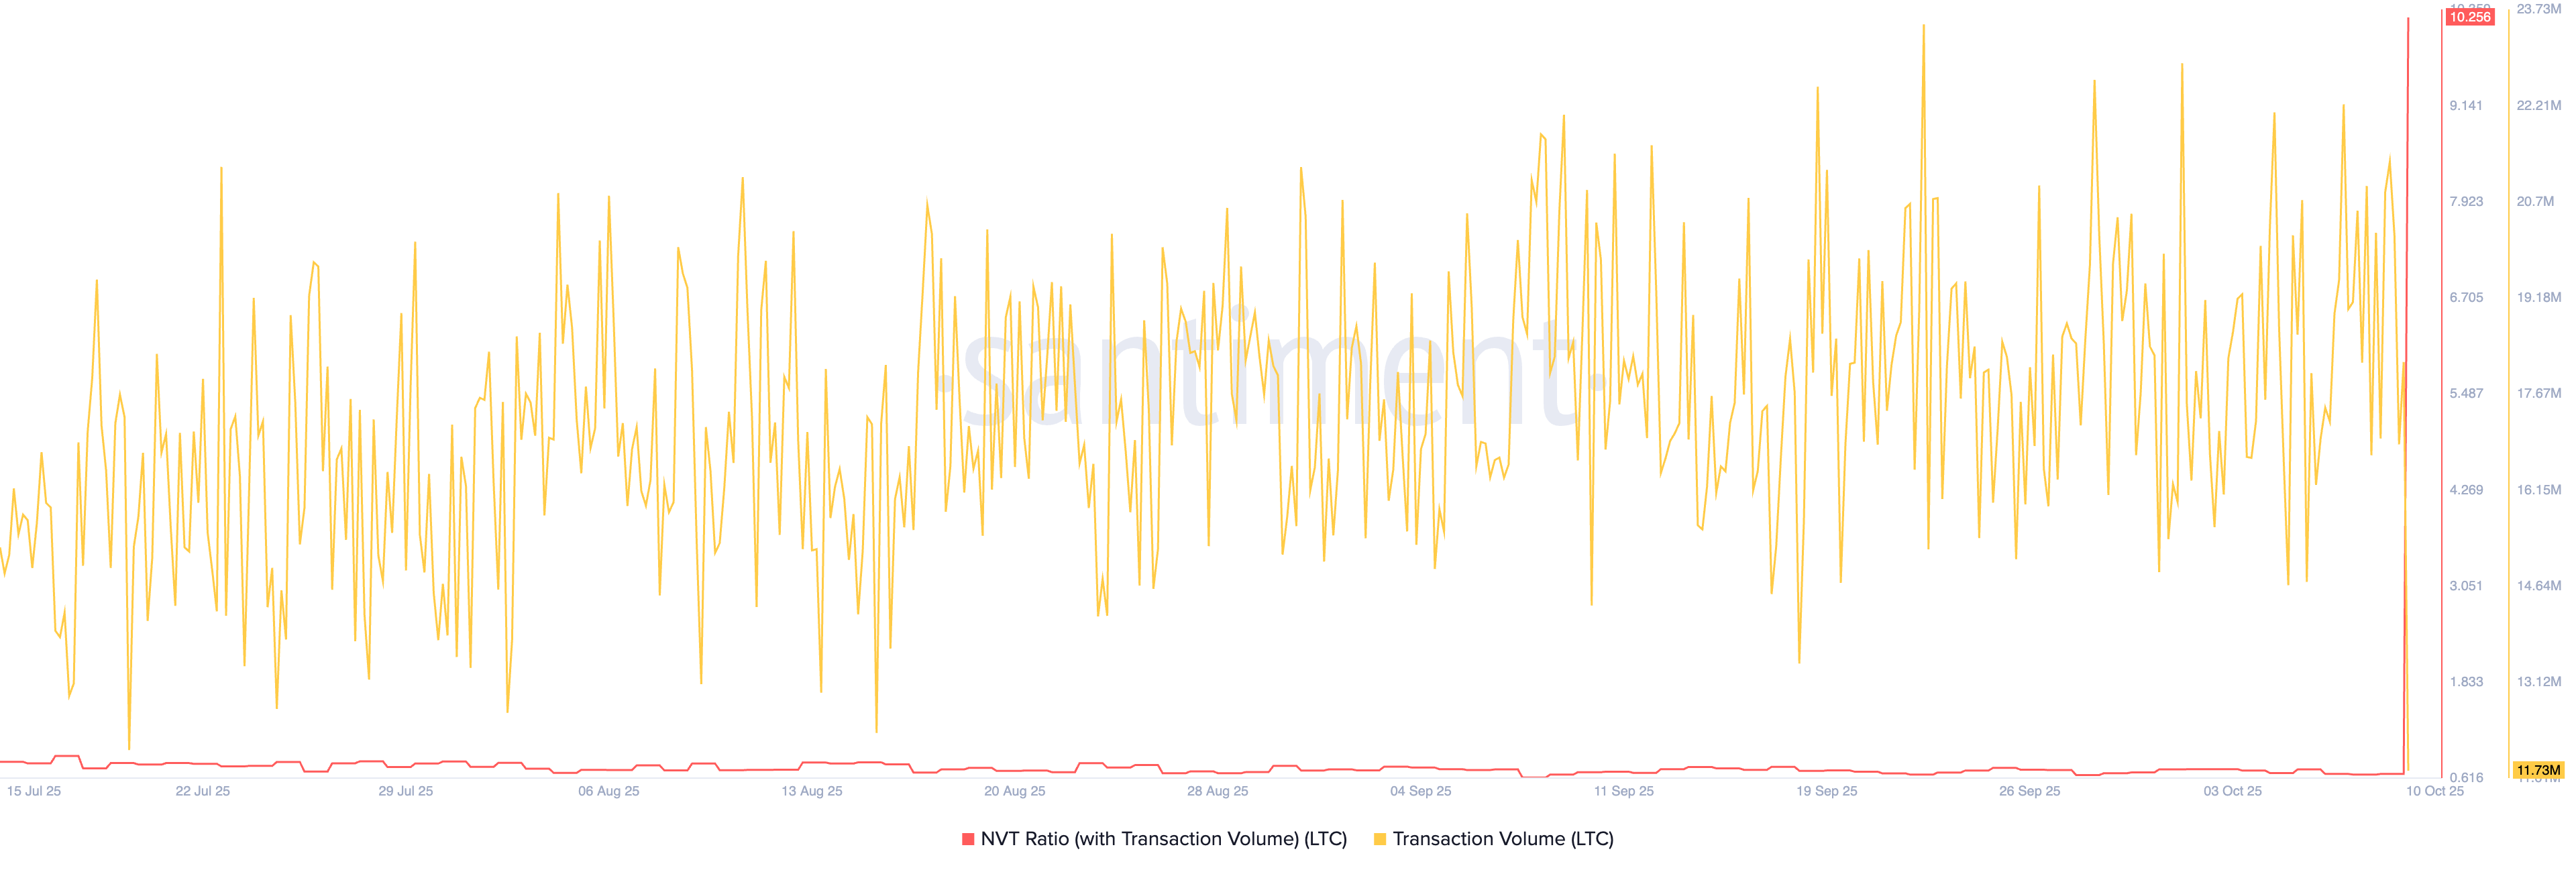
Litecoin NVT ratio. Source: Santiment.
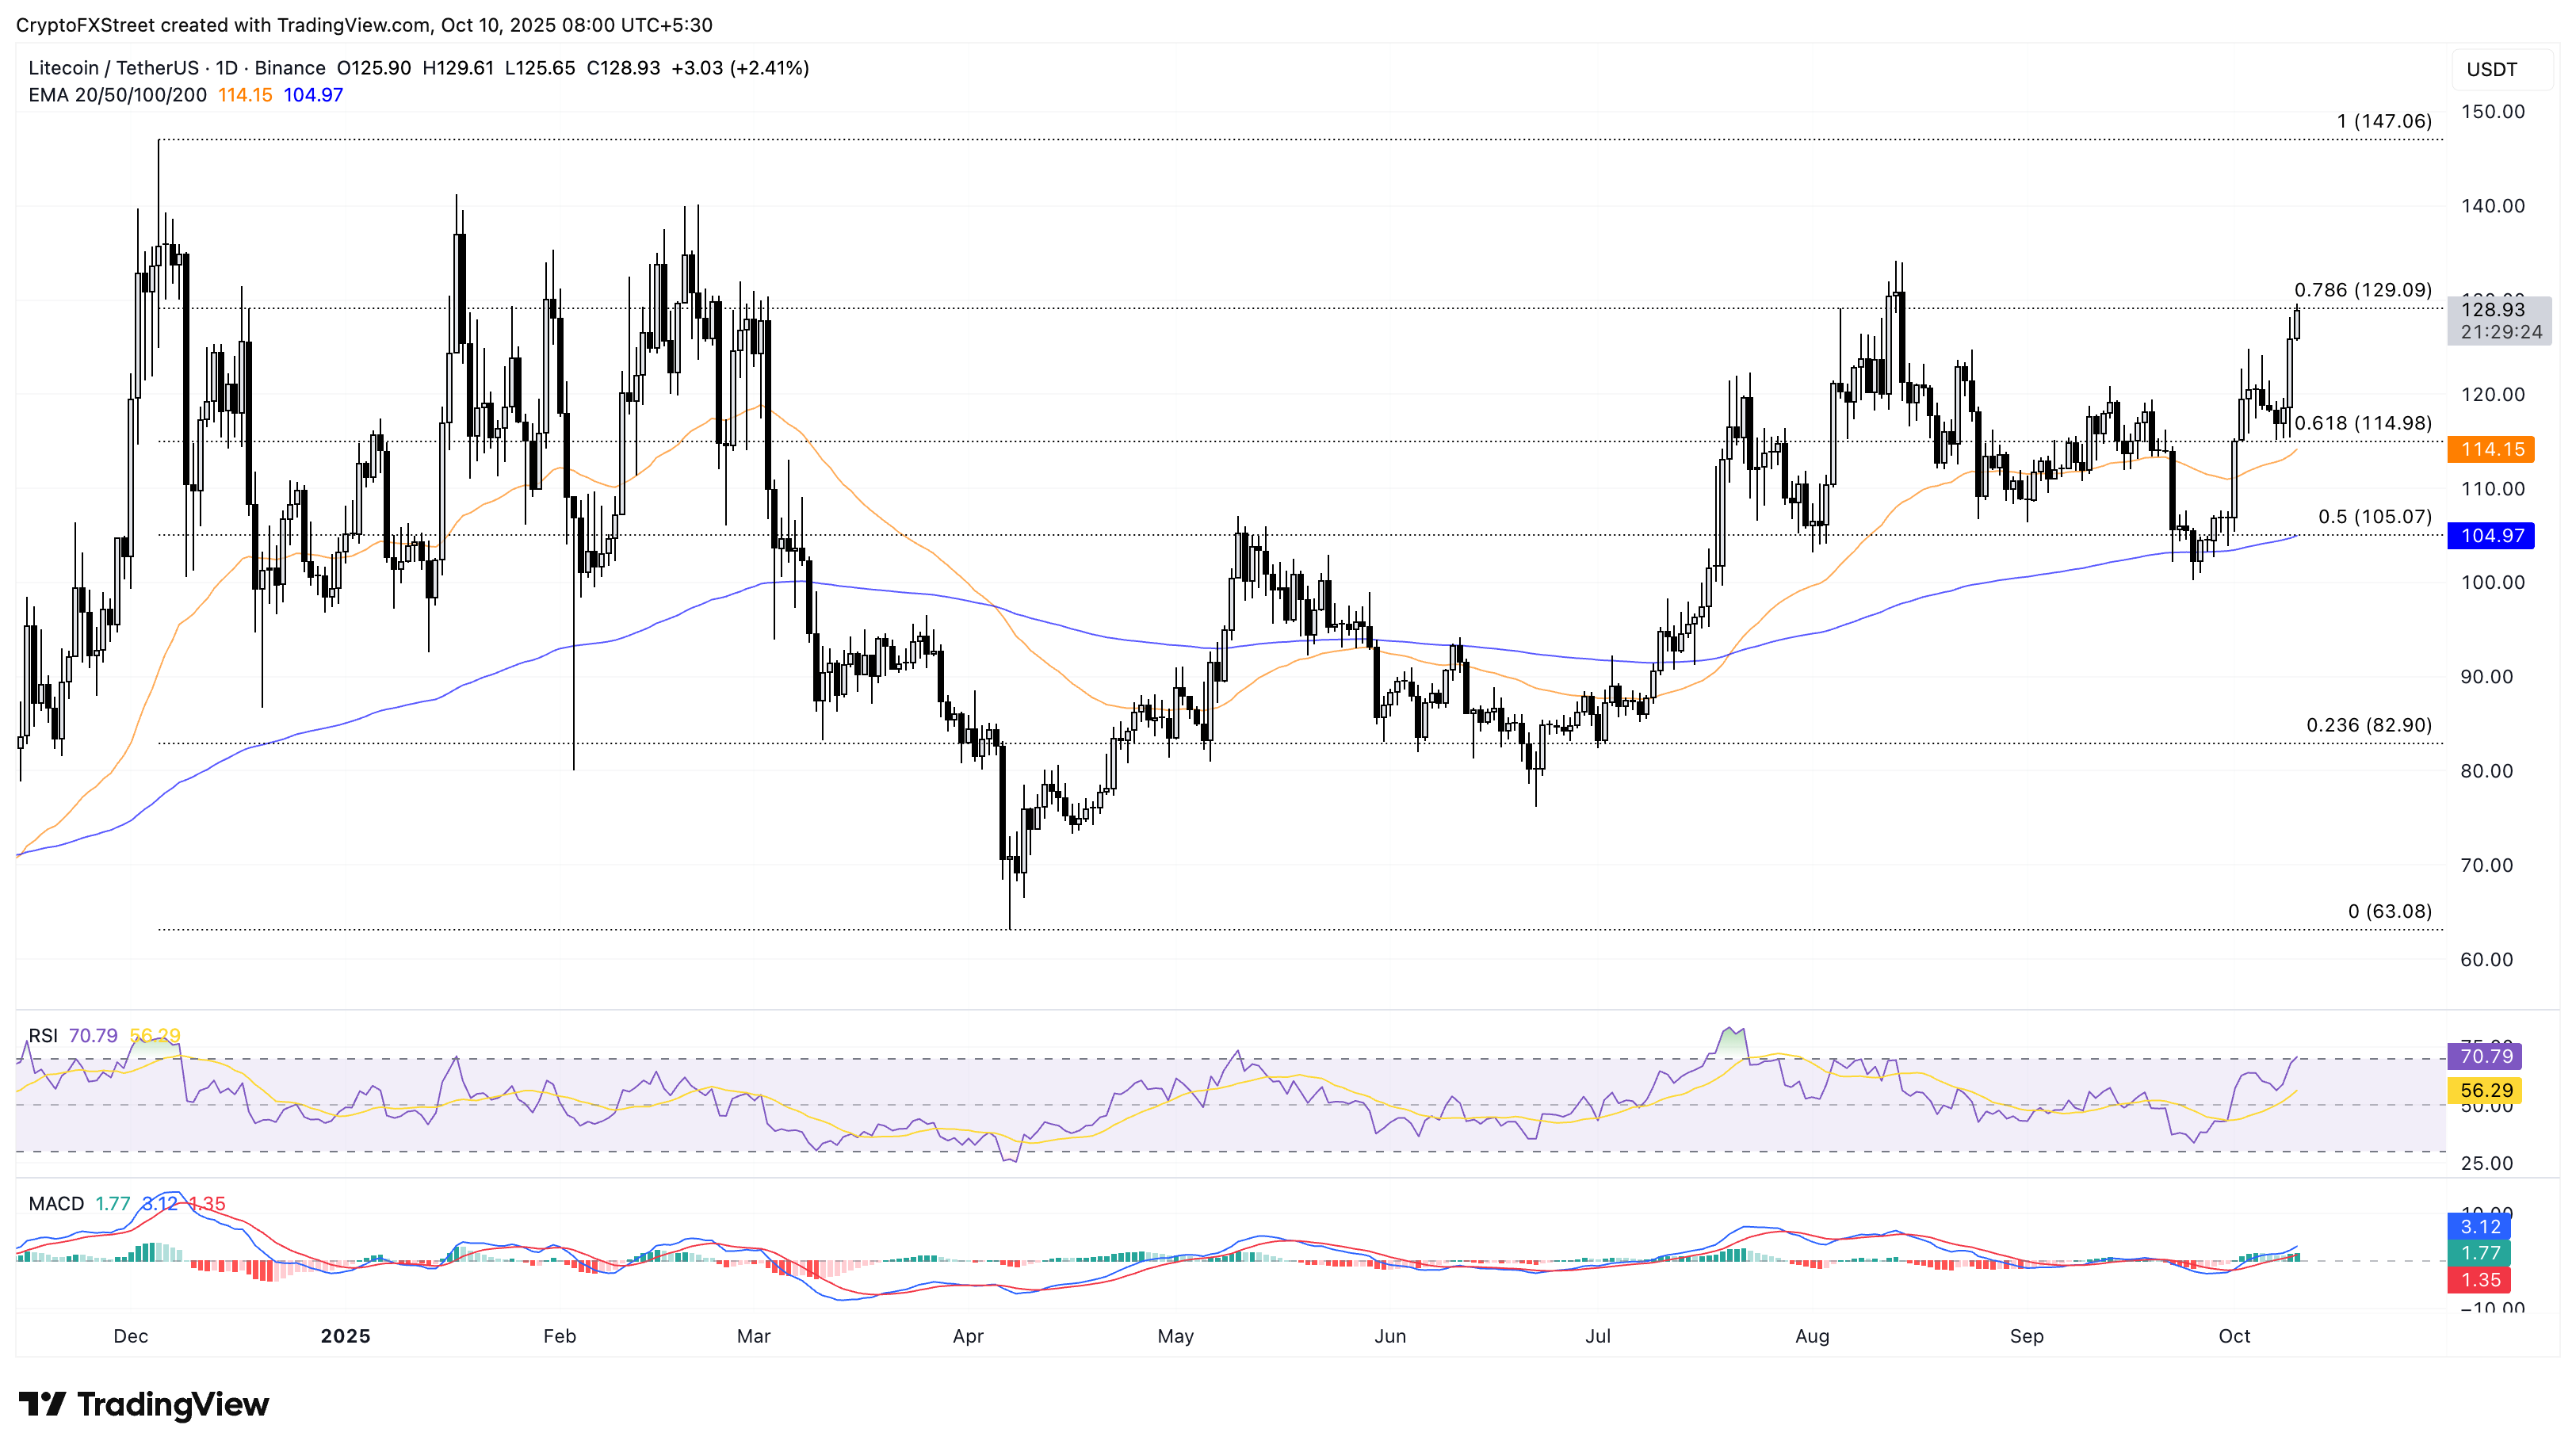
Advancing the uptrend for the third consecutive day, Litecoin challenges the 78.6% Fibonacci retracement level at $129.09, retraced from the $147.06 peak of December 5 to the $63.08 low of April 7.
A daily close above this level could confirm the technical breakout, potentially extending the rally to the $147.06 peak.
The RSI is at 70, inching closer to the overbought zone, indicating elevated buying pressure. At the same time, the MACD and its signal line extend a steady uptrend above the zero line, indicating a consistent increase in bullish momentum.
LTC/USDT daily price chart.
Looking down, a reversal from $129.09 could threaten the 61.8% Fibonacci retracement level at $114.98.
MYX Finance regains strength in a consolidation
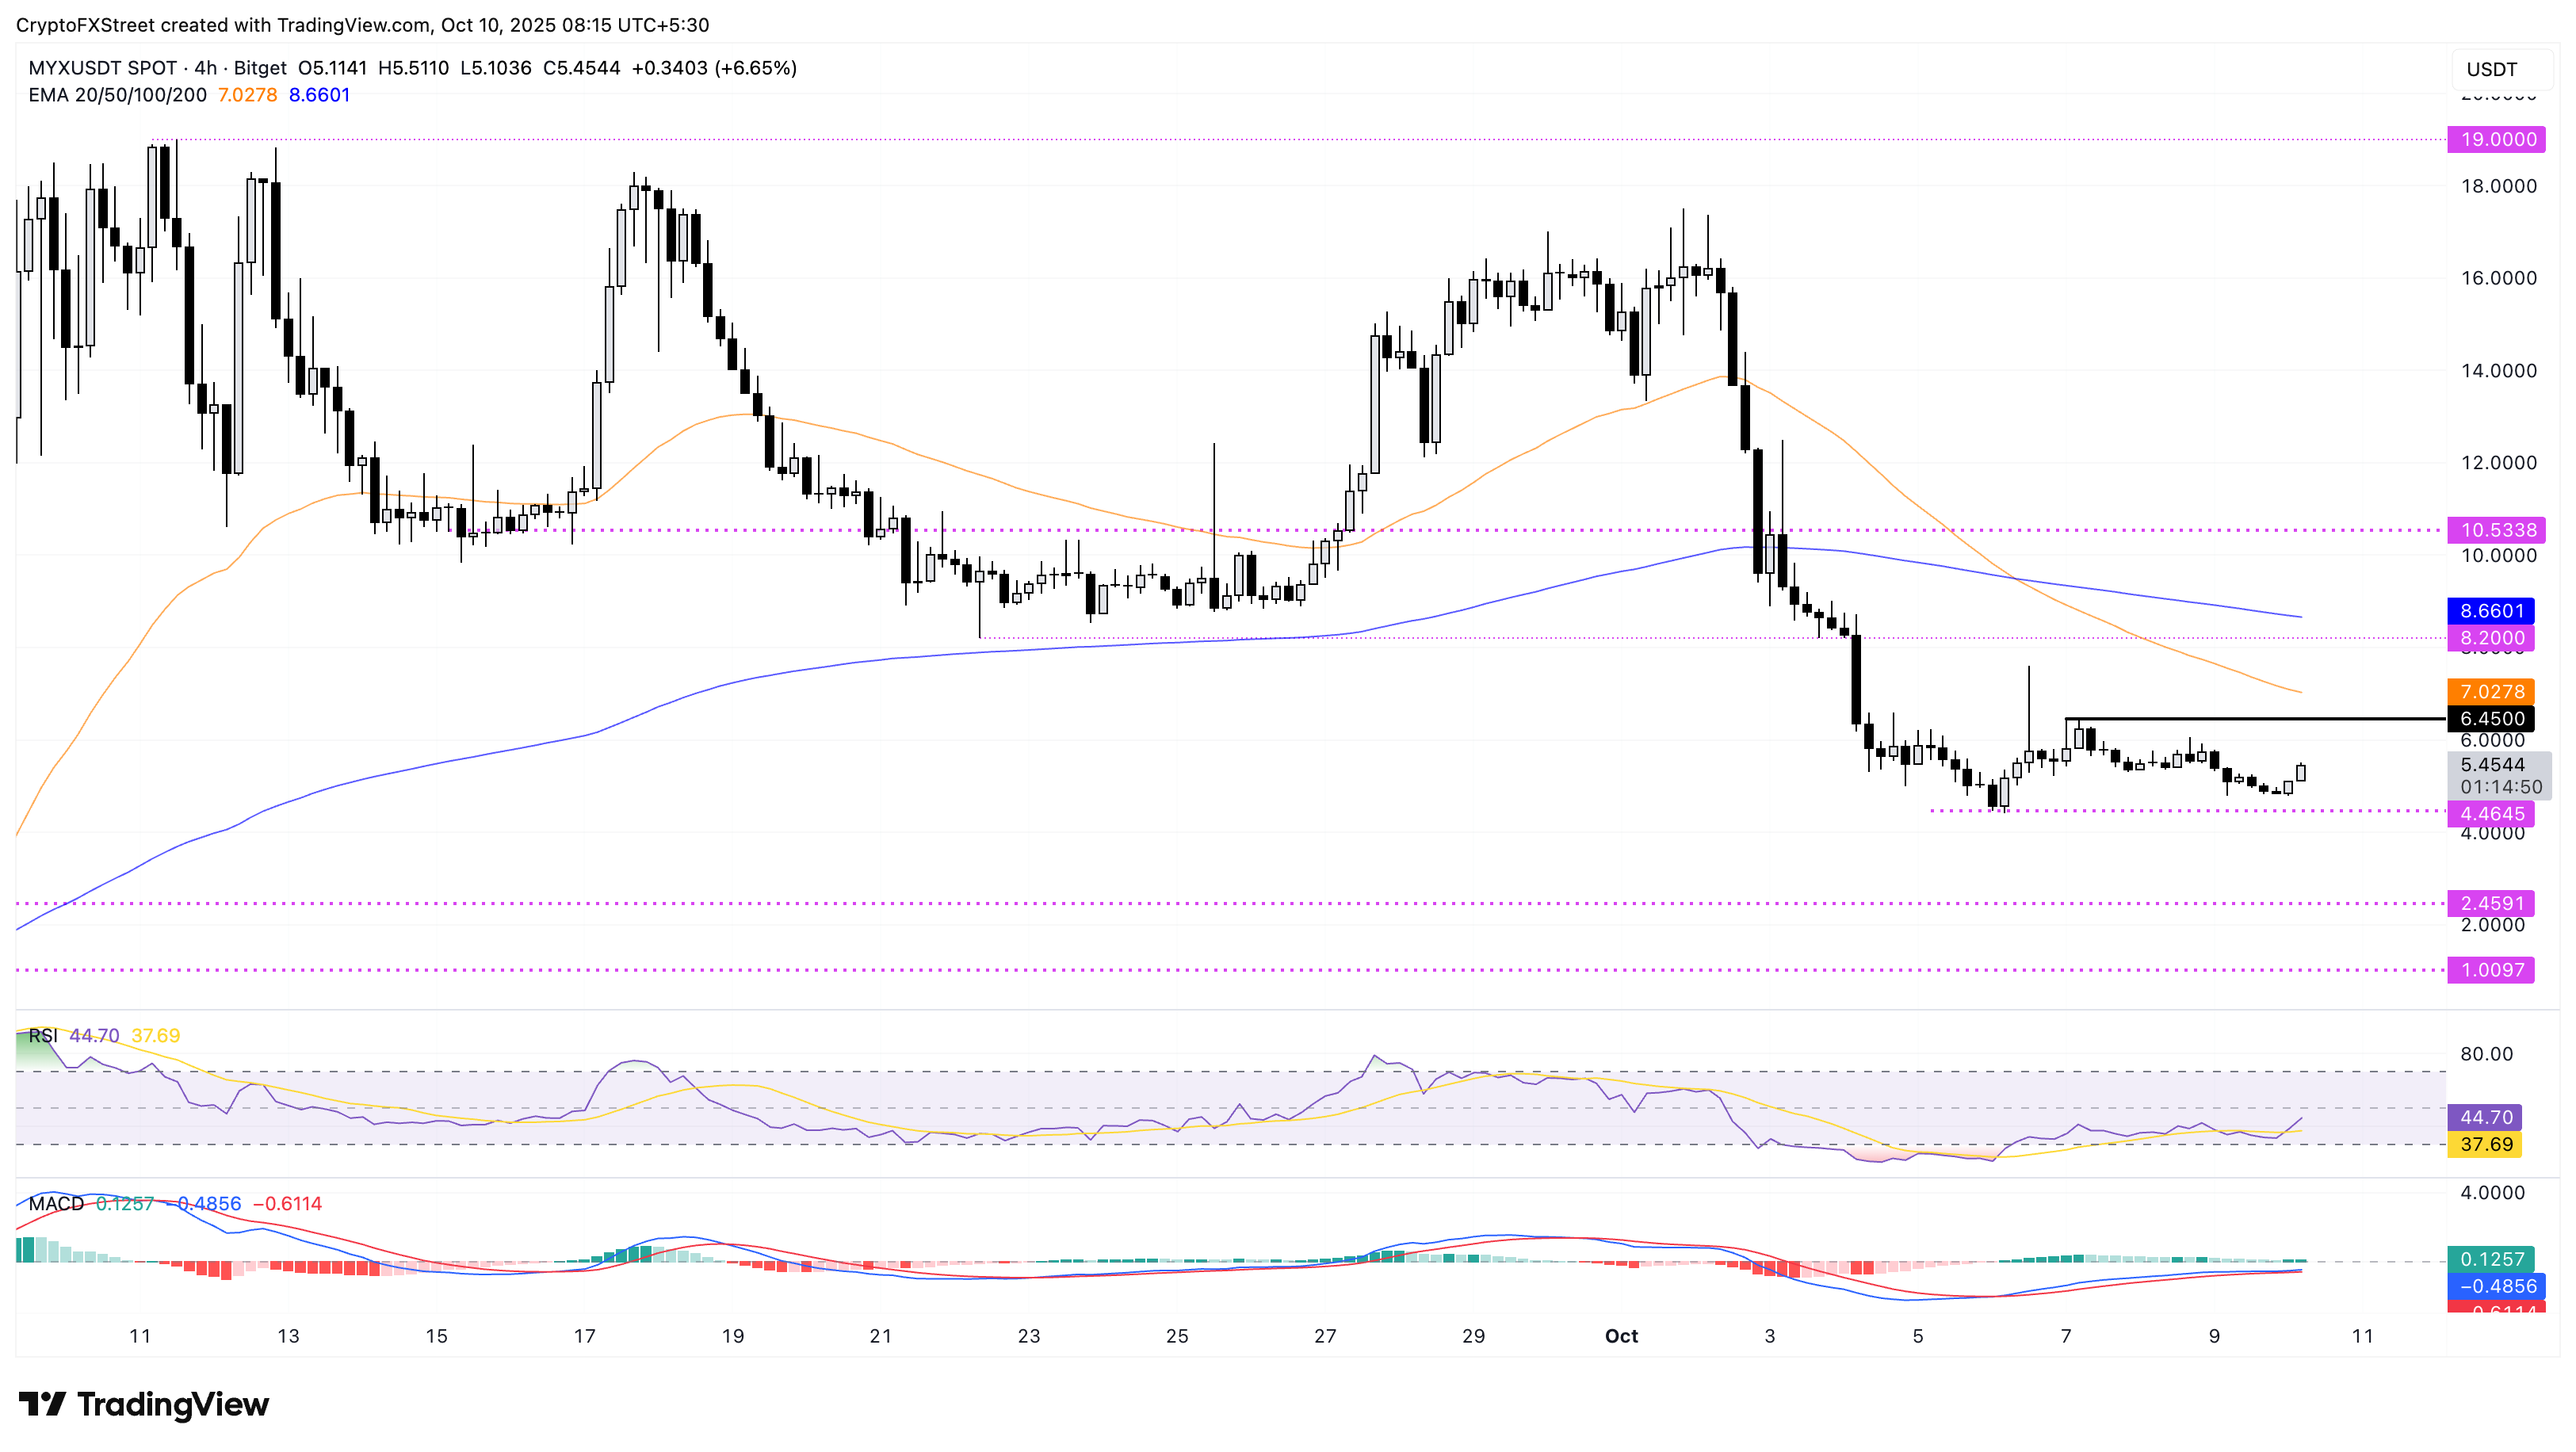
MYX Finance ticks higher by 6% at press time on Friday after three consecutive days of losses. The recovery in MYX stems from above the $4.4645 low of Monday, extending the consolidation range with the upper ceiling at $6.4500.
If MYX exceeds the $6.4500 level, it could face resistance at the 50-period Exponential Moving Average (EMA) at $7.0278 or the $8.200 low from September 23.
The RSI slopes upwards to 44, rising from the oversold zone, which indicates a significant recovery in buying pressure. Still, the close moving MACD and its signal line indicate an upward trend with a potential crossover, which would signal a bearish flip in momentum.
MYX/USDT 4-hour price chart.
On the downside, if MYX slips below $4.4645, it could extend the downfall to the $2.4591 level marked by the August 17 high.
Recommended Articles


