
Avalanche Price Forecast: AVAX eyes further gains on $1 billion ecosystem treasury plan
- Avalanche holds above $30, bouncing off its 200-week EMA.
- Avalanche Treasury Company partners with Mountain Lake Acquisition Corporation for a $1 billion ecosystem treasury.
- A steady rise in monthly DEX volume, exceeding $17 billion in September, indicates network growth.
The Avalanche (AVAX) price is up 1% at press time on Thursday, extending the 2% gains from the previous day, which were driven by a $1 billion ecosystem treasury plan. The technical outlook remains optimistic as both derivatives and on-chain data suggest an increase in traders’ and users’ interest.
The $1 billion Avalanche ecosystem treasury plan
Avalanche Treasury Company (AVAT) announced a business combination valued at over $675 million with Nasdaq-listed Mountain Lake Acquisition Corporation (MLAC). The deal includes $460 million in treasury assets and establishes a public financial vehicle for AVAX.
AVAT’s goal behind the deal is to own over $1 billion of AVAX, fueled by the Avalanche Foundation’s nod to acquire tokens at a discount price and an 18-month priority on sales. This treasury plan showcases the company’s confidence in the Avalanche ecosystem, lifting investors' spirits.
CoinGlass data shows that the AVAX Open Interest (OI) stands at $1.62 billion on Thursday, up from $1.45 billion on Wednesday. This inflow of cash into AVAX derivatives indicates a risk-on sentiment among investors.
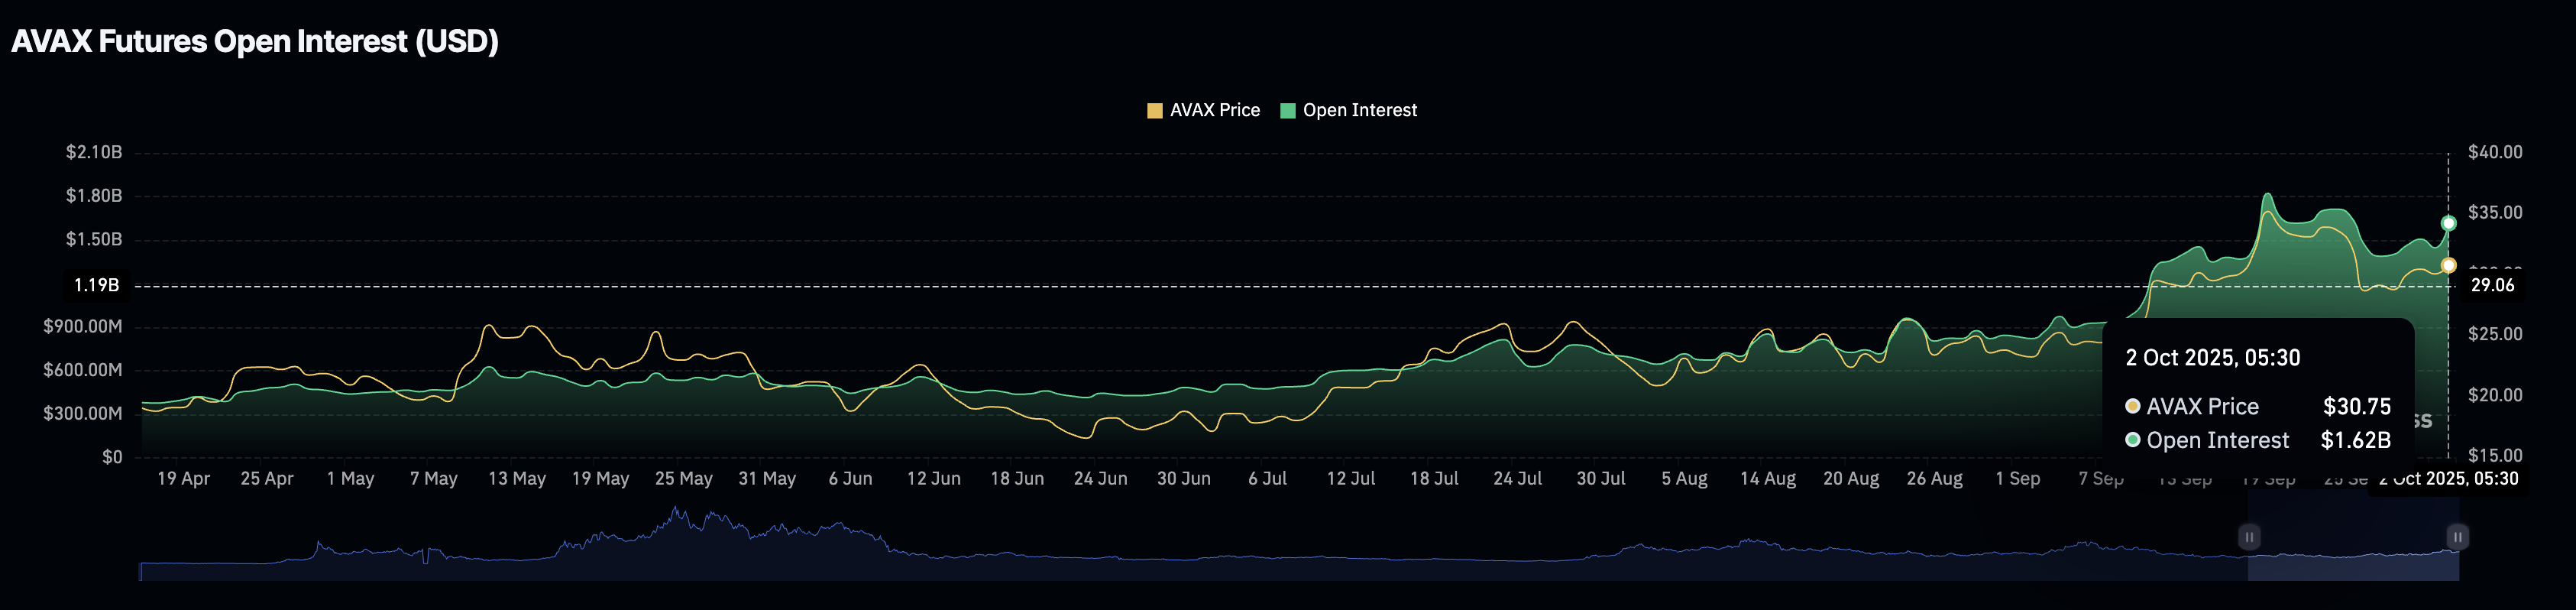
AVAX Open Interest. Source: CoinGlass
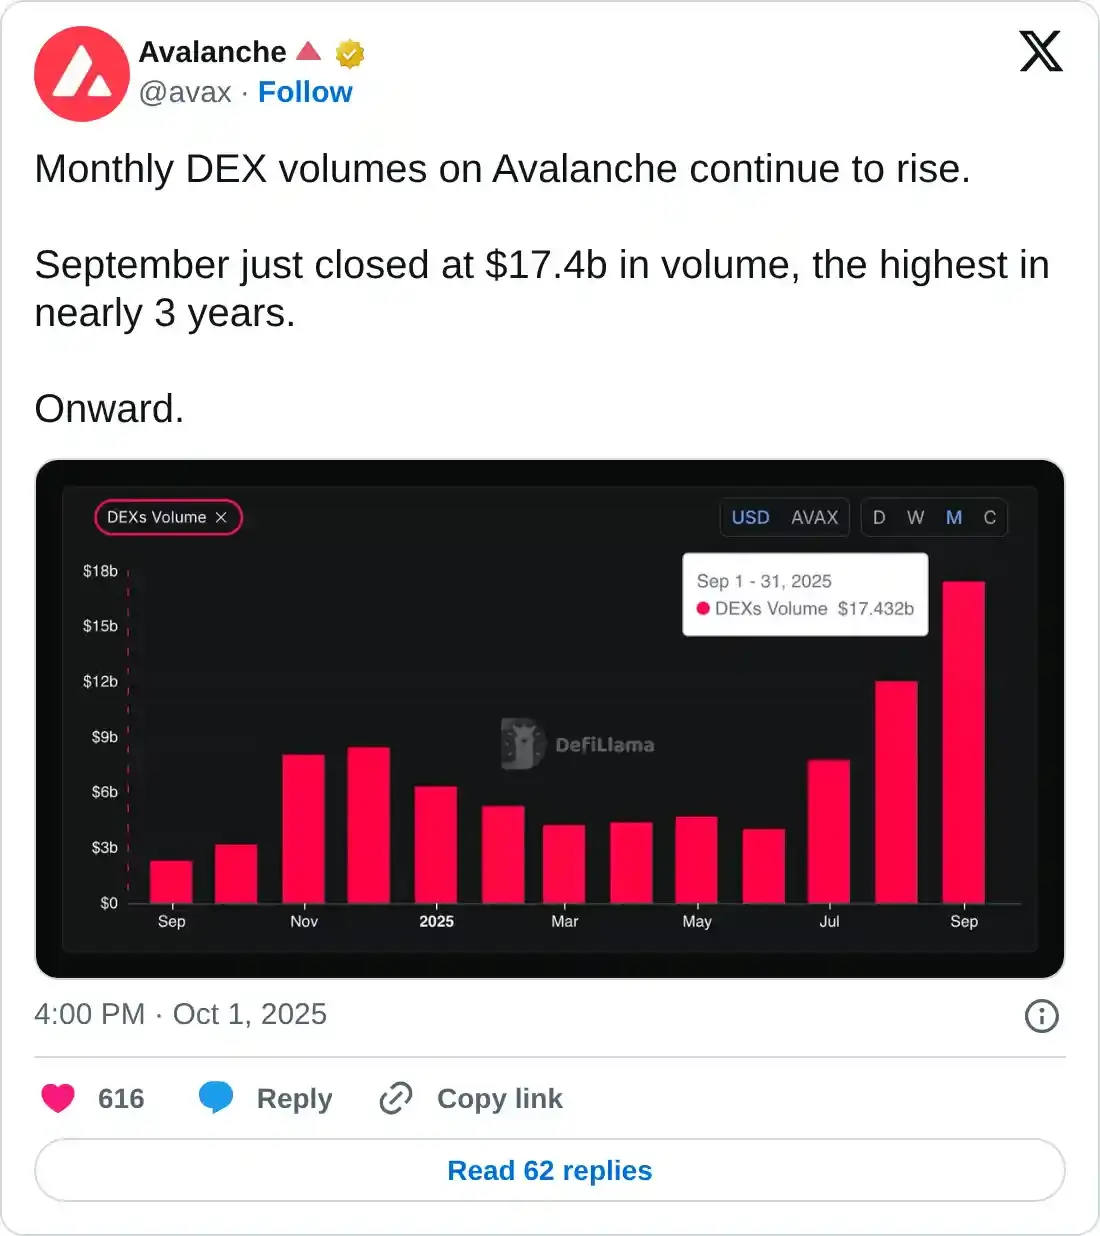
Avalanche DEX volume holds a steady rise
Avalanche announced a significant rise in the monthly Decentralized Exchange (DEX) trading volume, reaching $17.432 billion in September. This marks the highest recorded DEX volume in nearly three years, indicating growth in liquidity and user adoption.
AVAX extends the price movement in a range
Avalanche trades above the $30 mark at the time of writing on Thursday, bouncing off its 200-week Exponential Moving Average (EMA) at $29.08. The minor recovery so far this week extends the AVAX price movement between the 50% and 61.8% Fibonacci retracement levels at $28.60 and $33.48, respectively. This Fibonacci retracement spans the range from the $55.79 high on December 4 to the $14.66 low on April 7.
If the recovery extends for a decisive close above $33.48, AVAX could advance towards $41.91.
The technical indicators on the weekly chart suggest a bullish view as the Relative Strength Index (RSI) at 58 slopes upwards from the halfway line with room for further growth before reaching the overbought zone. Additionally, the Moving Average Convergence Divergence (MACD) indicator displays a rise in bullish momentum as the average line points upwards into positive territory.
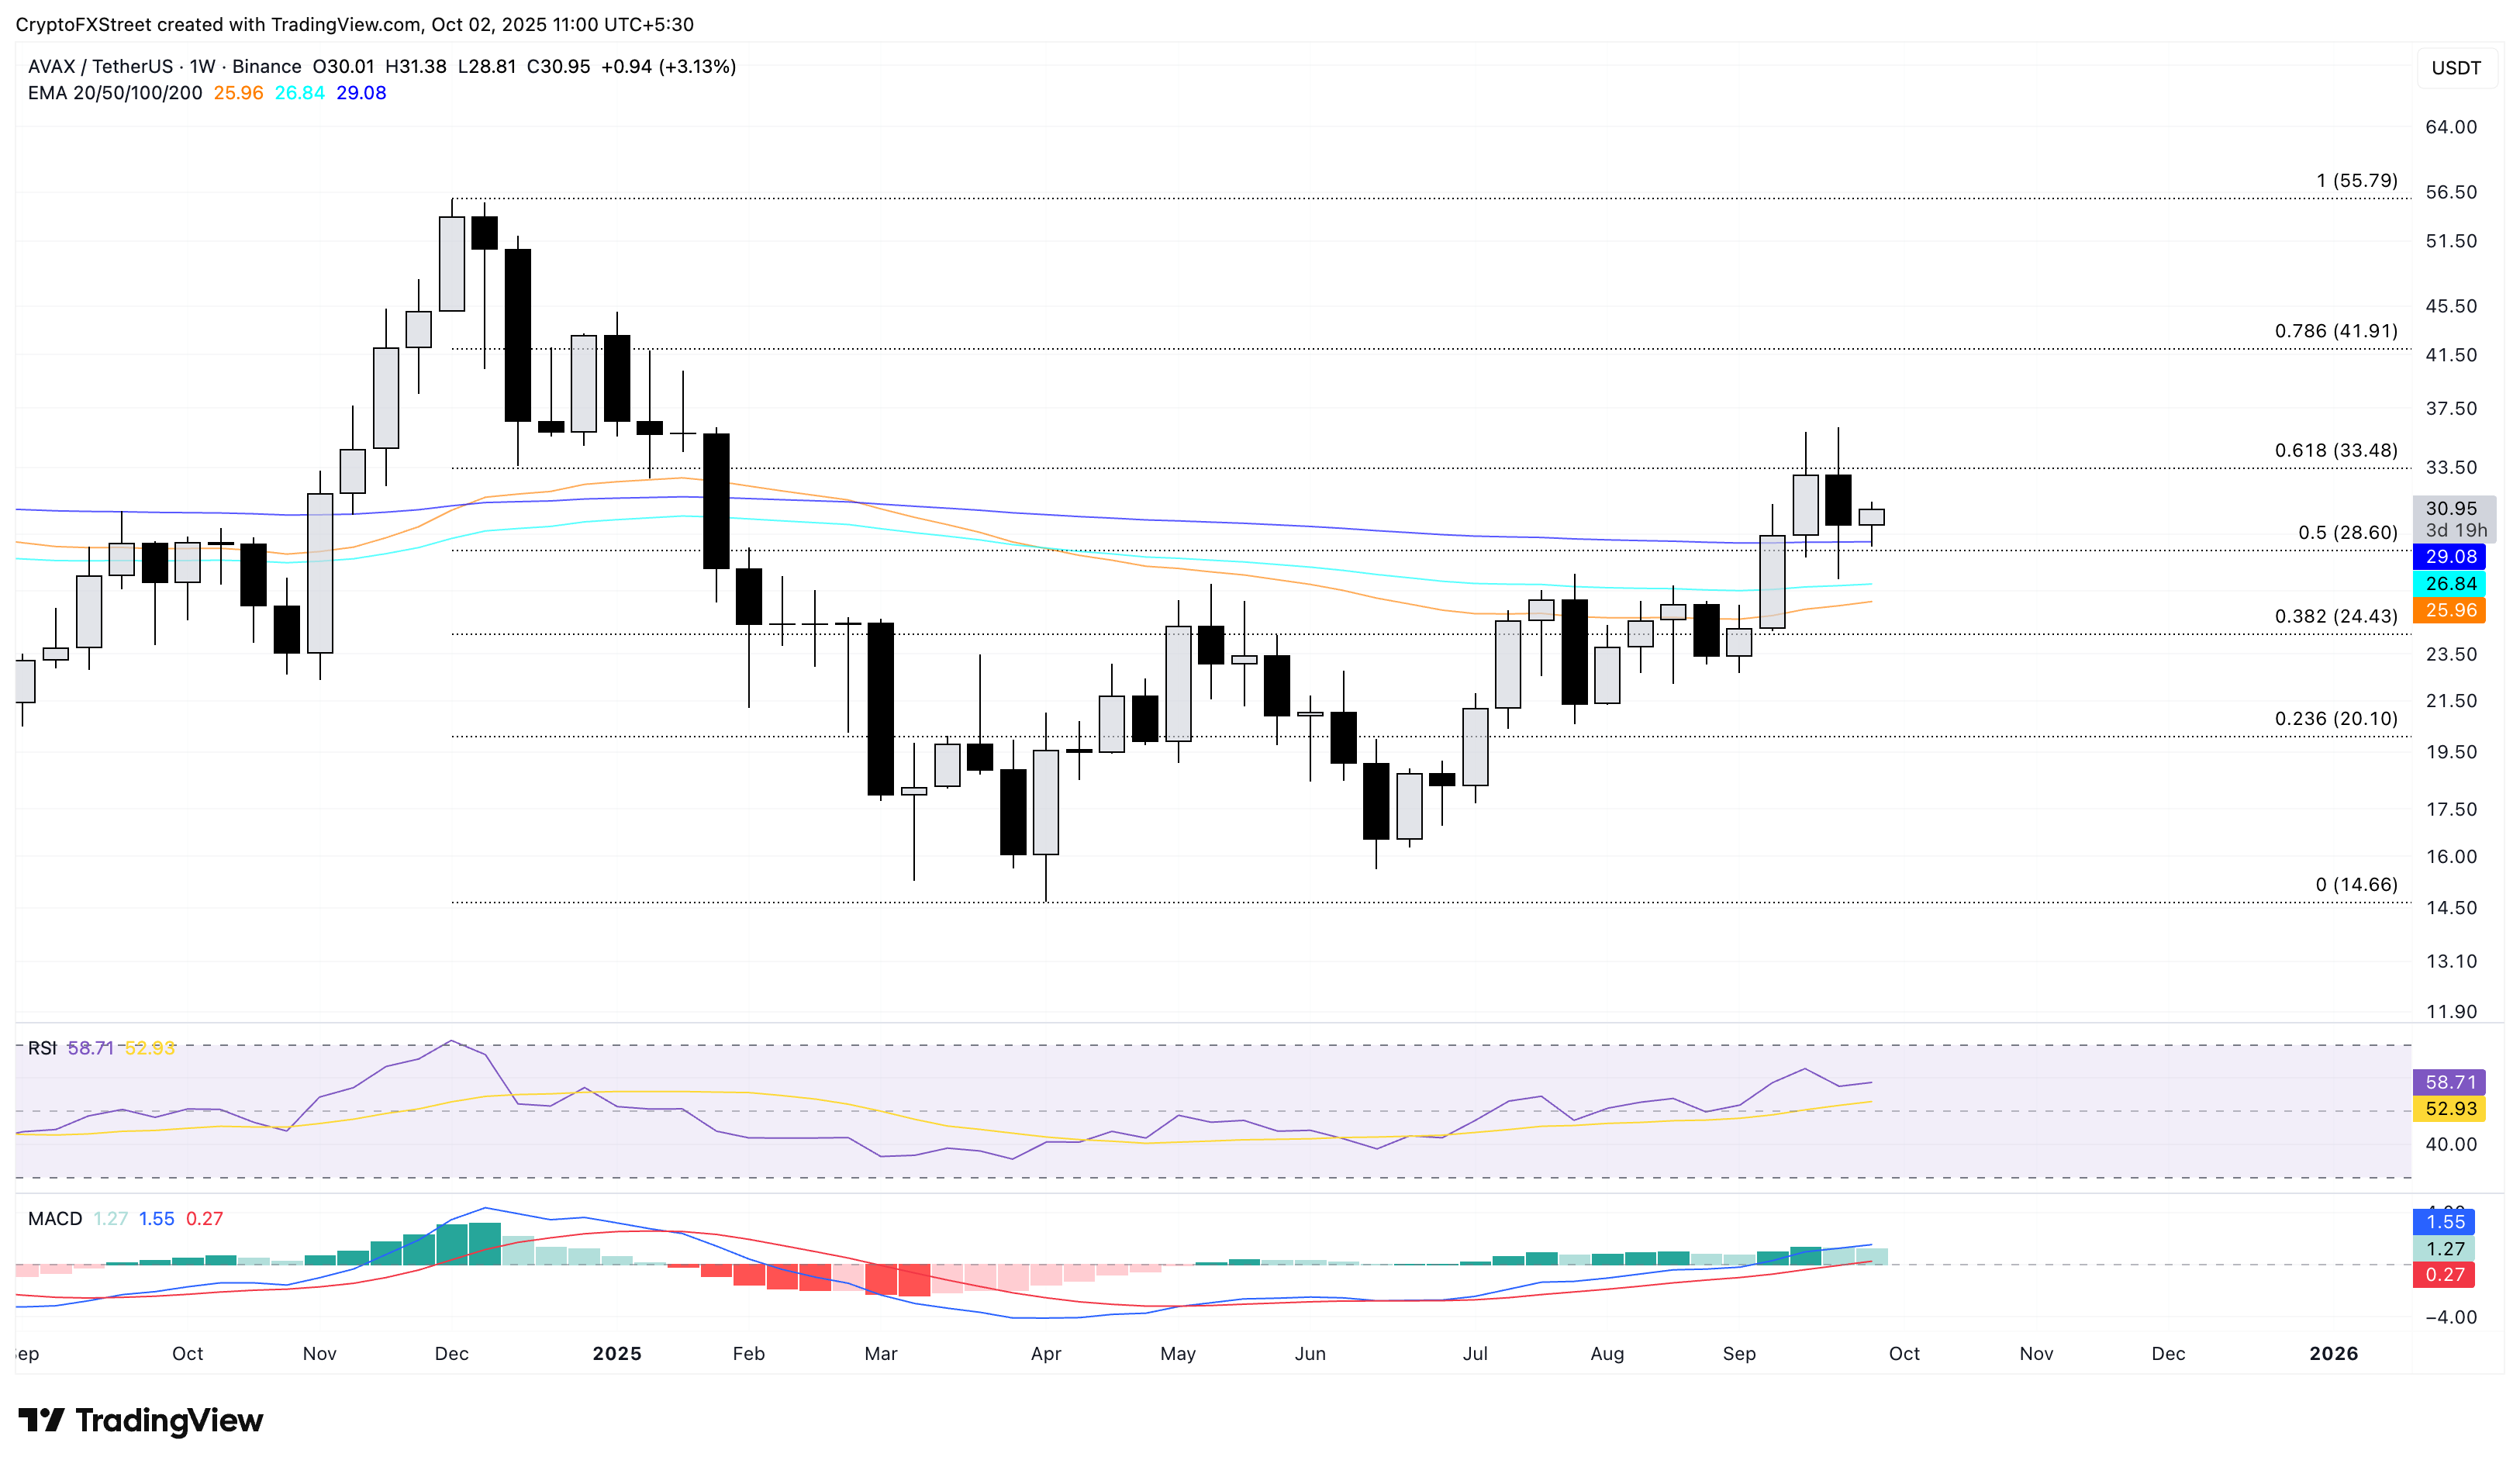
AVAX/USDT daily price chart.
Looking down, a potential reversal below $28.60 could test the 38.2% Fibonacci retracement level at $24.43.
Recommended Articles


