

Top Crypto Gainers: Pump.fun, Zcash, Aptos recover on partnerships and buyback
- Pump.fun’s rebound holds above $0.006000, with bulls eyeing further breakout gains.
- Zcash rally nears its 52-week high as bullish momentum holds.
- Aptos bounces off a key support level, targeting the 200-day EMA.
Pump.fun (PUMP), Zcash (ZEC), and Aptos (APT) have extended their recovery over the last 24 hours, emerging as top performers in the broader cryptocurrency market. Aptos rebounds from a crucial support with space for further growth before reaching the key resistance, while Pump.fun and Zcash are at a crossroads.
PUMP buyback-fueled recovery gains traction
Pump.fun repurchased its PUMP token for 7,496 SOL, increasing the total PUMP purchases to 617,749 SOL as the revenue surged to 7,498 SOL on Tuesday. Token buybacks often lead to a price surge due to reduced supply and a show of confidence.
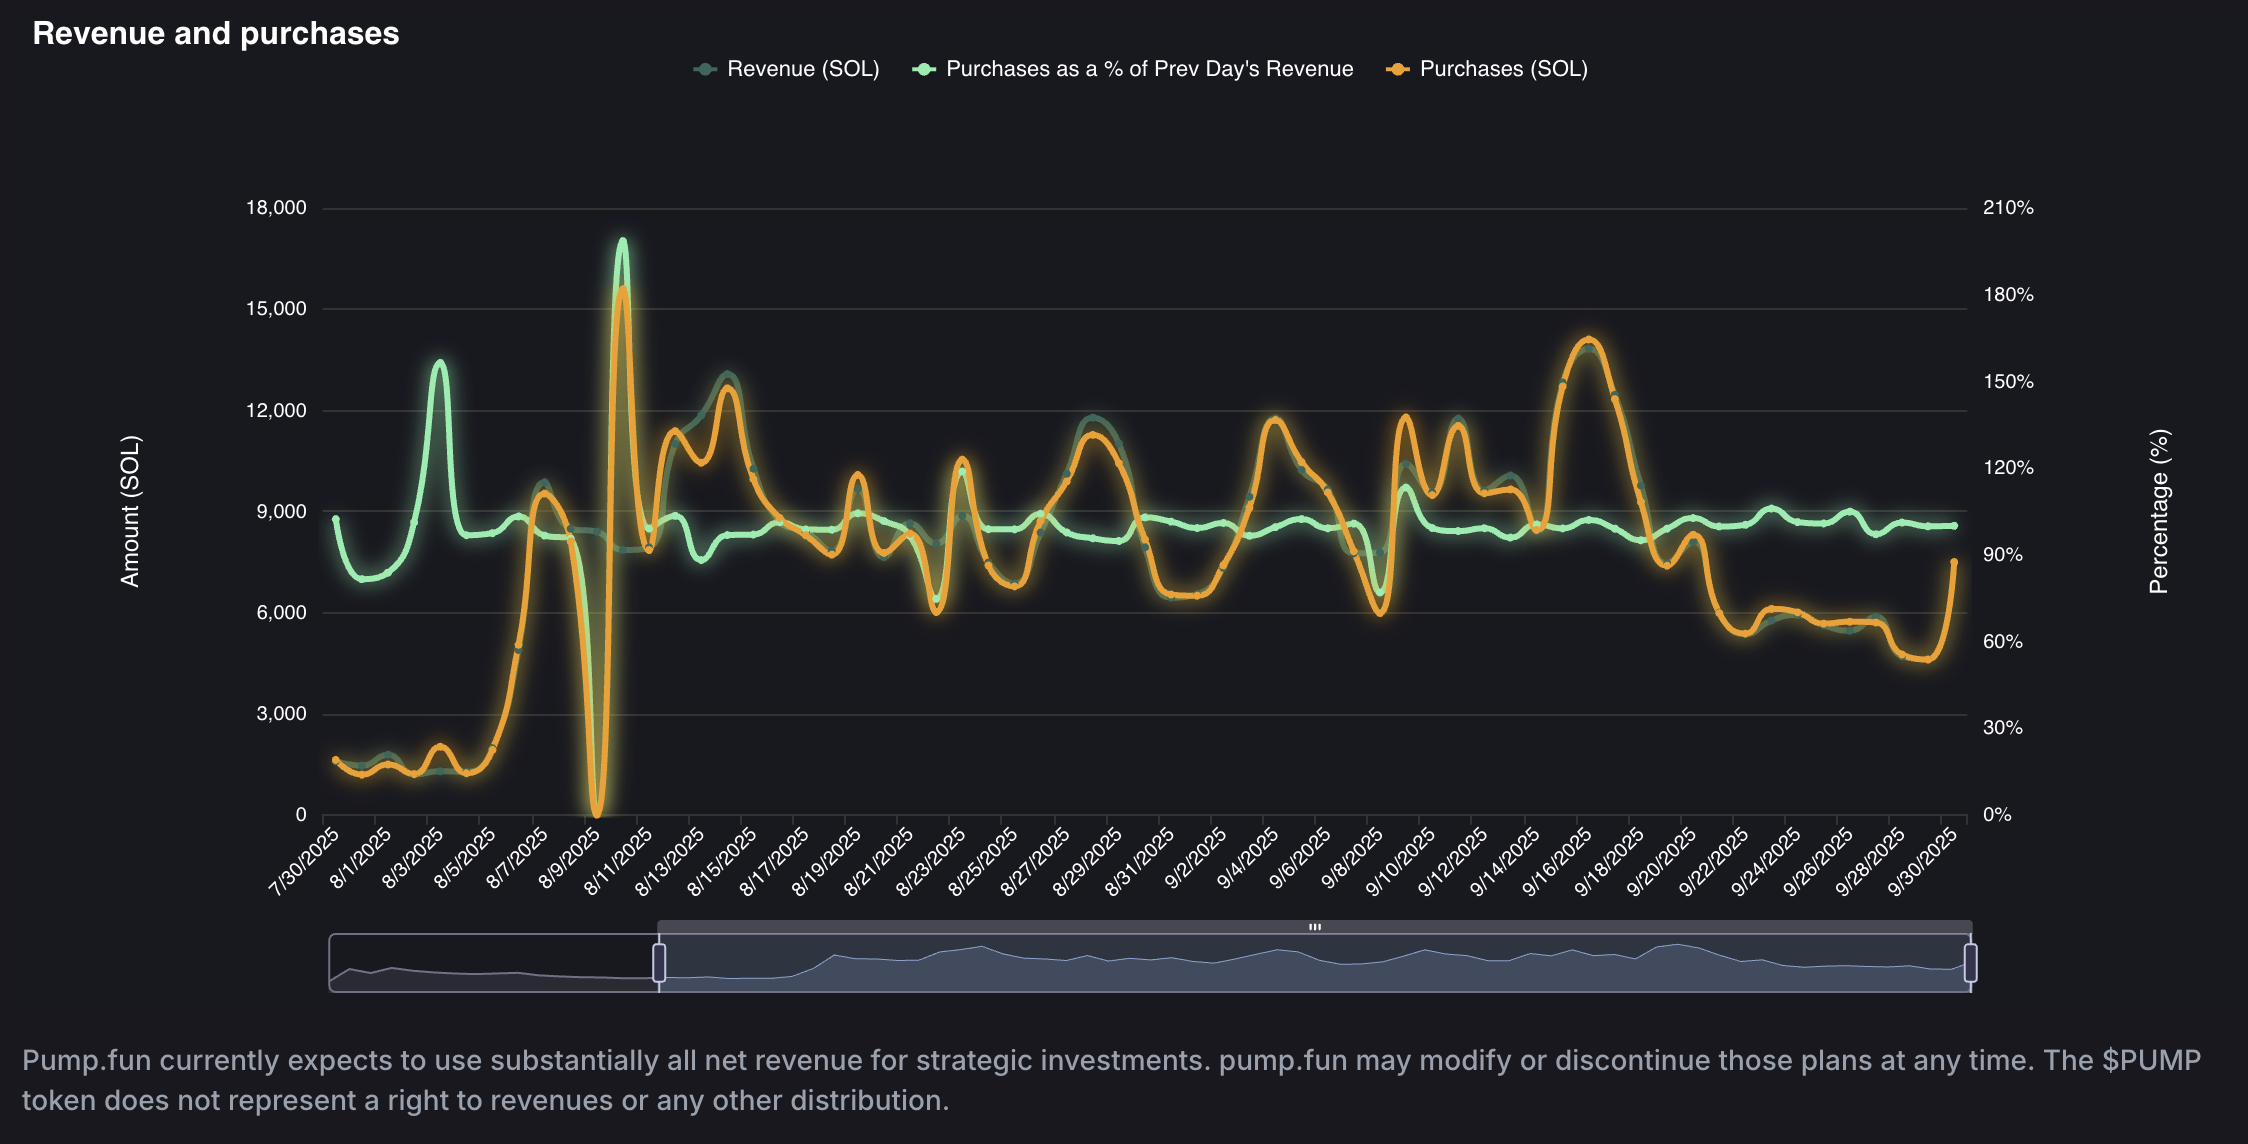
Revenue and purchases. Source: Pump.fun
PUMP edges higher by nearly 7% at press time on Wednesday, surpassing the key resistance at $0.006162 marked by Thursday’s high. A decisive close above this level on the 4-hour chart could extend the Pump.fun rally.
The key resistance levels for the creator economy token on the same chart are $0.006788 and $0.007655, based on previous bottoms from September 20 and September 17, respectively.
The Relative Strength Index (RSI) at 63 spikes above the halfway line, with space for further growth before reaching the overbought zone, which indicates a rise in buying activity. Additionally, the uptrending Moving Average Convergence Divergence (MACD) and its signal line cross above the zero line as successive rises of green histogram bars, indicating a surge in bullish momentum.
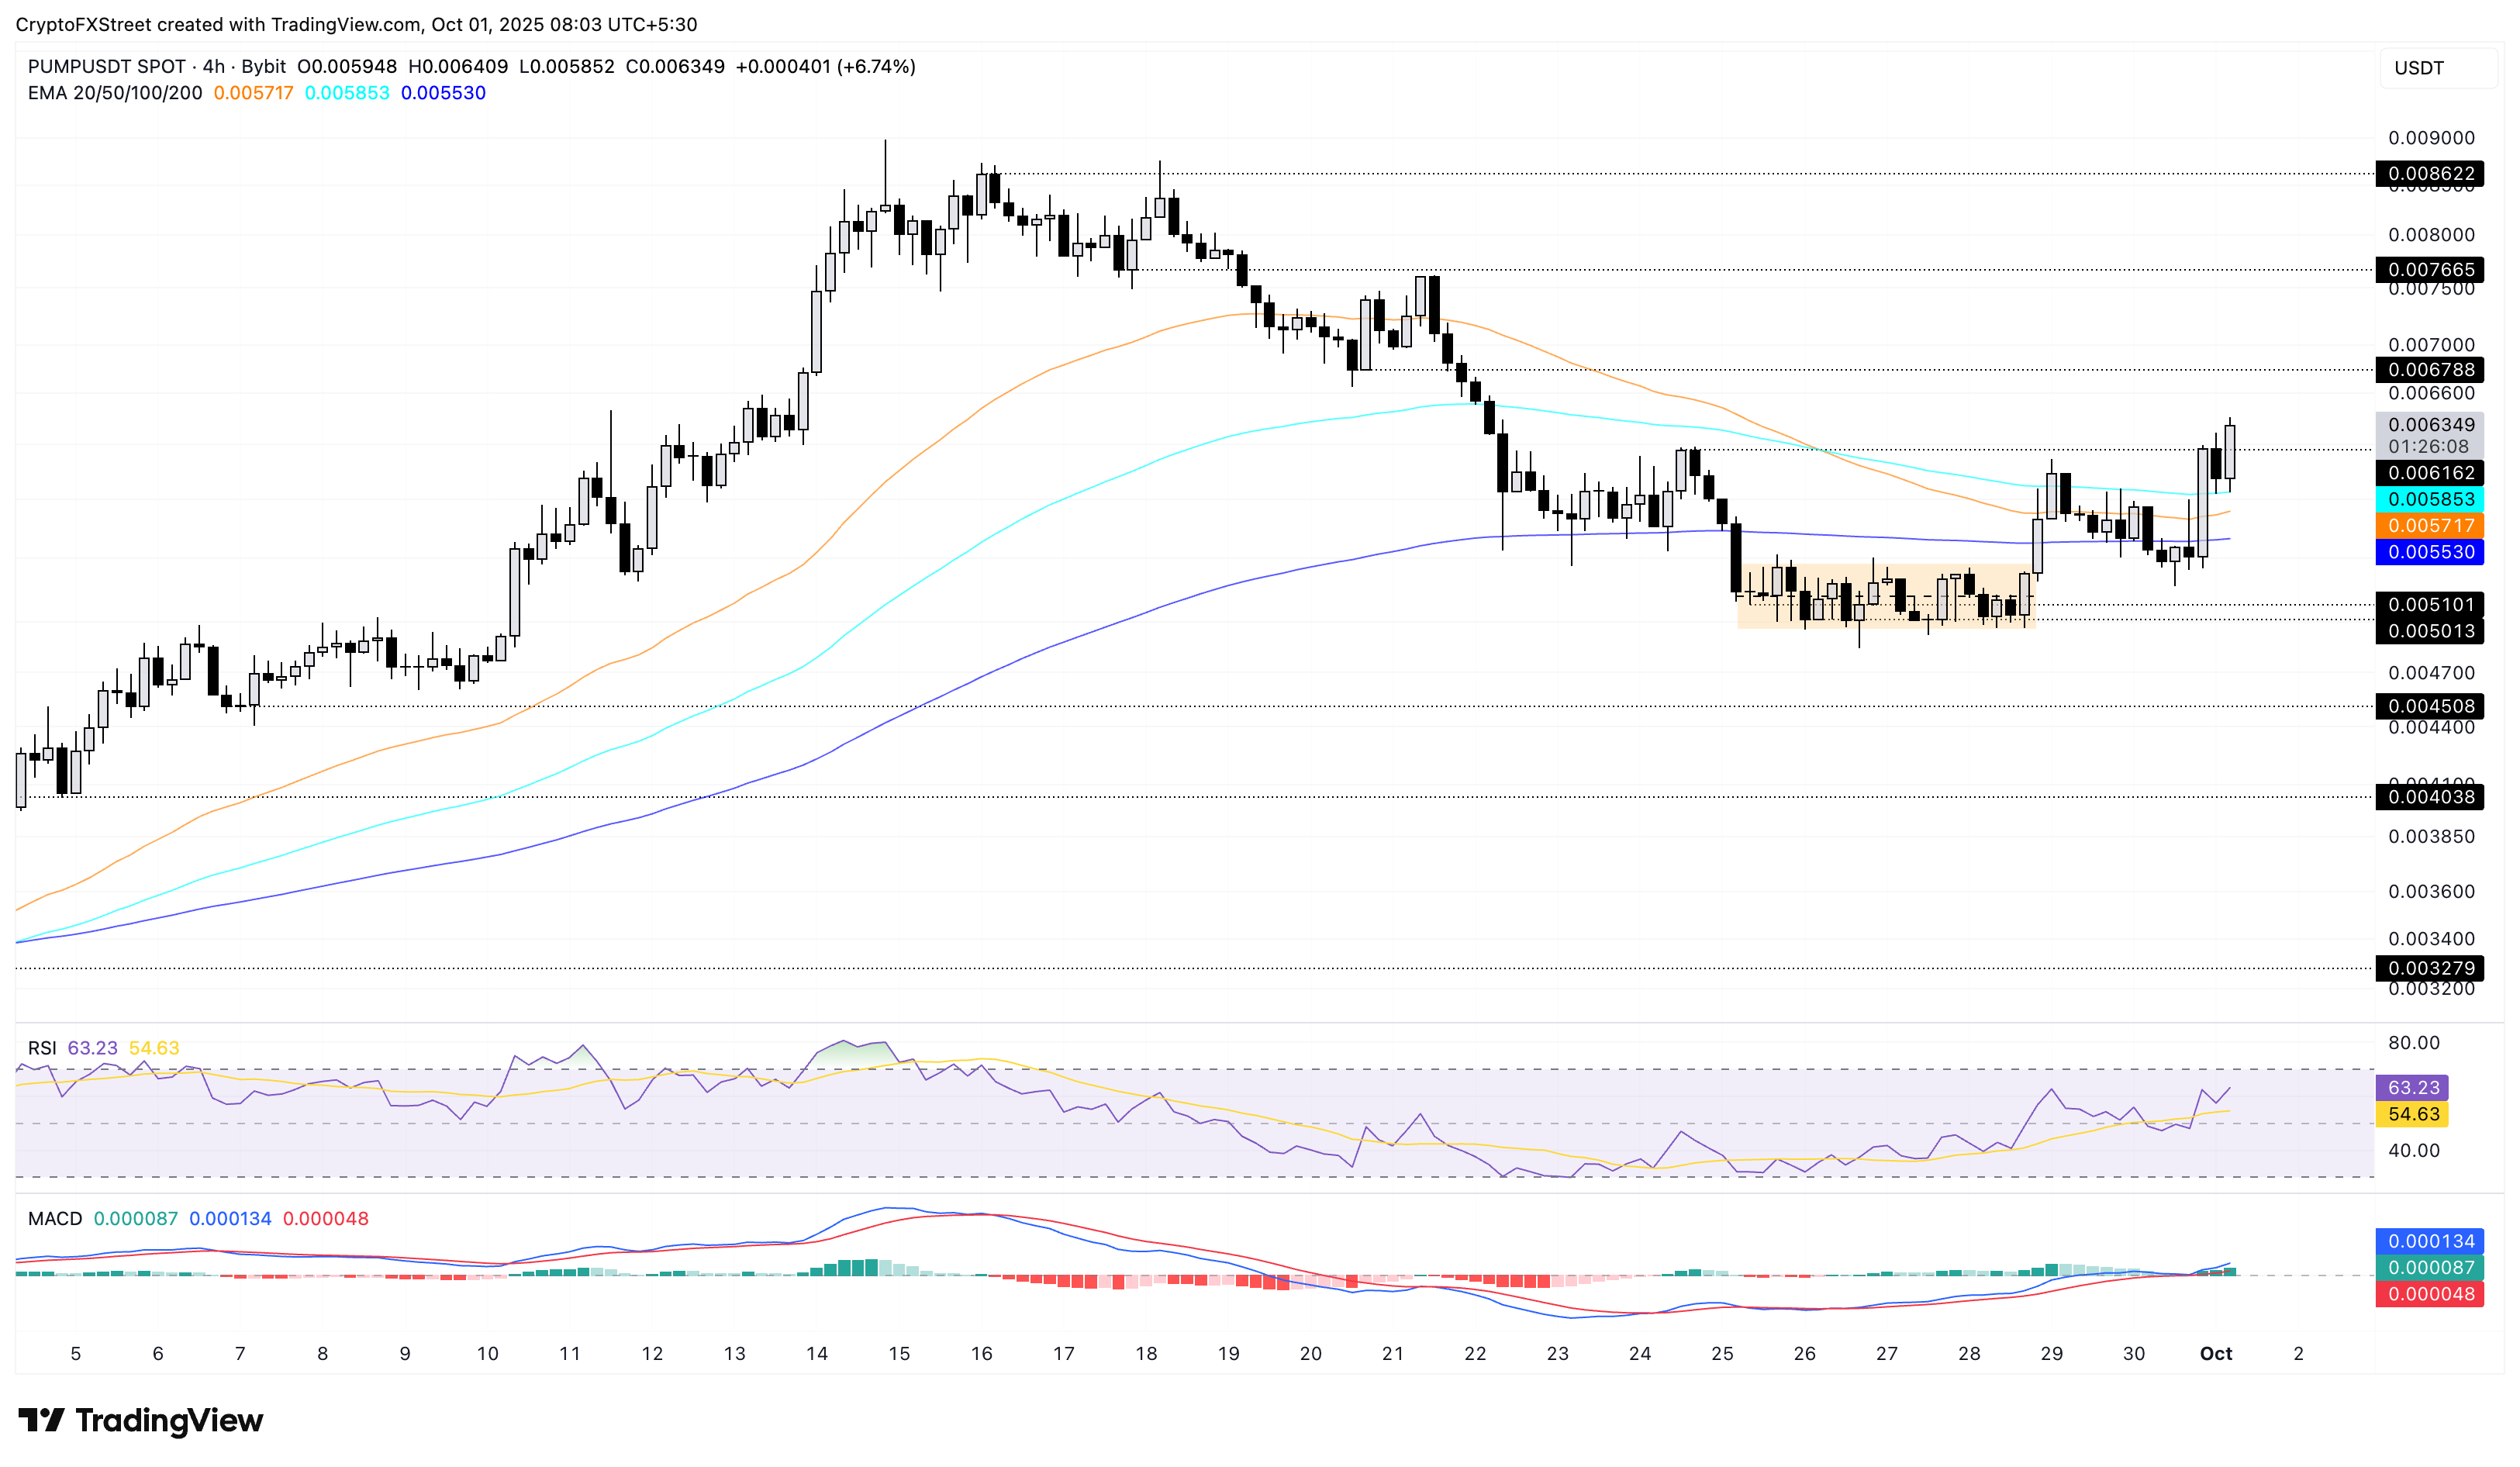
PUMP/USDT daily price chart.
If PUMP fails to hold a close above $0.006162, it could result in a retest of the 200-period Exponential Moving Average (EMA) at $0.005530.
Zcash rally upholds bullish momentum, eyeing further gains
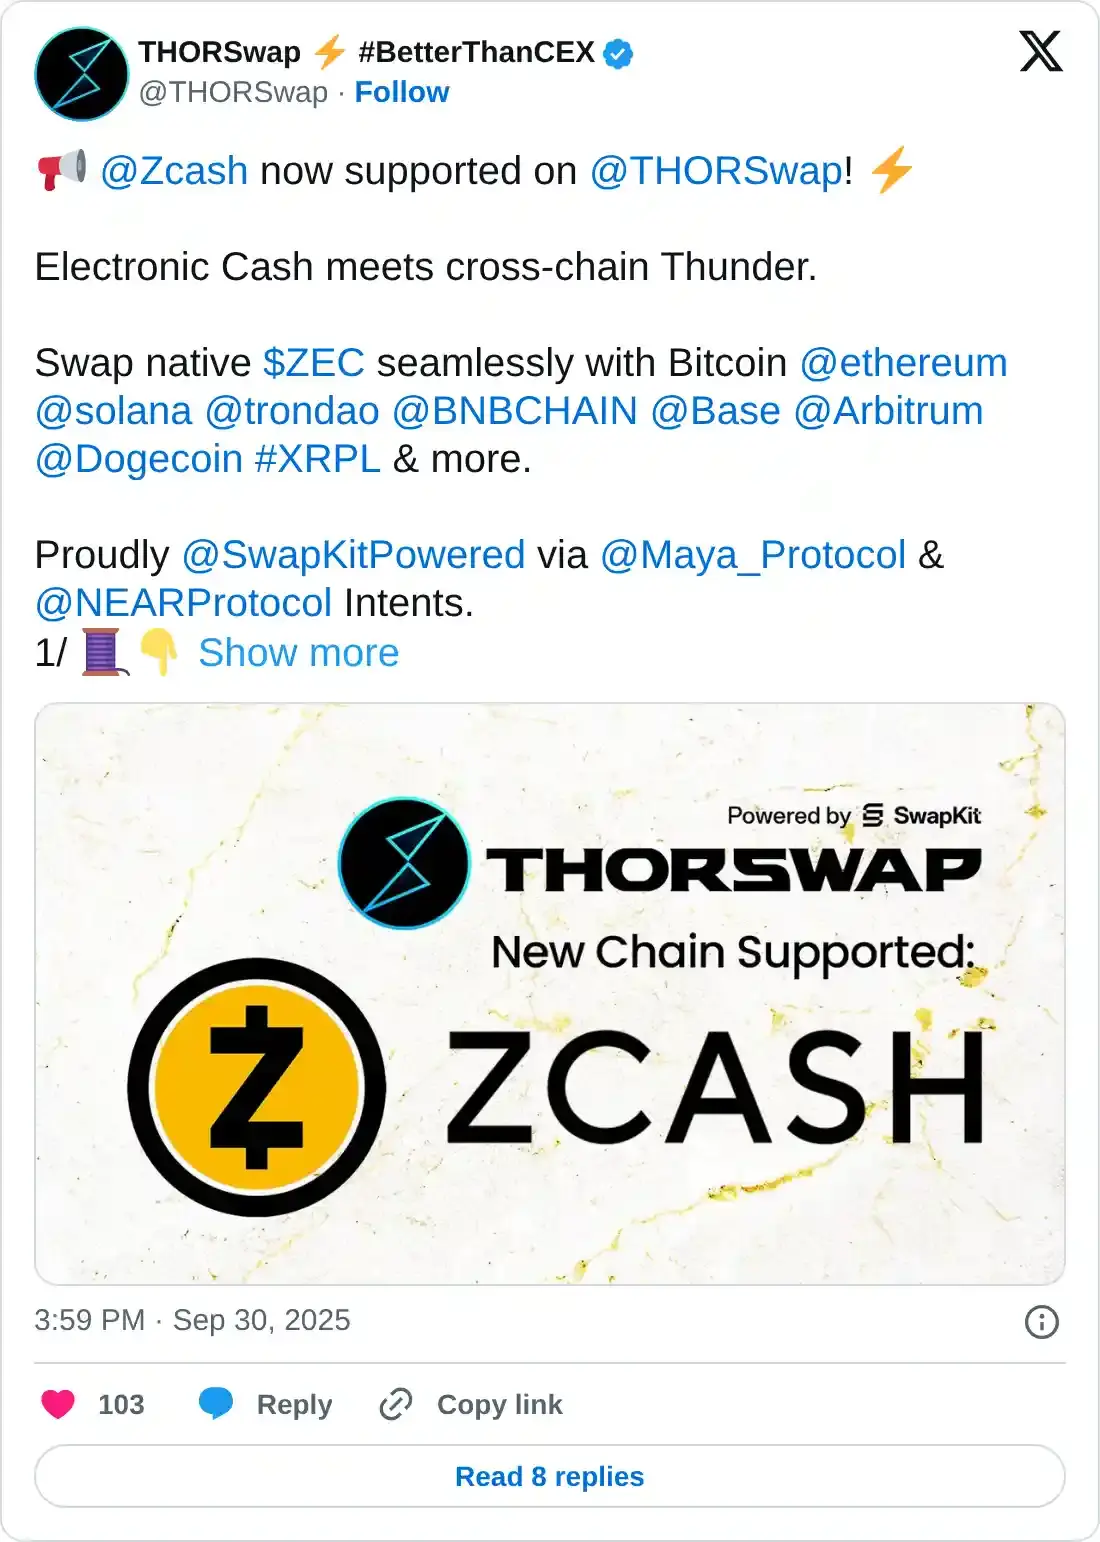
ThorSwap extends support to Zcash, allowing users to swap ZEC for Bitcoin or other top altcoins. However, the privacy coin’s key feature, shielded address support, remains under evaluation, which could be added later.
At the time of writing, Zcash trades above $76 on Wednesday, marking its fourth consecutive day of an uptrend. The privacy coin fell short of closing above the highest close in 52 weeks at $74.59 on Tuesday.
Still, the uptrend inches closer to its 52-week high of $79.33, and a positive close to the day would confirm the highest close over the past year. Based on the Fibonacci extension from the $74.59 close on December 2 to the $29.17 close from March 10, key resistance for ZEC lies at $96.29, aligning with the 1.272 Fibonacci extension level.
The RSI reads 79 on the daily chart, entering deep into the overbought territory, which raises the risk of a sudden reversal if traders shift to booking profits. Additionally, the MACD and its signal line continue to surge with green histogram bars, indicating that bullish momentum is elevated.
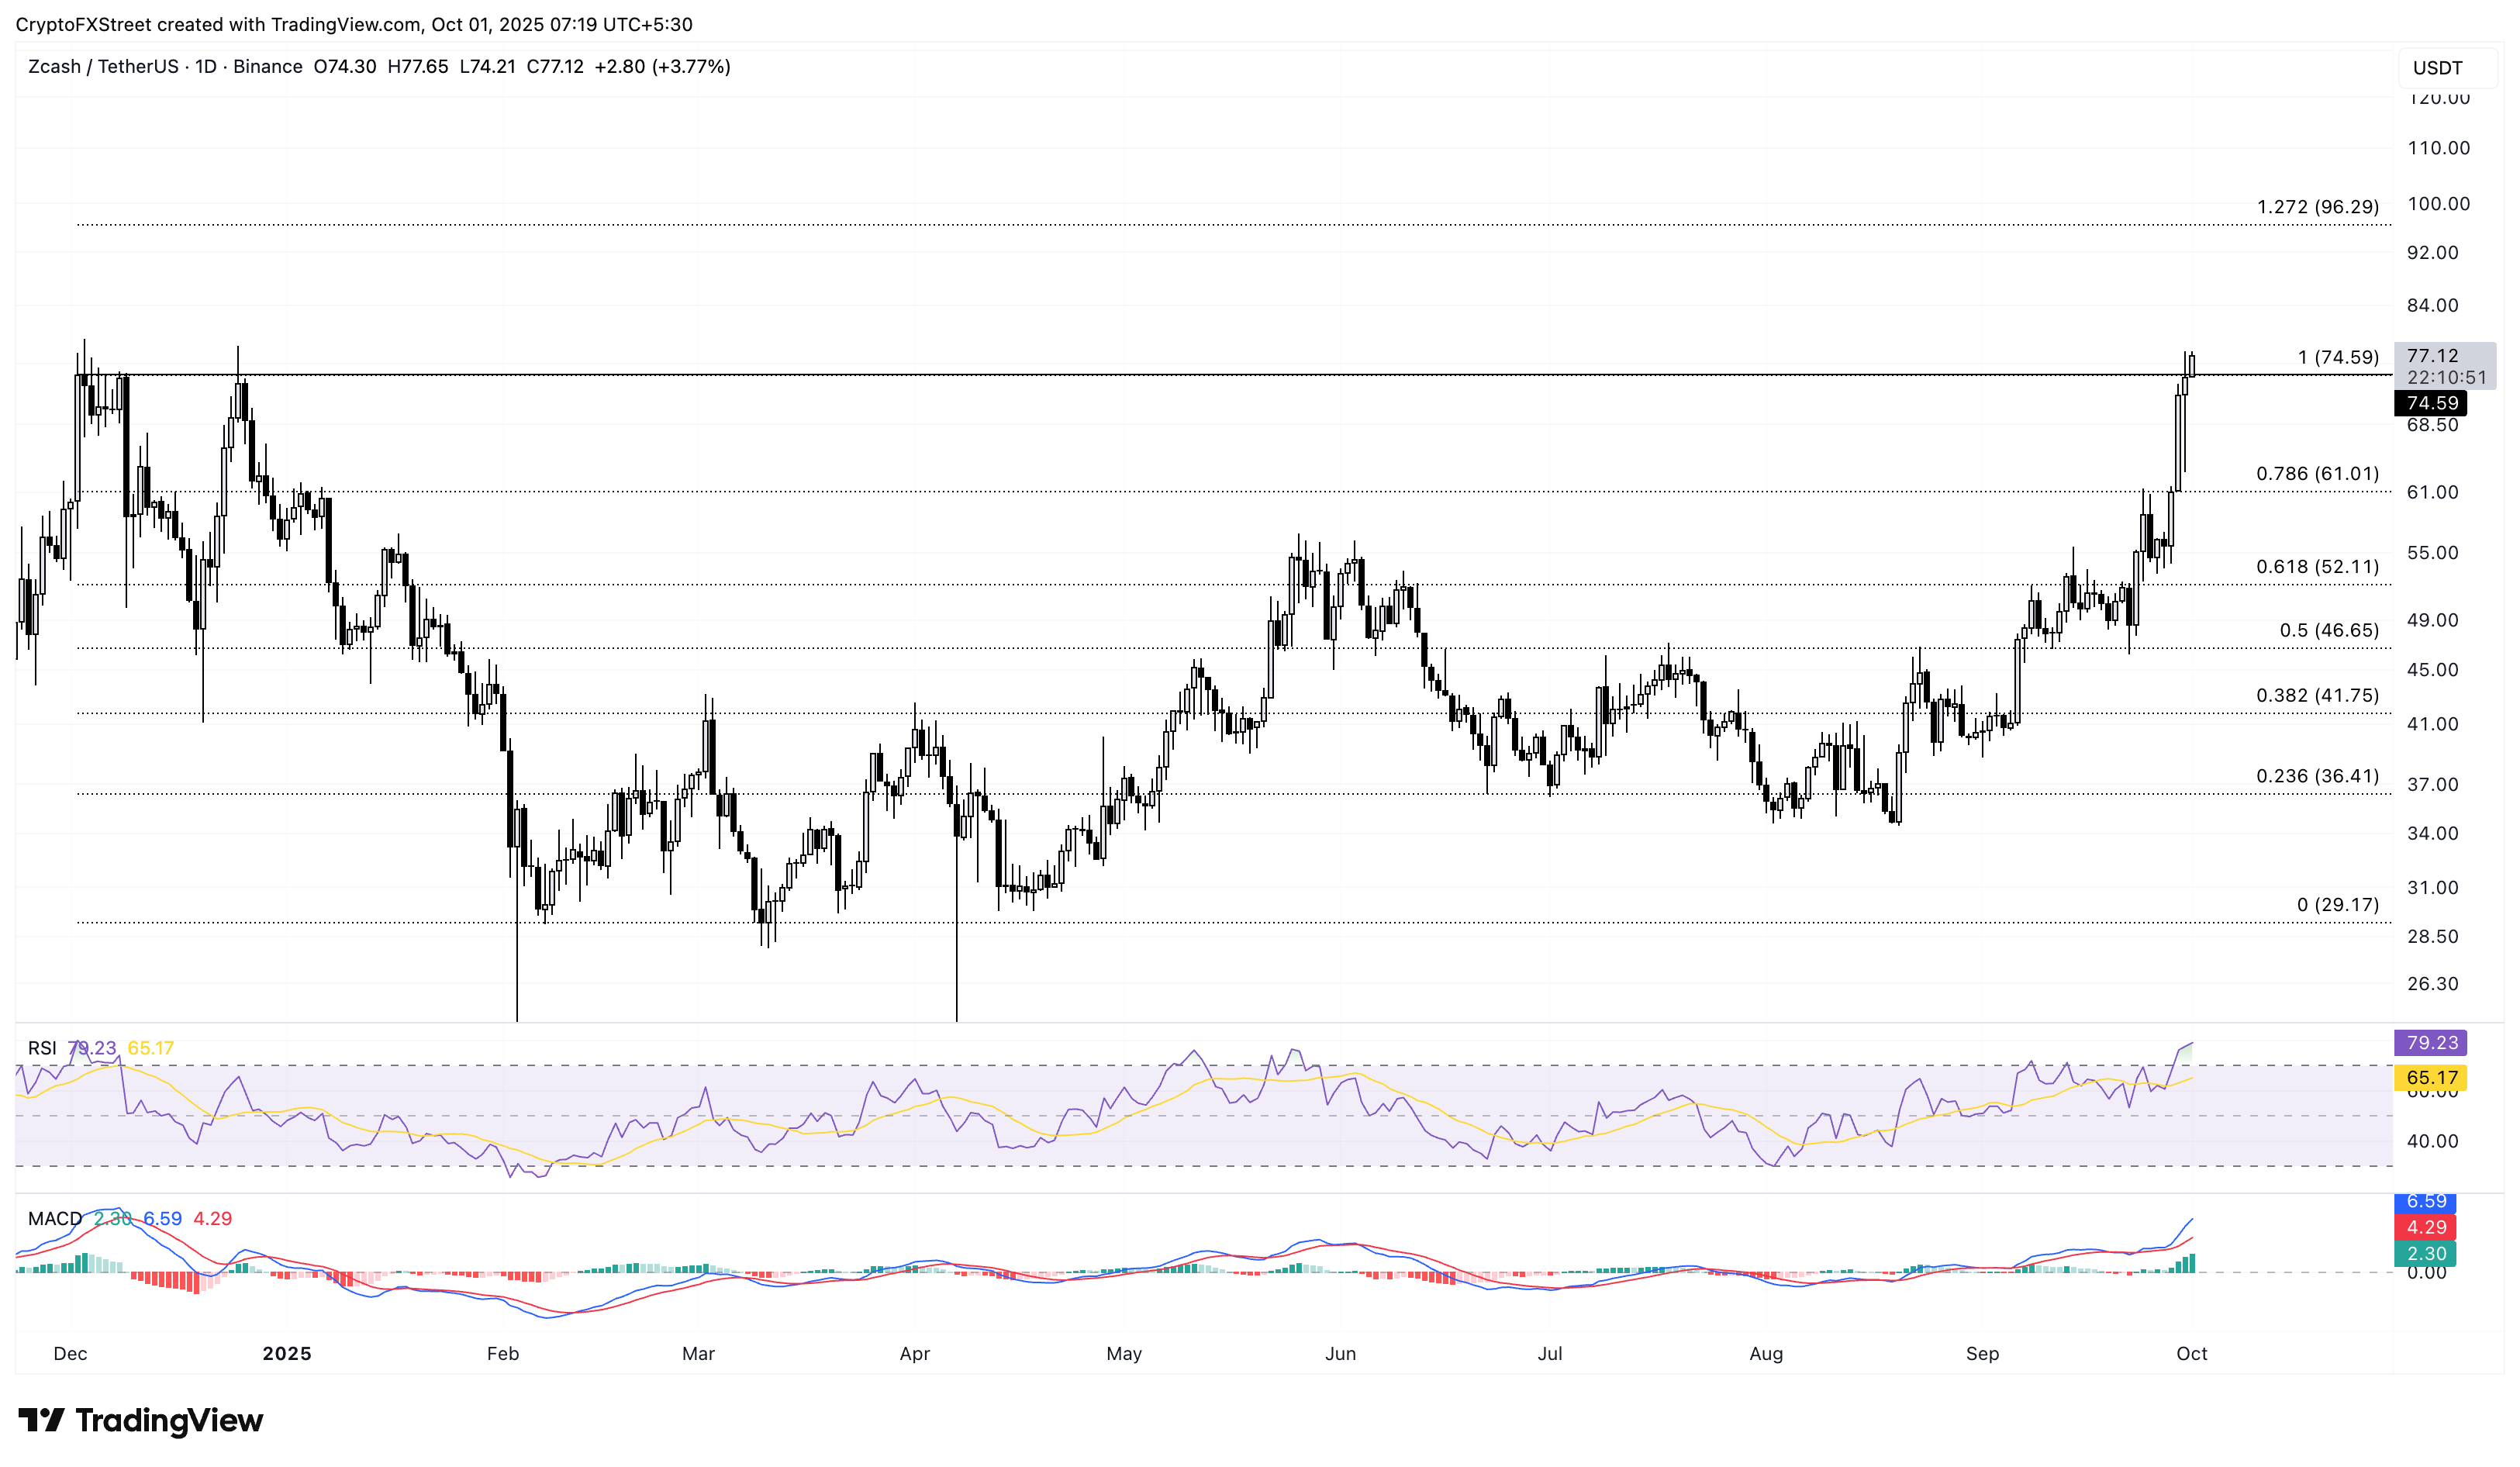
ZEC/USDT daily price chart.
Looking down, a reversal below the $74.59 level could extend the decline to $61.01, aligning with the 78.6% Fibonacci retracement level.
Aptos’ rebound targets the 200-day EMA
Aptos announced the integration of PayPal’s PYUSD0 on Aptos via LayerZero and Stargate Finance, boosting payment options. Furthermore, Aptos also announced an integration with Republic, a global investment firm, to leverage its blockchain ecosystem.

At the time of writing, Aptos gains over 1%, extending the uptrend for the sixth consecutive day. The recovery run in APT started off with a rebound from the $3.893 support level on Friday, and has surpassed the 50-day EMA at $4.438.
If the uptrend surpasses the 100-day EMA at $4.607, it could challenge a long-standing resistance trendline formed by connecting the highs of 20 February and July 23. The 200-day EMA, currently at $5.153, is tracking alongside this trendline.
The RSI on the daily chart shows a V-shaped reversal from the oversold zone, surpassing the midpoint line to 53, indicating a rise in buying pressure. Additionally, the MACD converges with its signal line, indicating renewed bullish momentum.
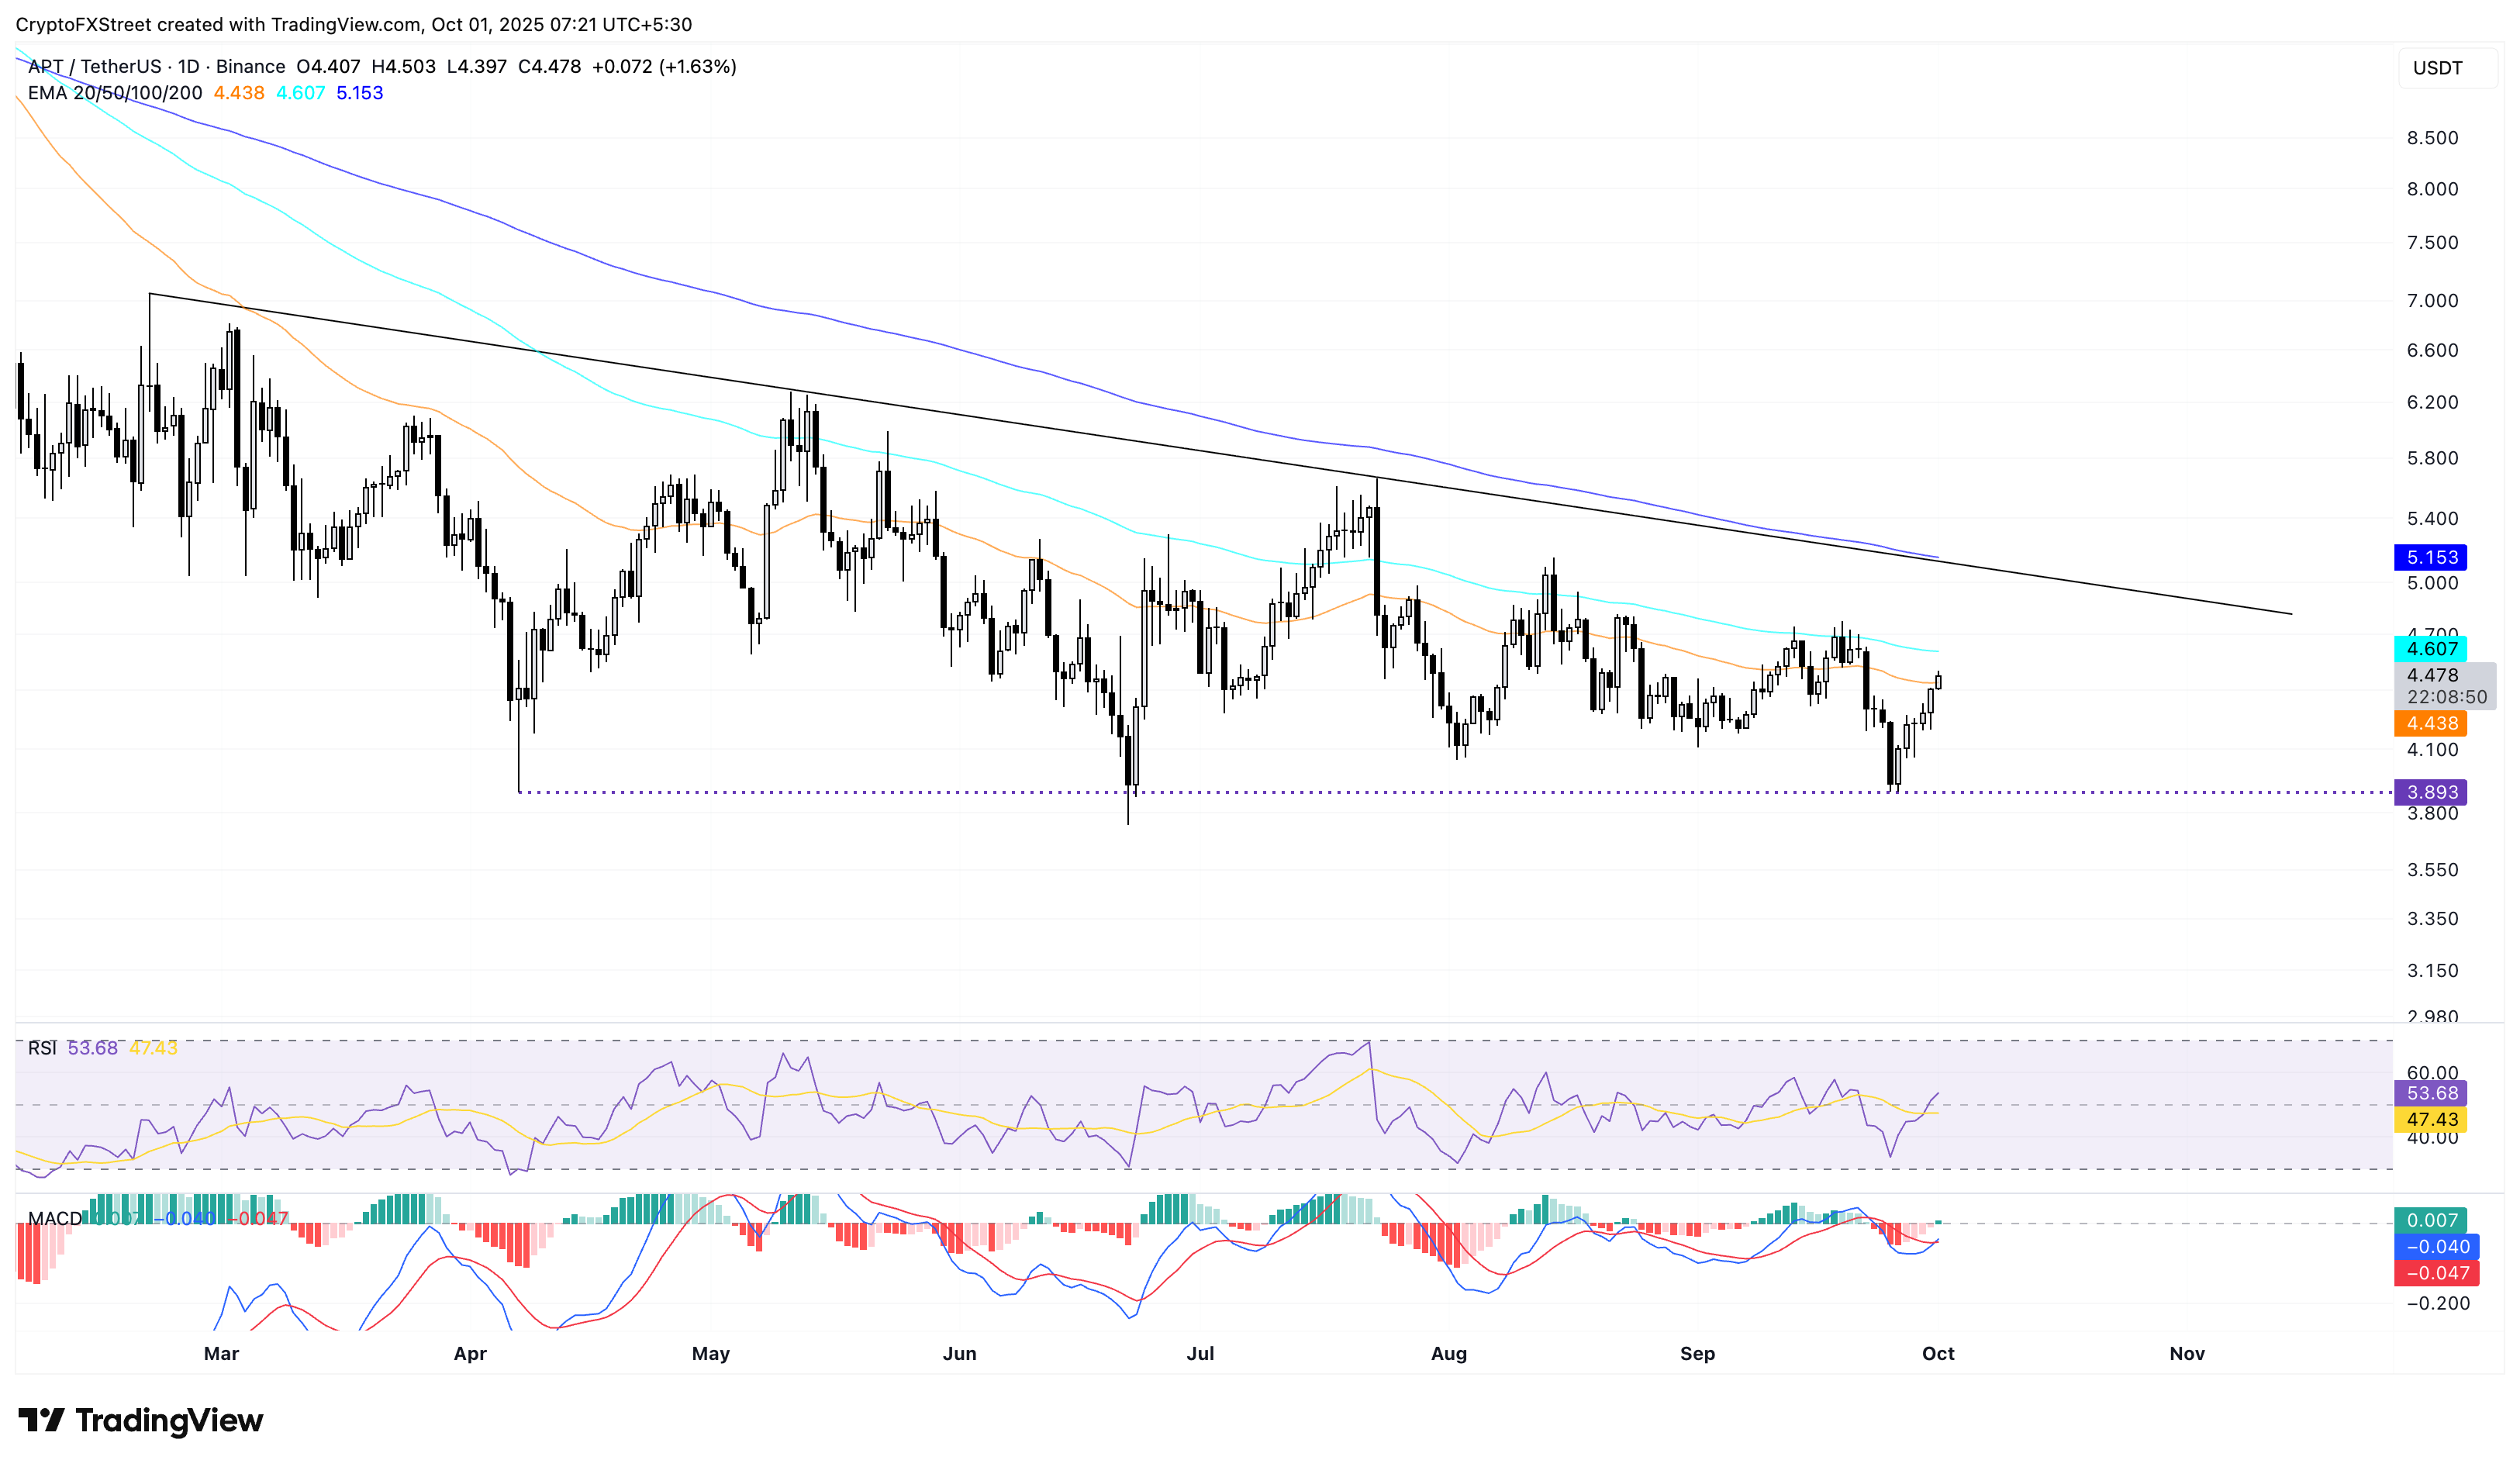
APT/USDT daily price chart.
If APT fails to hold above the 50-day EMA at $4.438, it could nosedive to the $3.893 support floor.
Recommended Articles


