
NZD/USD Price Forecast: Targets nine-day EMA barrier near 0.5750
- NZD/USD may find its primary support at the crucial level of 0.5700.
- The 14-day Relative Strength Index is positioned above the 30 mark, indicating bearish bias is in play.
- The initial barrier lies at the nine-day EMA of 0.5745.
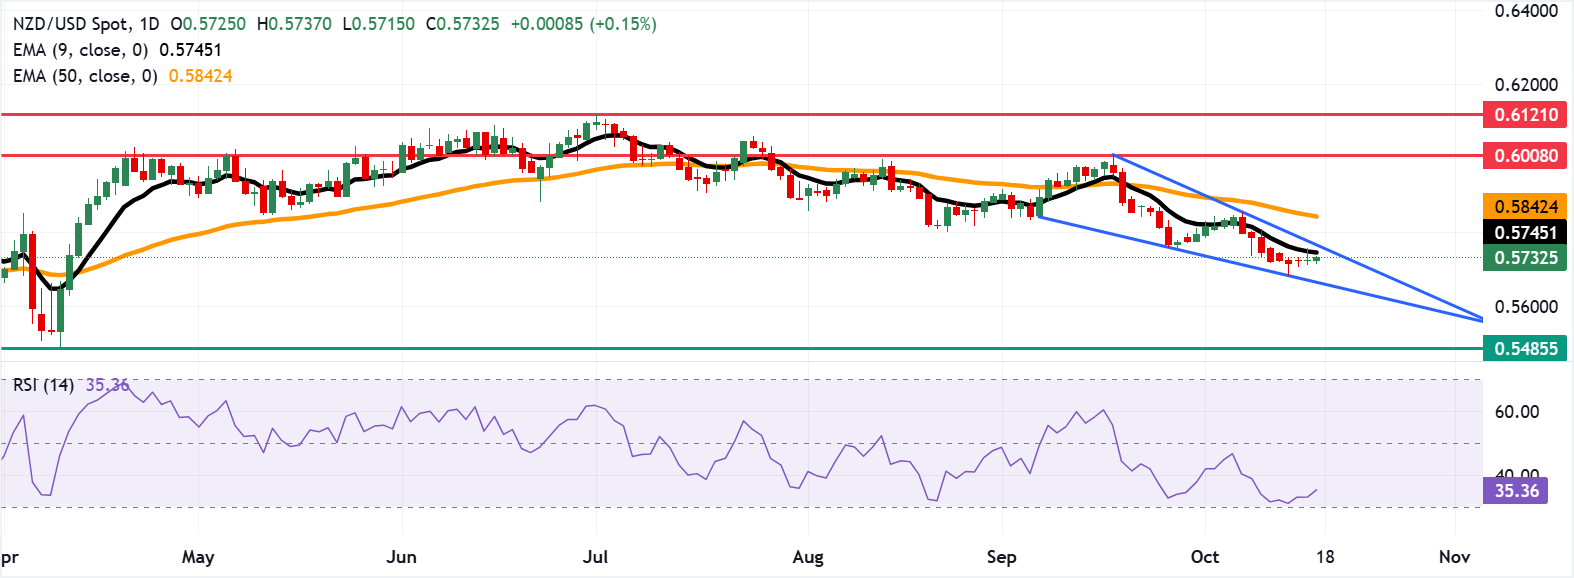
NZD/USD gains ground after a flat performance in the previous session, trading around 0.5730 during the Asian hours on Friday. The daily chart’s technical analysis signals a potential bullish reversal as the pair price moves ahead in the descending wedge pattern. A continuation within the descending wedge indicates declining volume, reflecting weakening momentum in the bearish trend.
The 14-day Relative Strength Index (RSI) is positioned slightly above the 30 mark, suggesting a bearish bias is active. Additionally, the short-term price momentum is weaker as the pair remains below the nine-day Exponential Moving Average (EMA).
On the downside, the NZD/USD pair could find its initial support at the psychological level of 0.5700, followed by the lower boundary of the descending wedge around 0.5670. A break below the wedge pattern would strengthen the bearish bias and put downward pressure on the pair to navigate the area around 0.5485, the lowest level since March 2020, which was recorded on April 9, 2025.
The NZD/USD pair eyes its primary barrier at the nine-day EMA of 0.5745, followed by the descending wedge’s upper boundary around 0.5770. A break above this confluence resistance zone would cause the emergence of the bullish bias and support the pair to test the 50-day EMA at 0.5842. Further advances would improve the medium-term price momentum and lead the pair to navigate the region around the three-month high of 0.6008, reached on September 17.
NZD/USD: Daily Chart
New Zealand Dollar Price Today
The table below shows the percentage change of New Zealand Dollar (NZD) against listed major currencies today. New Zealand Dollar was the strongest against the Australian Dollar.
| USD | EUR | GBP | JPY | CAD | AUD | NZD | CHF | |
|---|---|---|---|---|---|---|---|---|
| USD | -0.25% | -0.18% | -0.39% | -0.08% | 0.16% | -0.11% | -0.42% | |
| EUR | 0.25% | 0.07% | -0.14% | 0.19% | 0.47% | 0.14% | -0.17% | |
| GBP | 0.18% | -0.07% | -0.18% | 0.07% | 0.37% | 0.05% | -0.30% | |
| JPY | 0.39% | 0.14% | 0.18% | 0.29% | 0.58% | 0.23% | -0.06% | |
| CAD | 0.08% | -0.19% | -0.07% | -0.29% | 0.25% | -0.03% | -0.39% | |
| AUD | -0.16% | -0.47% | -0.37% | -0.58% | -0.25% | -0.32% | -0.62% | |
| NZD | 0.11% | -0.14% | -0.05% | -0.23% | 0.03% | 0.32% | -0.35% | |
| CHF | 0.42% | 0.17% | 0.30% | 0.06% | 0.39% | 0.62% | 0.35% |
The heat map shows percentage changes of major currencies against each other. The base currency is picked from the left column, while the quote currency is picked from the top row. For example, if you pick the New Zealand Dollar from the left column and move along the horizontal line to the US Dollar, the percentage change displayed in the box will represent NZD (base)/USD (quote).
Recommended Articles


