
GBP/USD slips as US–China tensions, cool, traders eye BoE speakers
- GBP/USD retreats to 1.3325 as Trump signals thaw with China, easing last week’s tariff-driven market jitters.
- Focus shifts to UK Autumn Budget and upcoming jobs and GDP data for August.
- Six BoE policymakers set to speak this week as traders price first rate cut for March 2026.
The Pound Sterling slides during the North American session, down 0.18% as tensions between the US and China ease, following last Friday’s escalation, that prompted investors to buy safety assets. At the time of writing, the GBP/USD trades at 1.3325 after hitting a daily high of 1.3366.
Sterling eases amid calmer trade rhetoric and cautious mood ahead of key UK economic releases
Last week, US President Trump threatened to impose 100% duties on China’s goods as retaliation for China’s rare earth export controls. Nevertheless, Trump posted on Sunday in on Truth Social that “Don’t worry about China, it will all be fine!”
Earlier, the Treasury Secretary Scott Bessent said that he still expects Trump to meet Chinese President Xi Jinping at the Asia-Pacific Economic Cooperation summit in South Korea later this month.
Aside from this, the lack of economic data in the US keeps traders entertained with US politics, the government shutdown and Federal Reserve officials crossing the wires.
In the UK, investors remain focused on the release of the Autumn budget. However, the docket will feature jobs data and Gross Domestic Product (GDP) figures in the three months to August.
Bank of England policymakers will speak this week, with six of the nine members of the Monetary Policy Committee (MPC) hitting the wires. Money markets are expecting the BoE to hold rates unchanged, pricing in the next adjustment until March 2026, as inflation is double the bank’s target.
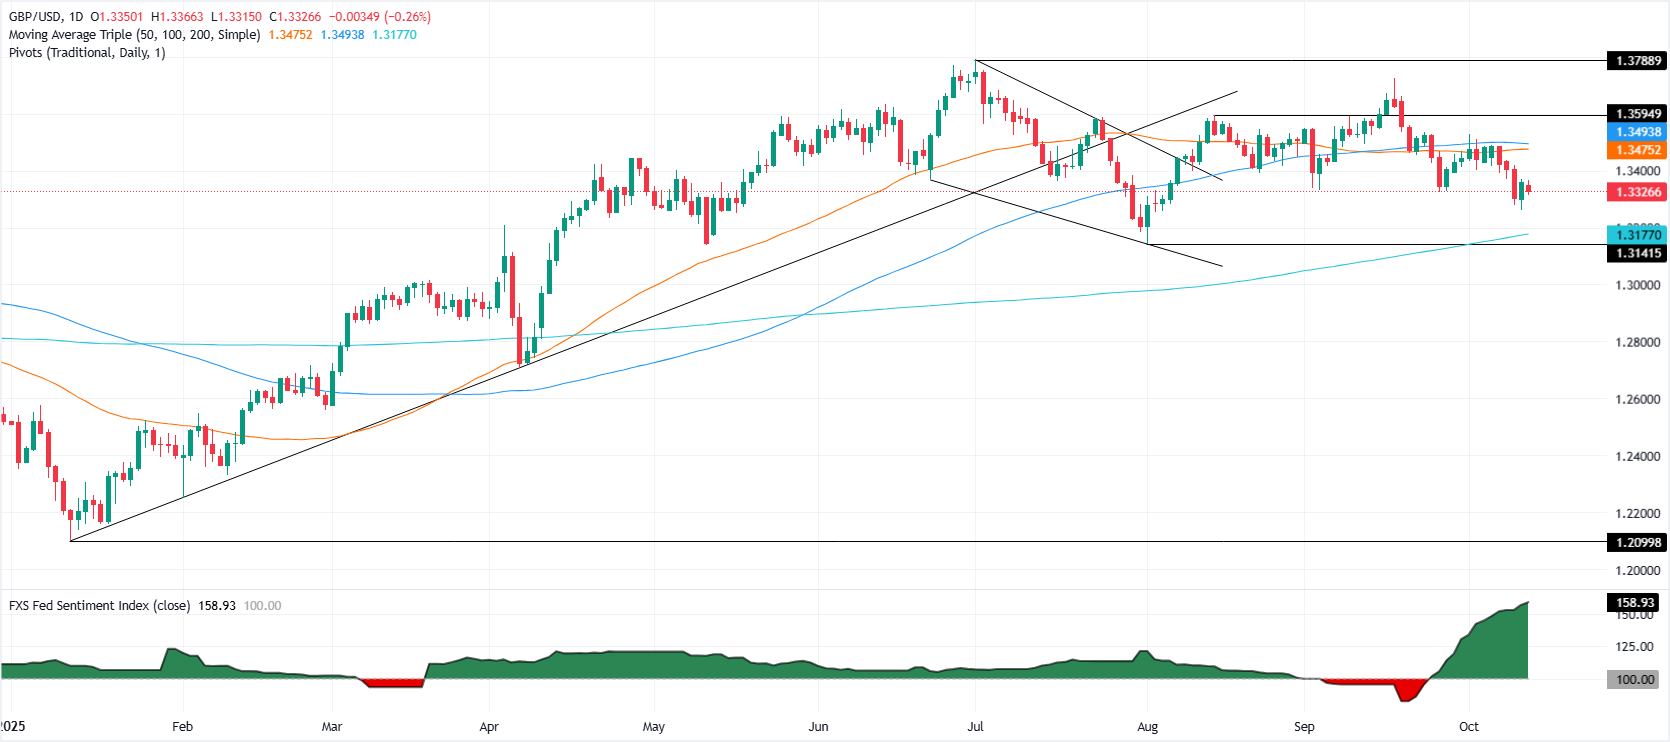
GBP/USD Price Forecast: Technical outlook
The technical picture shows the GBP/USD is trading neutral to slightly tilted to the downside, as price action remains below the 20, 50 and 100-day SMAs, an indication that in the short and medium term, sellers are in charge. Additionally, the Relative Strength Index (RSI) is bearish, trending downward, a sign further downside in the Pound is expected.
If GBP/USD drops below 1.3300, the next support would be 1.3200, followed by the 200-day SMA at 1.3173. On the flip side, if the pair reclaims 1.3400, key resistance levels emerge, like the 20-day SMA at 1.3451, the 50-day SMA at 1.3472 and the 100-day SMA a 1.3490.
Pound Sterling Price This Month
The table below shows the percentage change of British Pound (GBP) against listed major currencies this month. British Pound was the strongest against the Japanese Yen.
| USD | EUR | GBP | JPY | CAD | AUD | NZD | CHF | |
|---|---|---|---|---|---|---|---|---|
| USD | 1.49% | 0.87% | 3.02% | 0.79% | 1.54% | 1.19% | 1.12% | |
| EUR | -1.49% | -0.59% | 1.52% | -0.69% | 0.06% | -0.28% | -0.37% | |
| GBP | -0.87% | 0.59% | 2.13% | -0.10% | 0.67% | 0.32% | 0.23% | |
| JPY | -3.02% | -1.52% | -2.13% | -2.15% | -1.47% | -1.56% | -1.76% | |
| CAD | -0.79% | 0.69% | 0.10% | 2.15% | 0.74% | 0.41% | 0.33% | |
| AUD | -1.54% | -0.06% | -0.67% | 1.47% | -0.74% | -0.34% | -0.44% | |
| NZD | -1.19% | 0.28% | -0.32% | 1.56% | -0.41% | 0.34% | -0.09% | |
| CHF | -1.12% | 0.37% | -0.23% | 1.76% | -0.33% | 0.44% | 0.09% |
The heat map shows percentage changes of major currencies against each other. The base currency is picked from the left column, while the quote currency is picked from the top row. For example, if you pick the British Pound from the left column and move along the horizontal line to the US Dollar, the percentage change displayed in the box will represent GBP (base)/USD (quote).
Recommended Articles


