
Ford’s Earnings Crossroads
- Profit Squeeze from Tariffs: Adjusted EBIT fell 63% YoY to $1.0 billion, with tariffs cutting $200 million in Q1 and $1.5 billion expected for FY25.
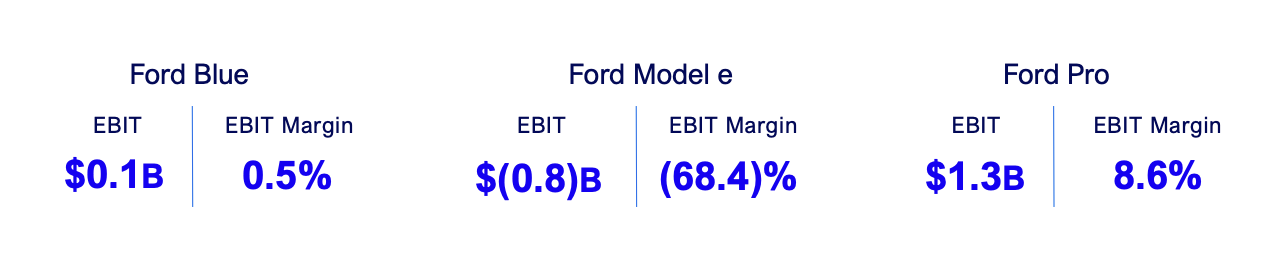
- Segment Divergence Widens: Ford Pro remains profitable with $1.3B EBIT, while Model e lost $849 million and Blue’s EBIT collapsed 89% to $96 million.
- Cash Burn Intensifies: Operating cash flow hit $3.7B, but adjusted free cash flow was negative $1.5 billion amid heavy EV and software investment.
- Valuation Hinges on Recovery: At ~$6.25/share fair value under stress, upside to $14 exists if margins rebound and tariffs normalize.
TradingKey - Ford’s (F) Q1 2025 financials represent a key inflection point in the company’s multi-year transformation story. Total revenue decreased 5% versus prior year to $40.7 billion, but the bigger issue is in profitability compression: adjusted EBIT plunged from $2.8 billion to $1.0 billion, a 63% decline.
The key point about what makes this erosion particularly alarming is not necessarily the cyclical nature of the auto business or operating seasonality related to model changeovers, it’s the unexpected external cost shock from tariffs. Management revealed that tariffs cut about $200 million from Q1 EBIT and would run about $1.5 billion for the entire year. That was not an controllable headwind, it was a structural blindside.
A market tends to take in production shutdowns attributed to new vehicle rollouts or inventory resets. However, Ford suspending its guidance for the full year based on policy-induced volatility suggests these are no temporary hiccups. With Ford having an intensely connected supply chain throughout North America through Canada and Mexico, it is uniquely exposed to earnings sensitivity for changes in trade policy. This geopolitical anchoring has made core financial forecasting more probabilistic rather than deterministic.
.png)
Source: Ford Q1 2025 Earnings Presentation
Also, the $0.14 operating EPS that sank sharply from $0.49 does not capture more widespread capital pressure. The company is burning off its free cash in its transition engine. Ford is not just struggling against cyclical headwinds but is increasingly playing political roulette as tariffs are seizing its cost structure just when it needs it most: in the midst of a capital-heavy transition to EVs and software.
.jpg)
Source: Statista
A Story of Three Fords: Ford Resilience, EV Vulnerability, ICE Volatility
Ford’s in-house segmentation, Pro, Blue, and Model e, is one of the most transparent in the industry for distinguishing between legacy drag and innovation potential. The numbers are striking. The company’s 2025 crown jewel, Ford Pro, yielded $1.3 billion of EBIT on an 8.6% operating margin, off $3.0 billion and an 16.7% operating margin in a prior-year comparison. With a 14% plunge in wholesales of commercial vehicles, Pro maintained its footing due to a rapidly growing high-margin service overlay, where paid subscriptions were 675,000 and growing 4% quarter-over-quarter. Ford’s most underrecognized margin engine and long-term flywheel is its software and service monetization model.
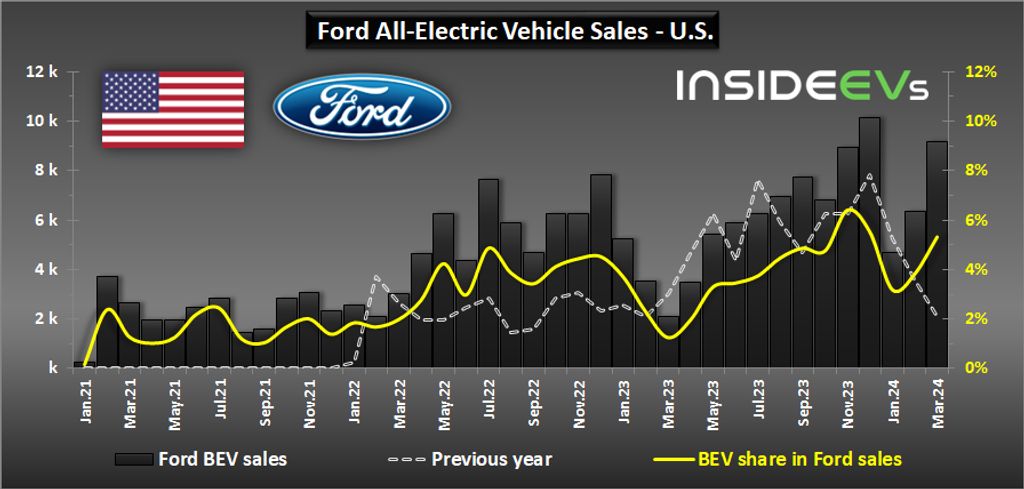
Source: InsideEVs
At the opposite end of the spectrum is Ford Model e, which still sits in deep red. The losses in EBIT decreased from $1.3 billion in Q1 2024 to $849 million in Q1 2025, a reflection of growing cost discipline but not yet a structural solution. The negative margins of 68.4% mean that every car sold continues to take its toll on profitability. Positive signs do exist, though: U.S. retail sales of EVs increased 15% over the prior year, fueled by bundling offerings like Ford Power Promise, including home chargers and installation. Without synchronizing battery cost, labor intensity, and price discipline, though, scale won't solve for negative margins.
.png)
Source: Teslarati
Ford Blue is also the most vulnerable and episodic. With just a 3% revenue drop in revenue, segment EBIT plummeted 89%, from $901 million to a paltry $96 million. Alarming! Ford Blue's margin contracted to 0.5%, illustrating what tariffs, FX, and inflation in materials can do to earnings when operating leverage is tight. That legacy ICE business that was once the golden goose now appears to be a transmission that can't take torque during macro stress.
Source: Ford Q1 2025 Earnings Presentation
Fractured Strategy Below the Surface
What is striking about Q1 is just how much of Ford's risk profile has moved from operational delivery to exogenous shock. Tariff costs are forecasted to grow to $2.5 billion gross for FY25, and have a net EBIT impact of $1.5 billion. These numbers underrepresent second-order effects. Increased component costs, price elastic pressure in core markets, and retaliatory tariffs are placing Ford in a place of defensive allocation.
Improvement in costs was apparent in some areas, notably Pro and Model e relative year-over-year performance, but Ford Blue's operating breakdown masked that. Net pricing was slightly upbeat but weakened in Ford Blue as a result of a less attractive product mix and softening fleet pricing. Model e's firmer pricing mitigated some of the losses, but its low volume magnitude provides EBIT gains little torque. The underlying issue is Ford's margin formula has lost its resilience.
Operating cash flow was robust at $3.7 billion, but adjusted free cash flow, the preferable metric for investment capability, was negative $1.5 billion. The difference implies either temporary compression in working capital or postponed CapEx. But if that divergence continues, it can point towards declining cash conversion. Ford has an asset in its $27 billion in cash but one that is not self-sustaining unless core segments regain capacity to pay for expansion from operations.
.png)
Source: Ford Q1 2025 Earnings Presentation
Valuation Compression or Re-Rating Catalyst
Ford's current equity valuation suggests a market in probabilistic limbo. One can annualize its first-quarter adjusted EPS of $0.14 and arrive at an implied forward EPS of just $0.56, over 22 times earnings for Ford. That is not a normalized perspective, though. Subtracting out tariffs' distortions, a more reasonable base-case EPS forecast for FY25 may come in around $1.20, which would imply a forward P/E near 10 times. That is historically low, but still suggests recovery in margins and in policymaking.
Most importantly, adjusted EBIT margin contracted 400 basis points YoY from 6.5% to 2.5%, and also ROIC from 12.7% down to 10.9%. These are not numbers seen with rerating catalysts, they reflect declining capital productivity. Stabilizing EBIT this year at $7.5 billion (the mid point of previous guidance), a 6x EV/EBIT multiple suggests a $45 billion enterprise value. Subtract ~$20 billion of net debt, equity value is approximately $25 billion, or ~$6.25/share, down significantly from today's levels.
But if Ford performs impeccably, returning EBIT to $8.5 billion, driving Model e losses towards breakeven point, and lifting Ford Pro monetization of services, the narrative looks different. EPS can extend to $1.60+, while an 8 times multiple would suggest $12.80–$14.40 of valuation. Yet all this upside becomes highly contingent. It rests on execution, normalization of battery supply, and roll-back of tariffs, factors that are outside Ford’s complete wagon.
Conclusion: A Policy-Shocked Giant with Optionality
Ford's Q1 2025 earnings reflect a company not in distress, but flexing through a turbulent transition under intense outside pressure. The core business is weathering body shots from tariffs, margin discounting, and policy whiplash. Below it all, however, Ford Pro keeps outperforming, Model e is reducing its burn rate, and the software ecosystem is incrementally scaling.
F’s valuation is more a function of uncertainty than of irrelevance. With some resolution around tariffs and margins, rerating potential can open up. But in the meantime, Ford provides optionality for the strategically minded, at an increasingly expensive price.
Recommended Articles


