


Bitcoin Price Forecast: BTC bulls show signs of exhaustion as holders realize profits, and dormant wallets are moving
- Bitcoin price hovers around $94,000 on Tuesday after failing to close above the key resistance level of $97,700 last week.
- Santiment data shows that BTC dormant wallets are moving; if tokens are sent to exchanges, the selling pressure could increase.
- Semler Scientific and Strategy added 167 and 1,895 BTC, respectively, totaling $196.50 million on Monday.
Bitcoin (BTC) price is hovering around $94,000 at the time of writing on Tuesday after failing to close above the key resistance level of $97,700 last week. On-chain data shows that BTC holders are realizing profits. Additionally, BTC’s dormant wallets are moving, and if tokens are sent to exchanges, the selling pressure could increase.
Despite negative sentiment shown by on-chain metrics, corporate demand for BTC remained strong as Semler Scientific and Strategy (former MicroStrategy) added 167 and 1,895 BTC, totaling $196.50 million on Monday.
Holders continually book profits while dormant wallet activity rises
Bitcoin's on-chain metrics show that BTC holders are booking some profits, according to Santiments’ Network Realized Profit/Loss (NPL), which computes a daily network-level Return On Investment (ROI) based on the coin’s on-chain transaction volume. Strong spikes in a coin’s NPL indicate that its holders are, on average, selling their bags at a significant profit. On the other hand, strong dips imply that the coin’s holders are, on average, realizing losses, suggesting panic sell-offs and investor capitulation.
The metric showed multiple spikes last week and one massive spike on Monday, indicating that holders are, on average, selling their bags at a significant profit and increasing the selling pressure.
 [14-1746529599928.41.31, 06 May, 2025].png)
BTC NPL chart. Source: Santiment.
Looking at Santiment’s Age Consumed index also raises bearish signs. The spikes in this index suggest dormant tokens (tokens stored in wallets for a long time) are in motion, and it can be used to spot short-term local tops or bottoms. As in BTC’s case, history shows that the spikes were followed by a fall in BTC’s price as holders moved their tokens from wallets to exchanges, thereby increasing the selling pressure.
The most recent uptick on Monday was the highest spike since early February, which forecasted that BTC was ready for a downtrend.
 [14-1746529625342.56.51, 06 May, 2025].png)
BTC Age Consumed chart. Source: Santiment
Corporate demand continues to strengthen
Strategy announced on Monday that it has acquired 1,895 BTC for $180.30 million, bringing its total holding to 555,450 BTC. This news follows last week’s Q1 earnings presentation, where the company revealed a new $21 billion at-the-market offering to add more BTC to its reserve.
During the same period, Semler Scientific added 167 BTC, holding 3,634 $BTC, and is now the fourth largest Bitcoin Treasury Company in the US.
The demand from corporate companies is positive for Bitcoin as it indicates a growing acceptance of BTC as a strategic asset, boosting its legitimacy and potentially driving long-term adoption. This trend is generally bullish for Bitcoin’s price due to increased demand, reduced circulating supply, and positive market sentiment.
Meanwhile, in its press release on Monday, Riot Platforms announced that it sold 475 Bitcoins for $38.8 million in April to fund operations and avoid equity dilution, marking its first major BTC sale since January.
The CEO of Rio, Jason Les, said, “These sales reduce the need for equity fundraising, limiting the amount of dilution in our stock.”
He continued, “We will continue to monitor market conditions on an ongoing basis and utilize all tools available to best sustainably finance our business, while remaining committed to our long-term bitcoin treasury strategy, reflecting our strong conviction in Bitcoin‘s future potential.”
Institutional demand starts on a positive note
Institutional investors' demand for Bitcoin continues to remain strong. According to SoSoValue data, the US spot Bitcoin Exchange Traded Funds (ETF) recorded an inflow of $425.45 million on Monday, continuing its inflow streak since Thursday. If these inflows continue and intensify, Bitcoin prices could rally further.
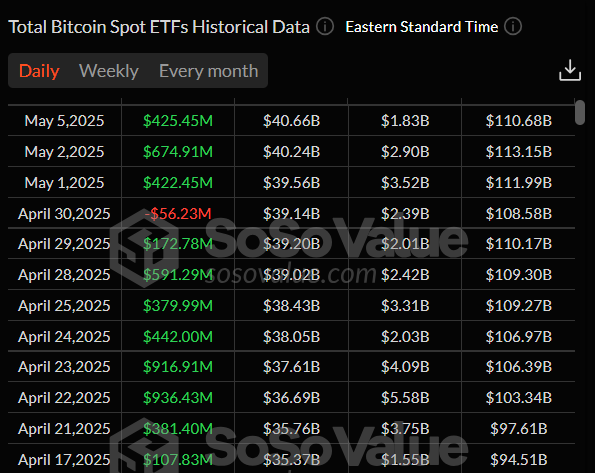
Total Bitcoin Spot ETFs daily chart. Source: SoSoValue
Bitcoin Price Forecast: BTC shows bearish signs on momentum indicators
Bitcoin price retested and was rejected around its daily resistance level of $97,700 on Friday. It declined nearly 3% over the next two days and stabilized at around $95,000 on Monday. At the time of writing on Tuesday, it hovers around $94,000.
If BTC continues to correct, it could extend the decline to retest its next key support level at $90,000.
The RSI on the daily chart reads 59 after being rejected from its overbought level of 70 on Friday, indicating fading bullish momentum. If the RSI slips below its neutral level of 50, it would suggest a bearish momentum and a fall in Bitcoin’s price. Moreover, the Moving Average Convergence Divergence (MACD) is about to flip a bearish crossover on Tuesday. If it occurs, it would give a selling signal and indicate a downward trend.
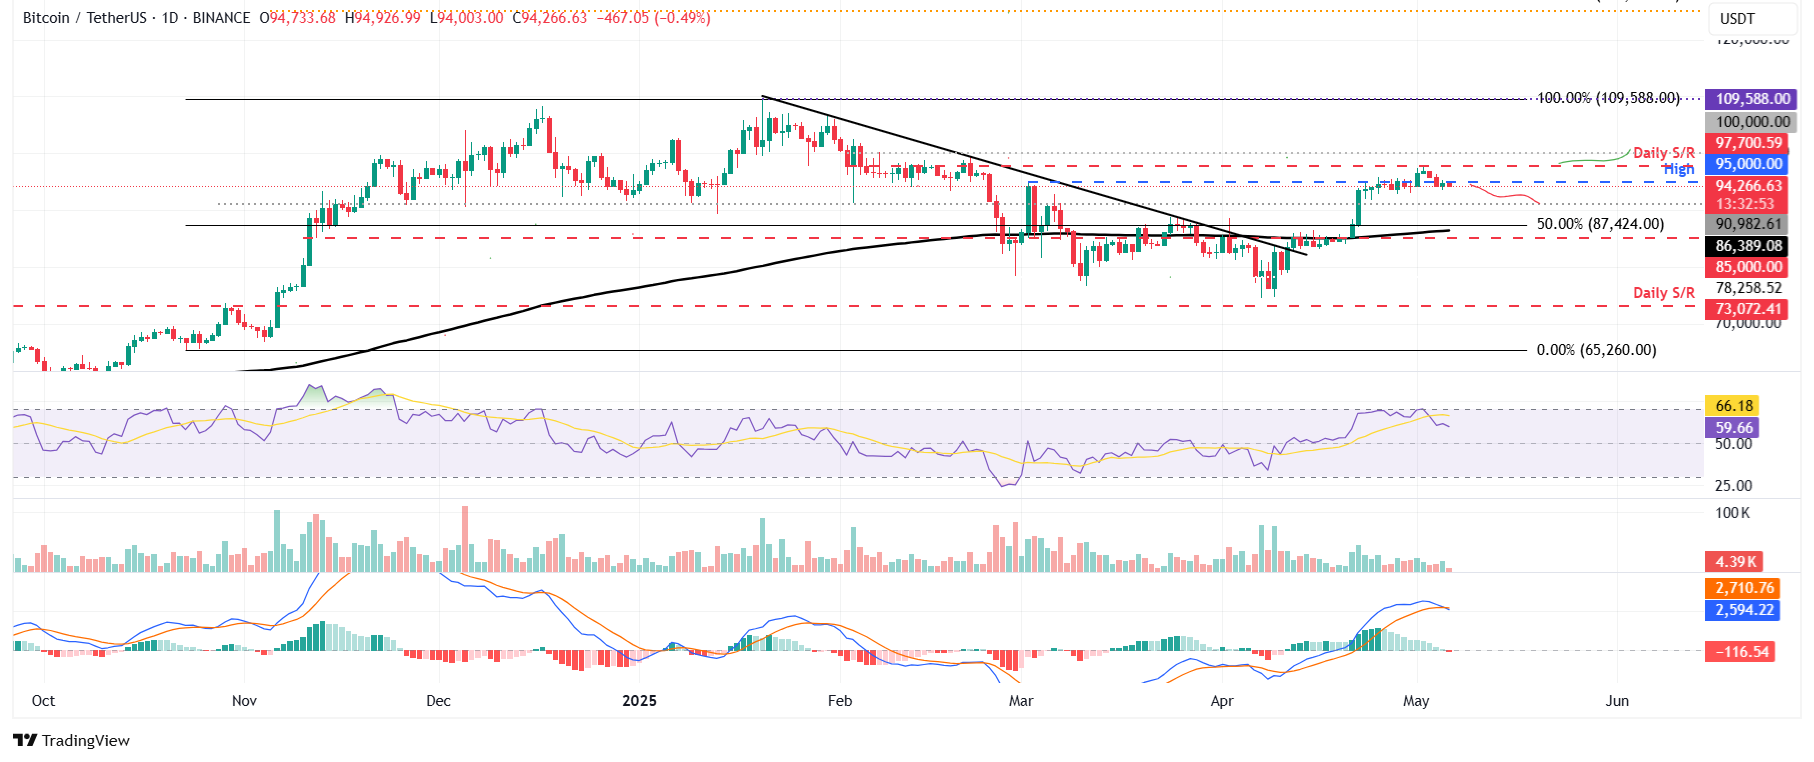
BTC/USDT daily chart
However, if BTC recovers and breaks above its daily resistance at $97,700, it could extend the gains to retest its psychological resistance at $100,000.
Cryptocurrency metrics FAQs
The developer or creator of each cryptocurrency decides on the total number of tokens that can be minted or issued. Only a certain number of these assets can be minted by mining, staking or other mechanisms. This is defined by the algorithm of the underlying blockchain technology. On the other hand, circulating supply can also be decreased via actions such as burning tokens, or mistakenly sending assets to addresses of other incompatible blockchains.
Market capitalization is the result of multiplying the circulating supply of a certain asset by the asset’s current market value.
Trading volume refers to the total number of tokens for a specific asset that has been transacted or exchanged between buyers and sellers within set trading hours, for example, 24 hours. It is used to gauge market sentiment, this metric combines all volumes on centralized exchanges and decentralized exchanges. Increasing trading volume often denotes the demand for a certain asset as more people are buying and selling the cryptocurrency.
Funding rates are a concept designed to encourage traders to take positions and ensure perpetual contract prices match spot markets. It defines a mechanism by exchanges to ensure that future prices and index prices periodic payments regularly converge. When the funding rate is positive, the price of the perpetual contract is higher than the mark price. This means traders who are bullish and have opened long positions pay traders who are in short positions. On the other hand, a negative funding rate means perpetual prices are below the mark price, and hence traders with short positions pay traders who have opened long positions.
Recommended Articles


