
US Dollar firm ahead of FOMC meeting minutes
- The US Dollar steadies with a bullish tone amid trade tensions and cautious sentiment ahead of the FOMC meeting minutes.
- US President Donald Trump confirms 50% tariffs on copper, warns that pharma imports could face 200% duty.
- The technical setup is turning cautiously bullish, but DXY must clear 97.80 to confirm an upside breakout.
The US Dollar (USD) maintains a firm footing on Wednesday, opening the day with a mildly bullish tone amid lingering tariff tensions and cautious market sentiment. Market participants remain on edge following US President Donald Trump’s latest tariff warnings and the extended deadline for reciprocal duties, which have kept risk appetite in check and underpinned demand for the USD across the board.
The US Dollar Index (DXY), which tracks the value of the Greenback against a basket of six major currencies, is up roughly 1.5% from its July 1 low at 96.38— its weakest level in over three years. At the time of writing, the index is hovering near 97.64 during European trading hours, as traders await the release of the Federal Open Market Committee (FOMC) meeting minutes later this Wednesday.
Trade tensions remain front and center after US President Trump escalated tariff threats during a Cabinet meeting at the White House on Tuesday. “Today we’re doing copper,” he said, announcing a steep 50% tariff on copper imports to boost domestic production of the metal and bring manufacturing jobs back to the United States (US). He also warned that tariffs on pharmaceuticals are “going to be tariffed at a very, very high rate, like 200 percent,” adding that the measure would be announced soon and take effect after at least a year.
Additionally, Trump reaffirmed his warning that BRICS nations will face an additional 10% levy. He stated there would be no exceptions, alleging that the BRICS is working to replace the US Dollar. He emphasized that the Greenback is "king" and any challenge to its dominance would incur a "big price." During the 17th BRICS summit in Rio de Janeiro, Brazil, leaders pushed back against rising US trade aggression, with Brazilian President Lula da Silva remarking, “The world does not want an emperor,” in a veiled swipe at Washington’s tariff tactics. The group voiced serious concerns over unilateral measures disrupting global trade and renewed calls to reduce dependence on the US Dollar.
Market Movers: Tariff tensions, Trump targets Powell and FOMC in focus
- US President Donald Trump announced on Truth Social that his administration will unveil new trade actions on Wednesday, stating, “We will be releasing a minimum of 7 Countries having to do with trade, tomorrow morning, with an additional number of Countries being released in the afternoon. Thank you for your attention to this matter!”
- Trump also doubled down on the August 1 tariff deadline and announced, “As per letters sent to various countries yesterday… TARIFFS WILL START BEING PAID ON AUGUST 1, 2025. There has been no change to this date, and there will be no change. In other words, all money will be due and payable starting AUGUST 1, 2025 — No extensions will be granted.”
- The US president cites a Council of Economic Advisers (CEA) study to claim that tariffs are not inflationary. Trump said a new study by the CEA, led by Dr. Stephen Miran, found that tariffs have had “ZERO IMPACT on Inflation.” He claimed import prices are dropping and tariffs are fueling a domestic economic boom, citing gains in factories, jobs and investment. He also took a direct shot at Federal Reserve Chair Jerome Powell, urging immediate action: “CUT INTEREST RATES JEROME — NOW IS THE TIME!”
- Copper futures surged over 17% to fresh record highs after the US president confirmed a 50% tariff on copper imports. His country currently imports nearly half of its annual copper needs — a reliance the Trump administration views as a strategic risk. Commerce Secretary Howard Lutnick stated, “The idea is to bring copper home... bring the ability to make copper... back home to America,” reinforcing the push to revive domestic production. The move is part of Trump’s broader “America First” agenda aimed at reshoring critical industries and boosting industrial jobs.
- According to the BBH MarketView report, the growth impact of the “One Big Beautiful Bill” (OBBB) will be partially offset by the economic drag from higher tariffs. The Tax Foundation estimates OBBB will increase GDP by about 0.2% in 2025, rising to 1.2% in 2026, up to a peak of 1.5% in 2028 before falling and stabilizing at a long-run GDP increase of 1.2%. The Yale Budget Lab estimates that all 2025 US tariffs, plus foreign retaliation, lower real GDP growth by 0.7 percentage points over 2025, and the level of real GDP remains persistently 0.38% smaller in the long run. It’s worth noting that the bulk of the US deficit blowout stems from the extension of the 2017 Tax Cuts and Jobs Act (TCJA), which does not qualify as additional fiscal stimulus.
- On Monday, Trump posted letters outlining trade tariffs for 14 countries, including Japan, South Korea, South Africa, Indonesia and Thailand, ranging from 25% to 40%.
- Investors are turning their attention to the Federal Reserve’s June FOMC meeting minutes, due later on Wednesday, for fresh clues on the monetary policy outlook. Markets will be paying close attention to how officials balance elevated inflation with growing external risks, including renewed tariff threats. With interest-rate-cut expectations still in flux, traders are looking for any sign of consensus around a possible move in September and whether trade tensions are starting to influence the Fed’s economic outlook.
Technical Analysis: US Dollar Index tests key resistance near 97.80 as recovery gains traction
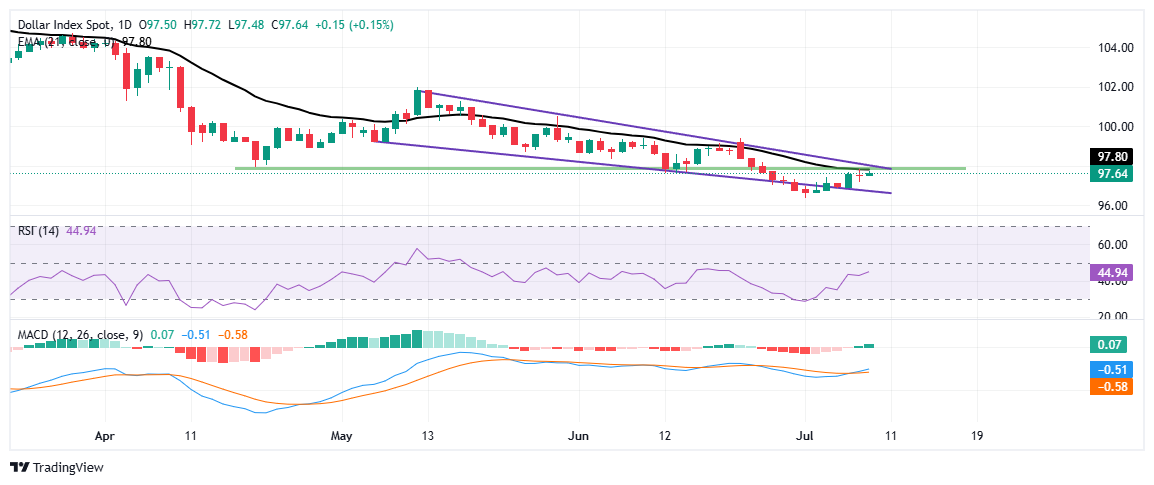
The US Dollar Index (DXY) is attempting to extend its rebound after marking a multi-year low on July 1. The index had briefly broken below a falling wedge pattern but has since climbed back inside the formation, suggesting a possible bear trap and signaling bullish intent. However, the DXY now faces a critical hurdle around the 97.70–97.80 support level, which has turned into resistance. This zone is further reinforced by the 21-day Exponential Moving Average (EMA) and the upper boundary of the wedge pattern, adding technical weight to the current stalling point.
Momentum indicators are gradually turning supportive. The Relative Strength Index (RSI) is trending higher, currently at 44.88, although it remains below the neutral 50 mark. Meanwhile, the Moving Average Convergence Divergence (MACD) has flipped into positive territory with a fresh bullish crossover, suggesting renewed bullish momentum. A daily close above 97.80 would confirm a breakout from near-term resistance and could pave the way for a move toward the next target at 98.40, the high of June 24. On the flip side, rejection here would keep the broader downtrend intact and shift focus back to the 97.00–96.80 support zone.
US Dollar PRICE Today
The table below shows the percentage change of US Dollar (USD) against listed major currencies today. US Dollar was the strongest against the Canadian Dollar.
| USD | EUR | GBP | JPY | CAD | AUD | NZD | CHF | |
|---|---|---|---|---|---|---|---|---|
| USD | 0.23% | 0.09% | 0.07% | 0.31% | 0.15% | 0.23% | 0.05% | |
| EUR | -0.23% | -0.13% | -0.17% | 0.07% | -0.04% | -0.01% | -0.07% | |
| GBP | -0.09% | 0.13% | 0.02% | 0.21% | 0.01% | 0.06% | -0.03% | |
| JPY | -0.07% | 0.17% | -0.02% | 0.20% | 0.08% | 0.14% | -0.02% | |
| CAD | -0.31% | -0.07% | -0.21% | -0.20% | -0.10% | -0.07% | -0.14% | |
| AUD | -0.15% | 0.04% | -0.01% | -0.08% | 0.10% | 0.03% | -0.02% | |
| NZD | -0.23% | 0.00% | -0.06% | -0.14% | 0.07% | -0.03% | -0.09% | |
| CHF | -0.05% | 0.07% | 0.03% | 0.02% | 0.14% | 0.02% | 0.09% |
The heat map shows percentage changes of major currencies against each other. The base currency is picked from the left column, while the quote currency is picked from the top row. For example, if you pick the US Dollar from the left column and move along the horizontal line to the Japanese Yen, the percentage change displayed in the box will represent USD (base)/JPY (quote).
Recommended Articles


