
Dow Jones Industrial Average hesitates as markets await trade clarity
- The Dow Jones remained stuck in place near 42,800 on Tuesday.
- The market rally fueled by optimism on continued tariff walkbacks may be slowing.
- US government budget battle continues as Trump administration struggles to muscle through large deficits.
The Dow Jones Industrial Average (DJIA) hit a pause in its recent bullish momentum, sticking close to the 42,800 region on Tuesday. Equities are taking a breather from their post-tariff recovery rally as investors await meaningful progress on trade talks.
The Trump administration is hitting a snag trying to get its budget muscled through Congress, complicating matters for President Donald Trump. Contrary to Trump’s campaign promises of eliminating the federal budget deficit within his first six months in office and eliminating the US federal debt load within “a couple of years”, his budget proposal, which he has coined his “big, beautiful bill” is expected to add nearly 4 trillion dollars to the US government’s debt pile over the next ten years. The tax and spending bill, which includes steep spending cuts to many federal services, but also includes severe reductions in government tax receipts, is facing stiff opposition from within Trump’s own Republican party as hardline contingents of representatives fundamentally disagree on aspects of the budget.
According to some hardline Republicans, the tax bill doesn’t include enough cuts to essential services spending. Other Republicans are upset that the budget does the exact opposite of Trump’s campaign platform of reducing government spending, and instead adds significantly to the US’s debt load.
Tariffs still loom large, but markets hopeful for a solution
The Trump administration has been pushing hard to announce a slew of trade deals ahead of the end of the 90-day reprieve from its own “reciprocal tariffs”. Market sentiment remains firmly pinned to hopes that the Trump administration will achieve what it needs in order to pull the barrel away from its own foot on global trade. Investment managers have noticed the lack of hard factors underpinning stock market bullishness, with US Bank Wealth Management investment director Bill Northey noting that markets are a state of “optimism without clarity”, stating:
I would say that the largest consideration is the fact that we’ve had the swoon related to the introduction of tariffs, the furious rally associated with the de-escalation of those tariff implementations, and now we’re awaiting clarification as many of these negotiations are ongoing.
Read more stock news: Home Depot advances as Q1 sales outperform consensus
Dow Jones price forecast
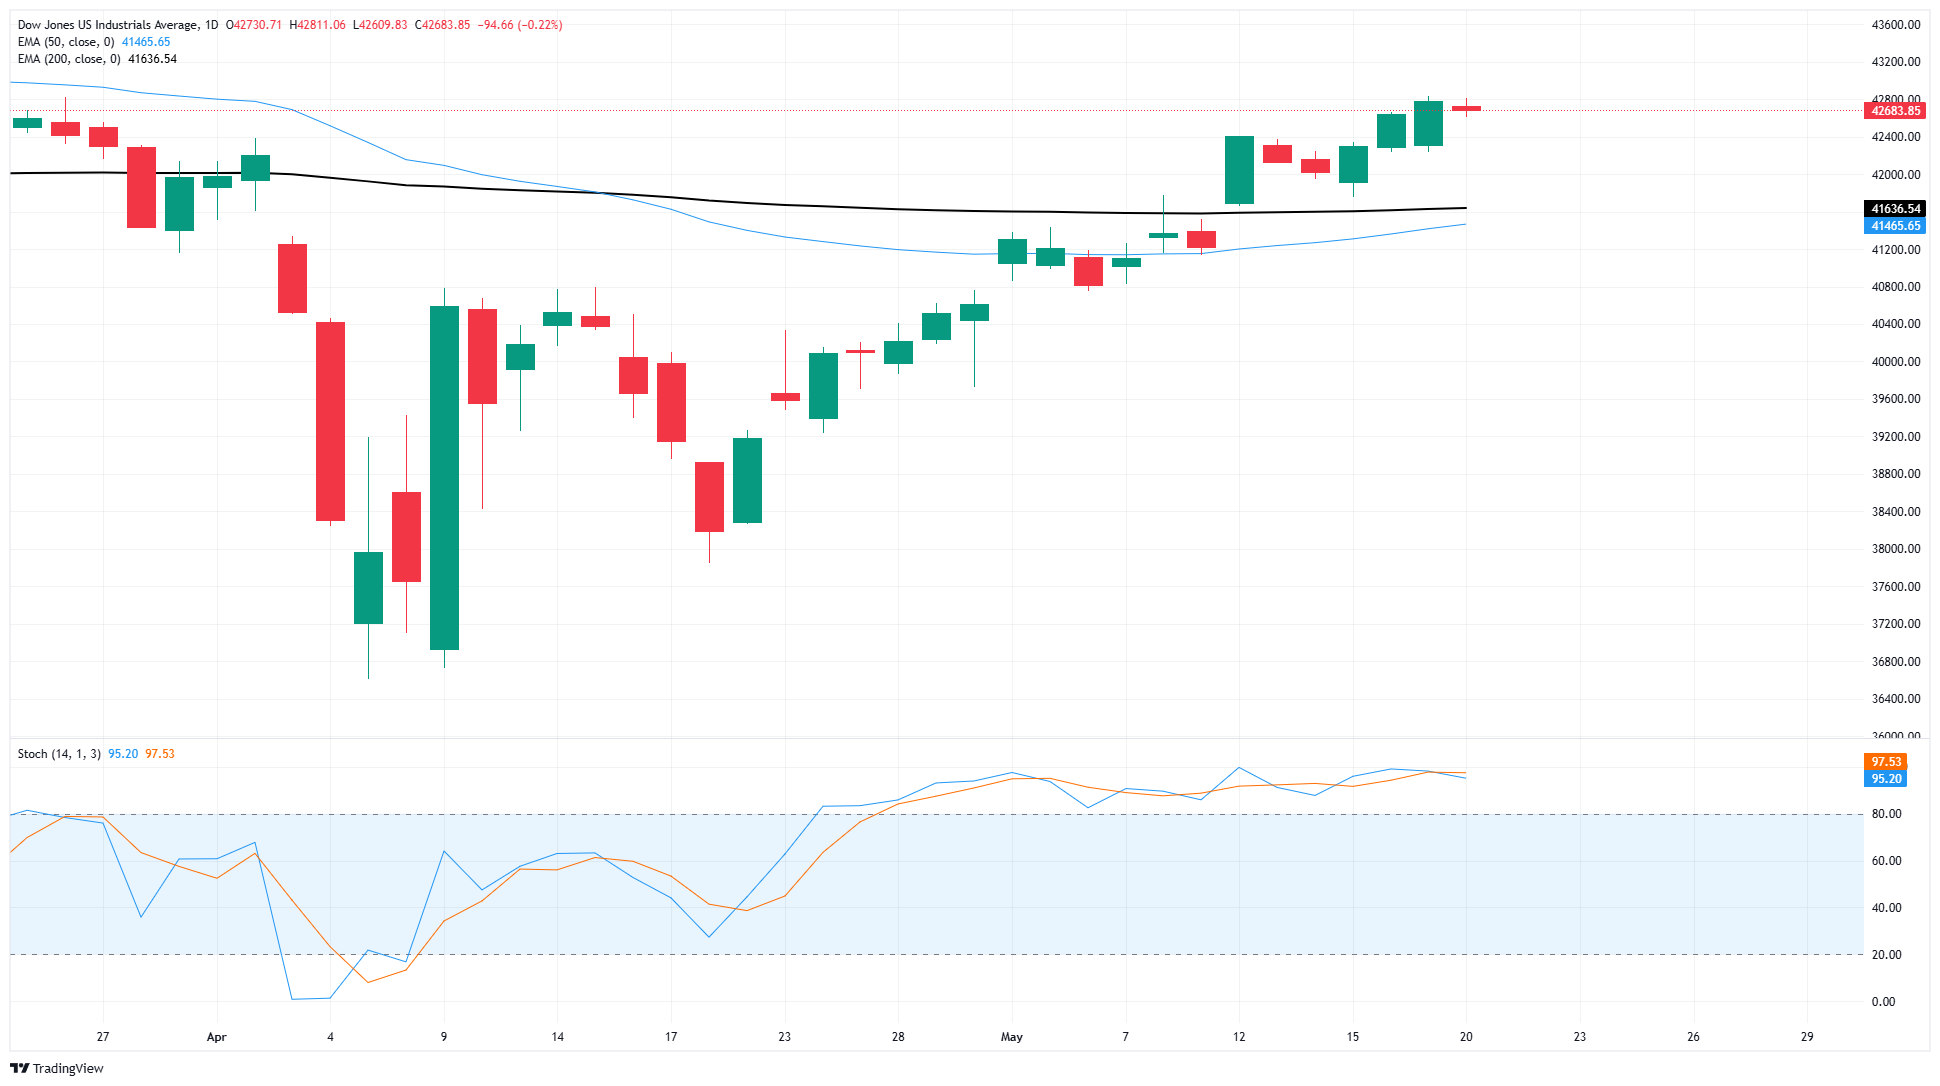
The Dow Jones Industrial Average hit a soft patch in momentum on Tuesday, holding steady after a three-day win streak. The Dow Jones remains firmly planted in bullish territory, having closed flat or higher for all but five of the last 19 consecutive trading sessions.
Despite the cooler market activity on Tuesday, the major equity index has closed higher for four straight weeks and is on track for a fifth consecutive bullish week following a strong start this week.. The Dow Jones has continued to climb above the 200-day Exponential Moving Average (EMA) around 41,500, and has increased almost 17% since April’s tariff-induced drop that saw the DJIA fall to 36,600.
Dow Jones daily chart
Dow Jones FAQs
The Dow Jones Industrial Average, one of the oldest stock market indices in the world, is compiled of the 30 most traded stocks in the US. The index is price-weighted rather than weighted by capitalization. It is calculated by summing the prices of the constituent stocks and dividing them by a factor, currently 0.152. The index was founded by Charles Dow, who also founded the Wall Street Journal. In later years it has been criticized for not being broadly representative enough because it only tracks 30 conglomerates, unlike broader indices such as the S&P 500.
Many different factors drive the Dow Jones Industrial Average (DJIA). The aggregate performance of the component companies revealed in quarterly company earnings reports is the main one. US and global macroeconomic data also contributes as it impacts on investor sentiment. The level of interest rates, set by the Federal Reserve (Fed), also influences the DJIA as it affects the cost of credit, on which many corporations are heavily reliant. Therefore, inflation can be a major driver as well as other metrics which impact the Fed decisions.
Dow Theory is a method for identifying the primary trend of the stock market developed by Charles Dow. A key step is to compare the direction of the Dow Jones Industrial Average (DJIA) and the Dow Jones Transportation Average (DJTA) and only follow trends where both are moving in the same direction. Volume is a confirmatory criteria. The theory uses elements of peak and trough analysis. Dow’s theory posits three trend phases: accumulation, when smart money starts buying or selling; public participation, when the wider public joins in; and distribution, when the smart money exits.
There are a number of ways to trade the DJIA. One is to use ETFs which allow investors to trade the DJIA as a single security, rather than having to buy shares in all 30 constituent companies. A leading example is the SPDR Dow Jones Industrial Average ETF (DIA). DJIA futures contracts enable traders to speculate on the future value of the index and Options provide the right, but not the obligation, to buy or sell the index at a predetermined price in the future. Mutual funds enable investors to buy a share of a diversified portfolio of DJIA stocks thus providing exposure to the overall index.
Recommended Articles


