
Ethereum Price Forecast: ETH falters before $3,800 as validator queue spikes to eighteen-month high
Ethereum price today: $3,610
- Ethereum validator queue surges to 633,000 ETH, suggesting profit-taking from investors.
- Ethereum ETFs post thirteen consecutive days of net inflows after pulling in $533 million on Tuesday.
- ETH eyes key support levels at $3,470 and $3,220 after failing to clear the $3,800 hurdle.
Ethereum (ETH) declined 4% on Wednesday, following a spike in its validator queue to an 18-month high of 633,000 ETH. The growing queue, coupled with a price decrease, reflects signs of profit-taking after a sustained uptrend.
Validator queue spike amid sustained ETH ETF inflows
The queue for staked coins attempting to exit validator responsibility on Ethereum has reached its highest level since January 2024. The queue, which began trending upward on July 16, surged to 633,000 ETH on Tuesday, with an average waiting time of 11 days, according to data from Validatorqueue.com.
The spike in exits follows ETH briefly reclaiming the $3,800 level after a 160% rise in the past three months, suggesting investors may be booking profits due to the strong uptrend.
Simultaneously, the number of coins in the entry queue has also remained at elevated levels, hovering around 365,000 ETH, indicating that more validators are also interested in joining the network. This is partly fueled by Ethereum treasury companies, with an increasing stash that's largely deployed toward staking. Public companies, including SharpLink Gaming (SBET), BitMine (BMNR), Bit Digital (BTBT), and BTCS, have grown their holdings to over 840,000 ETH in the past two months.
Meanwhile, US spot Ethereum exchange-traded funds (ETFs) recorded their thirteenth consecutive day of net inflows on Tuesday, attracting $533.87 million and pushing their cumulative flows to $8.32 billion, per SoSoValue data.
The sustained interest in ETH comes at a time when the crypto market has seen positive regulatory developments, including President Trump signing the GENIUS bill and the House passing the Crypto Market Structure CLARITY bill last week.
Ethereum Price Forecast: ETH falters before $3,800 resistance
Ethereum saw $155.95 million in futures liquidations over the past 24 hours, comprising $129.64 million and $26.31 million in liquidated long and short positions, respectively, according to Coinglass data.
After a failed attempt to break above the resistance near $3,800, ETH may be heading to test the support at $3,470. A firm move below $3,470 could see the top altcoin decline toward the $3,220 level, which is supported by the 20-day Exponential Moving Average (EMA).
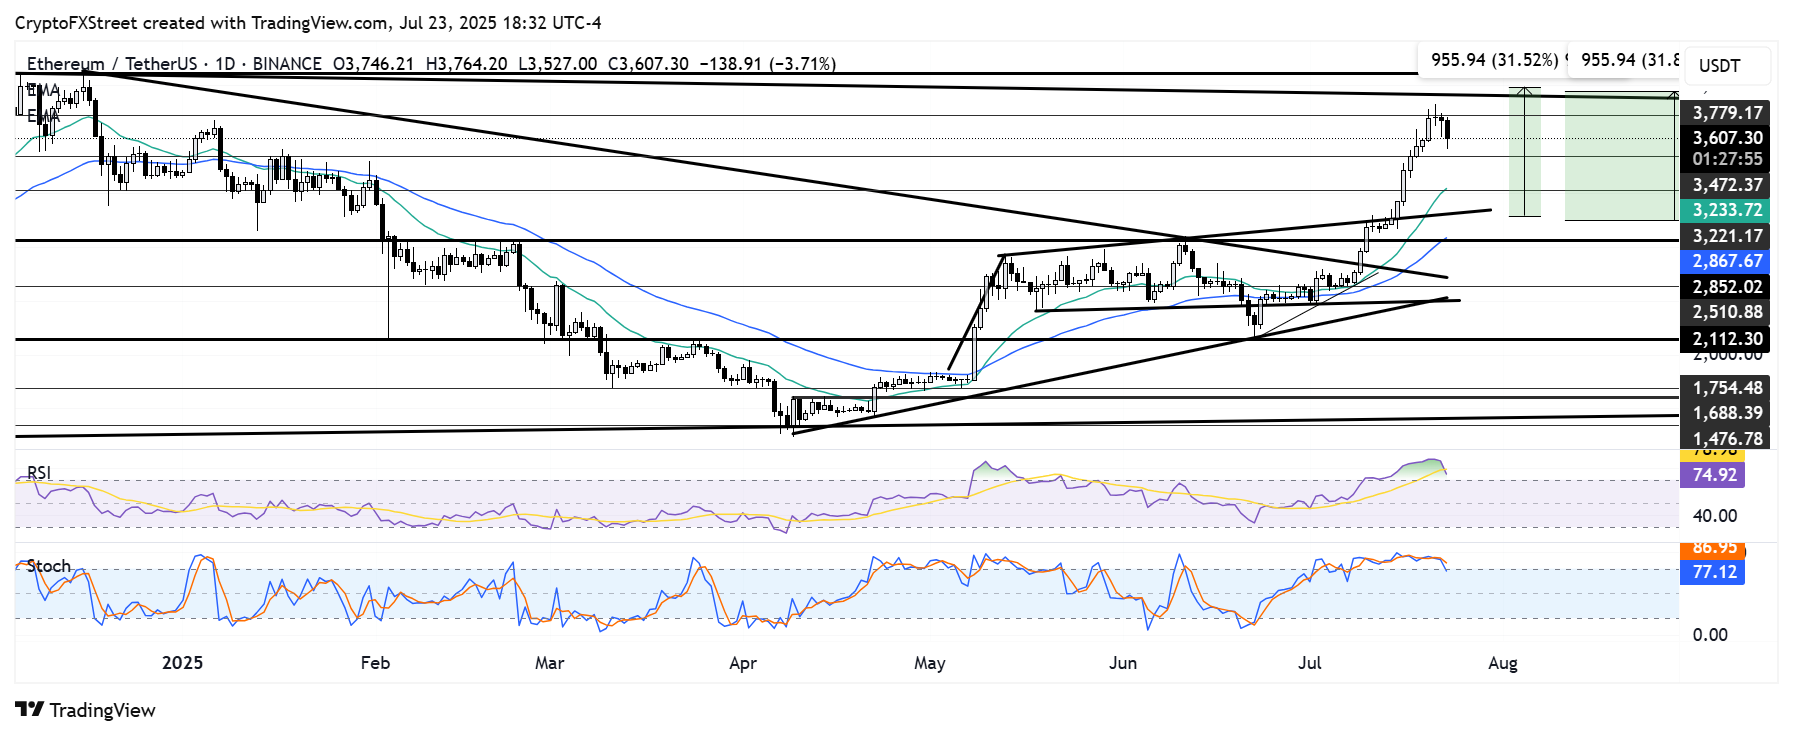
ETH/USDT daily chart
The decline follows the Relative Strength Index (RSI) moving below its yellow moving average line, suggesting a weakening of the recent upward momentum. The move is backed by the Stochastic Oscillator (Stoch) retreating from its overbought region, aligning with pullbacks that often occur after sustained strength. A decline in the RSI and Stoch below their neutral levels could accelerate bearish momentum.
On the upside, ETH has to reclaim and hold the $3,800 level as support to maintain its bullish trend.
Recommended Articles


