
Cardano's 44% July surge may continue as Foundation reports $660 million in ADA, BTC and cash holdings
- Cardano trades around $0.72 on Monday, buoyed by a 36% increase in futures Open Interest since July 1.
- The Cardano Foundation releases the network's financial insights, with $660 million in assets spread across ADA, BTC and cash.
- Over half of the Foundation's budget (51.4%) is allocated to adoption, with a focus on real-world assets and collaborations.
Cardano (ADA) is trading near intraday highs on Monday, following a 44% increase from July 1. The smart contracts token holds above pivotal support at $0.70 while trading at around $0.74 at the time of writing.
Based on key technical indicators, bulls have the upper hand, but caution is advised due to slightly overheated conditions that could encourage profit-taking.
Cardano Foundation shifts focus to real-world assets
The Cardano Foundation released its 2024 financial insights report on Thursday and highlighted key elements on Monday. According to a thread on X, the Foundation had approximately $660 million in assets as of December 31. Of this, 76.7% was allocated to ADA, 15% to Bitcoin (BTC) and 8.3% to cash and equivalents.
The real-world assets (RWAs) sector was the primary focus area, with the Foundation allocating more than half of its budget at 51.4% to related adoption. Operations cost took up 24.3%, education averaged 11.3%, with 13% going to operational resilience.
The Foundation emphasized that the RWAs category represents the organization's goal to expand Cardano's real-world utility across diverse sectors and stakeholders.
"In line with its central mission of bridging Cardano and the world by advancing it as a public digital utility, the Cardano Foundation has intensified its efforts in 2024 to enhance the diversity, quality, and quantity of blockchain activities," the Foundation said in a blog post.
Meanwhile, interest in Cardano remains steady, particularly in the derivatives market. CoinGlass data shines a light on the consistent rise in futures contracts' Open Interest (OI), which stands at $1.2 billion. With the volume rising 30% to $3.2 billion, traders have a strong bullish bias, betting on the ability of ADA price to extend the uptrend toward $1.00.
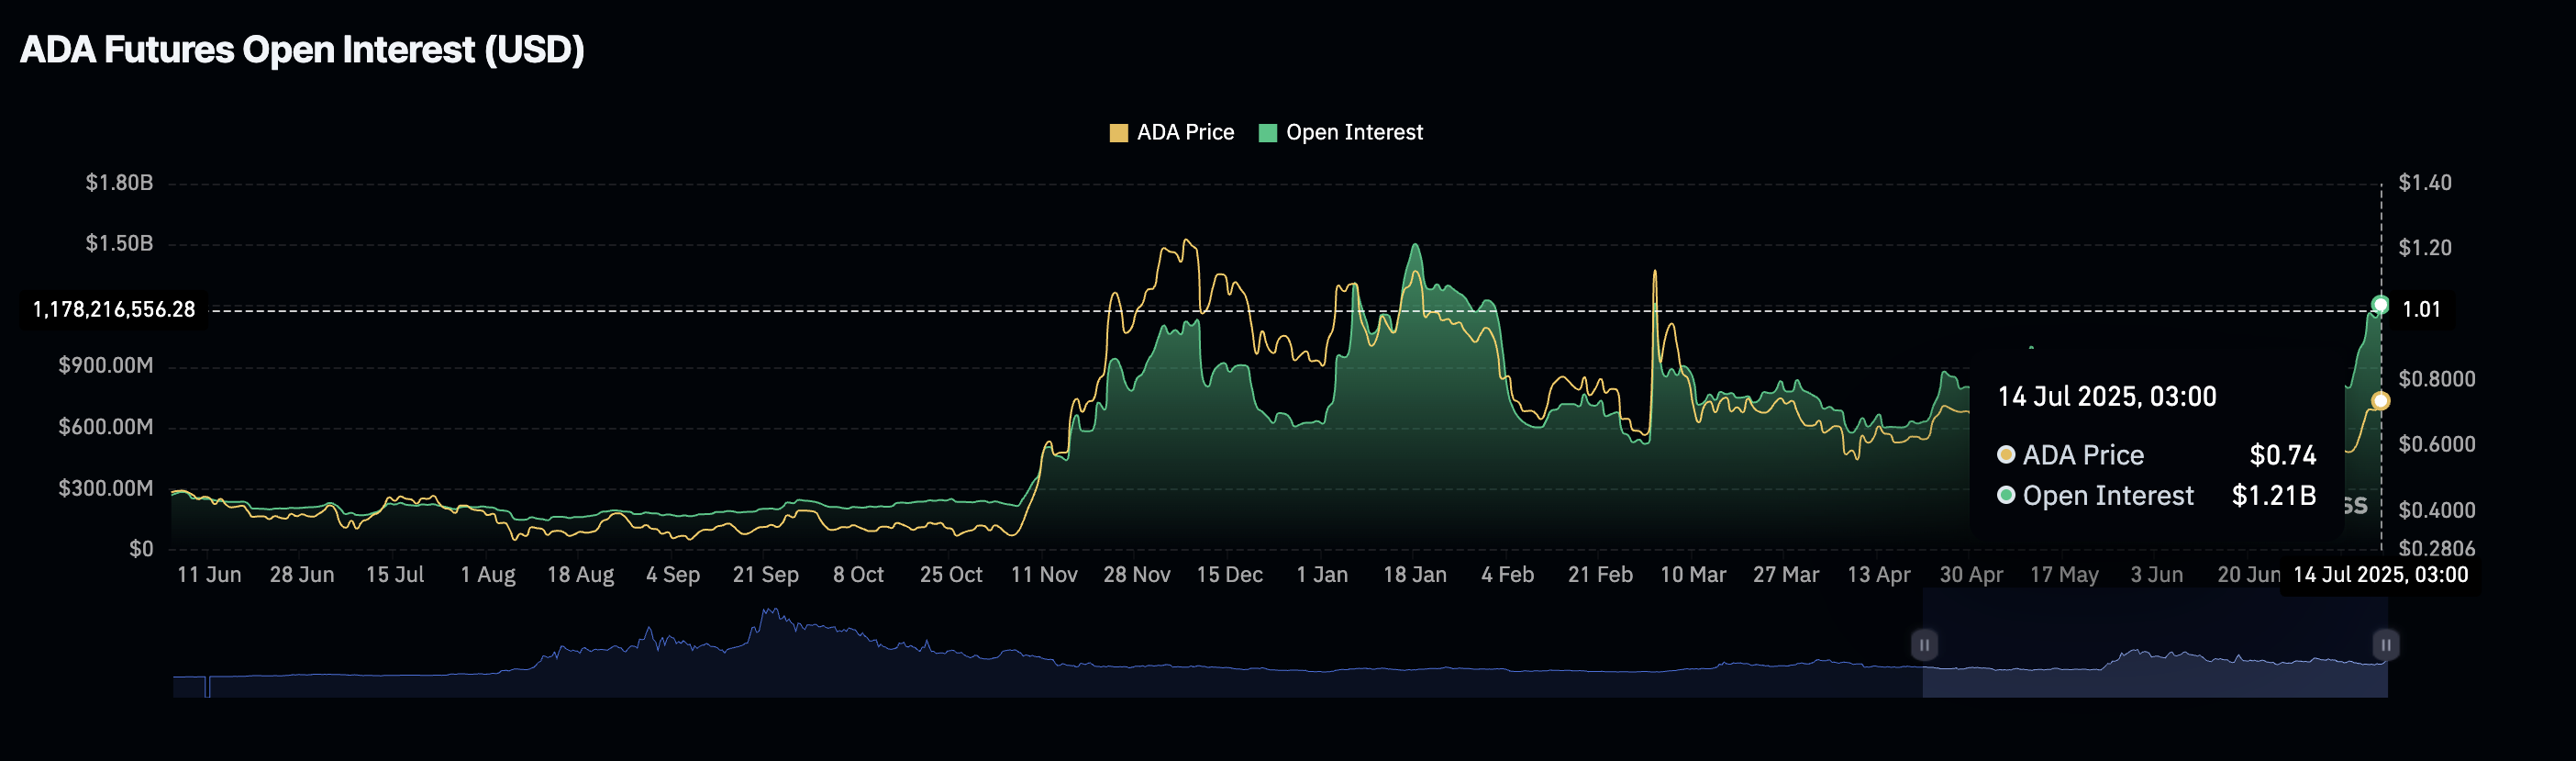
Cardano Futures Open Interest | Source: CoinGlass
Technical Outlook: Cardano bulls tighten grip
Cardano price sits above key moving averages, including the 50-day Exponential Moving Average (EMA) currently at $0.64, the 100-day EMA at $0.66 and the 200-day EMA at $0.68. These levels bolster the bullish structure but could also serve as tentative support areas in case the trend reverses.
The Money Flow Index (MFI) indicator is moving higher at 77, thus upholding the bullish outlook. In other words, risk-on sentiment is still high as investors send more money into ADA.
Traders will be on the lookout for a daily close above $0.74 resistance to ascertain the strength of the uptrend, targeting the next hurdles at $0.77, which capped price movement in May, and $1.02, a resistance tested in early March.
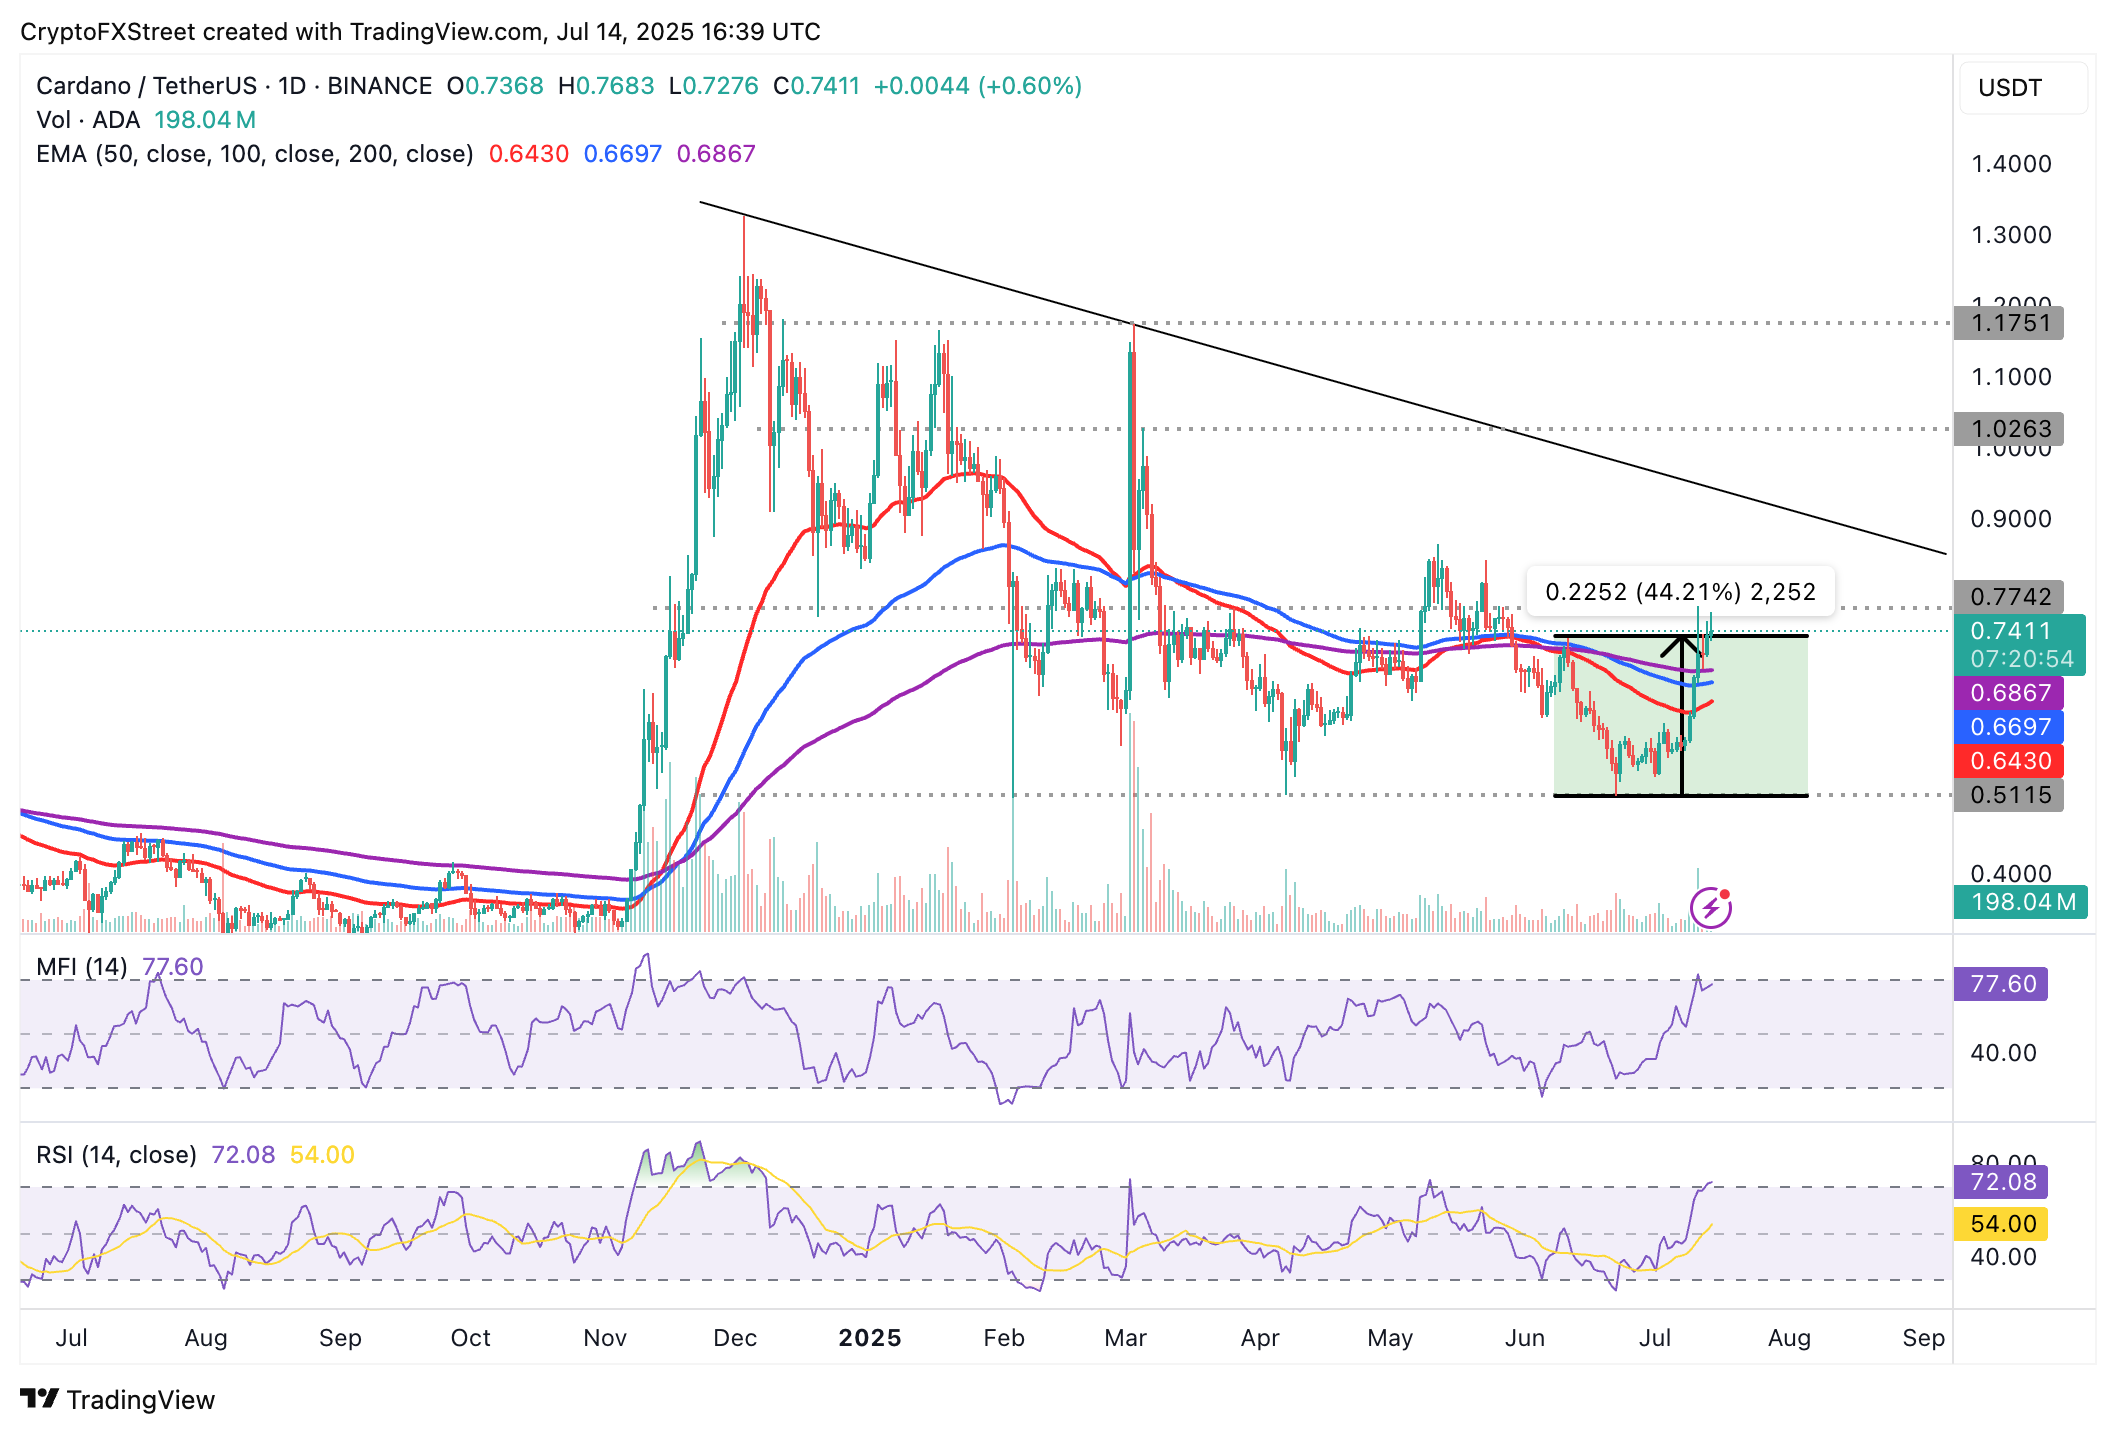
ADA/USDT daily chart
Still, the Relative Strength Index (RSI) is overbought at 71, a signal that downside risks cannot be ignored, especially if market dynamics change or investors take profit following the 44% increase in price since July 1.
Cryptocurrency prices FAQs
Token launches influence demand and adoption among market participants. Listings on crypto exchanges deepen the liquidity for an asset and add new participants to an asset’s network. This is typically bullish for a digital asset.
A hack is an event in which an attacker captures a large volume of the asset from a DeFi bridge or hot wallet of an exchange or any other crypto platform via exploits, bugs or other methods. The exploiter then transfers these tokens out of the exchange platforms to ultimately sell or swap the assets for other cryptocurrencies or stablecoins. Such events often involve an en masse panic triggering a sell-off in the affected assets.
Macroeconomic events like the US Federal Reserve’s decision on interest rates influence crypto assets mainly through the direct impact they have on the US Dollar. An increase in interest rate typically negatively influences Bitcoin and altcoin prices, and vice versa. If the US Dollar index declines, risk assets and associated leverage for trading gets cheaper, in turn driving crypto prices higher.
Halvings are typically considered bullish events as they slash the block reward in half for miners, constricting the supply of the asset. At consistent demand if the supply reduces, the asset’s price climbs.
Recommended Articles


