Ethereum Staking Hits 35M ETH: Is a Major Price Explosion on the Horizon?
Ethereum (ETH) has experienced a notable pullback after a brief period of upward momentum earlier this month. The asset, which surged past the $2,800 level in mid-June, has since declined by 8.7% over the past week, now trading at around $2,498.
This retreat follows broader market consolidation, as Ethereum struggles to maintain upward pressure despite strong on-chain activity.
Ethereum Staking and Accumulation Trends
While ETH’s price action has turned negative, on-chain indicators suggest a contrasting narrative of growing investor conviction. According to insights shared by on-chain analyst OnChainSchool via CryptoQuant’s QuickTake platform, Ethereum has set a new record in staking activity.

In the first half of June alone, more than 500,000 ETH were staked, pushing the total locked amount to over 35 million ETH. This growth in staked ETH not only reflects rising validator participation but also contributes to reducing the circulating supply, a dynamic that may influence future price movements.
The report also highlights a rise in accumulation addresses, wallets that have received ETH but have never transferred any out. These addresses now collectively hold 22.8 million ETH, another all-time high.
This trend is often interpreted as a sign of long-term holding behavior and suggests that certain investor cohorts are positioning themselves for future price appreciation rather than short-term gains.
Taken together, the record levels of staking and accumulation point toward an increasingly illiquid supply, which, if demand increases, could amplify upward price pressure.
Ethereum Hits ATH in Staking: Over 35 Million ETH Locked
“Alongside this, Accumulation Addresses (holders with no history of selling) have also reached an all-time high, now holding 22.8 million ETH.” – By @onchainschool
Read more
https://t.co/WYoX9qpODZ pic.twitter.com/6MAlK0sCfJ
— CryptoQuant.com (@cryptoquant_com) June 17, 2025
A Technical Look: Price Explosion on the Horizon?
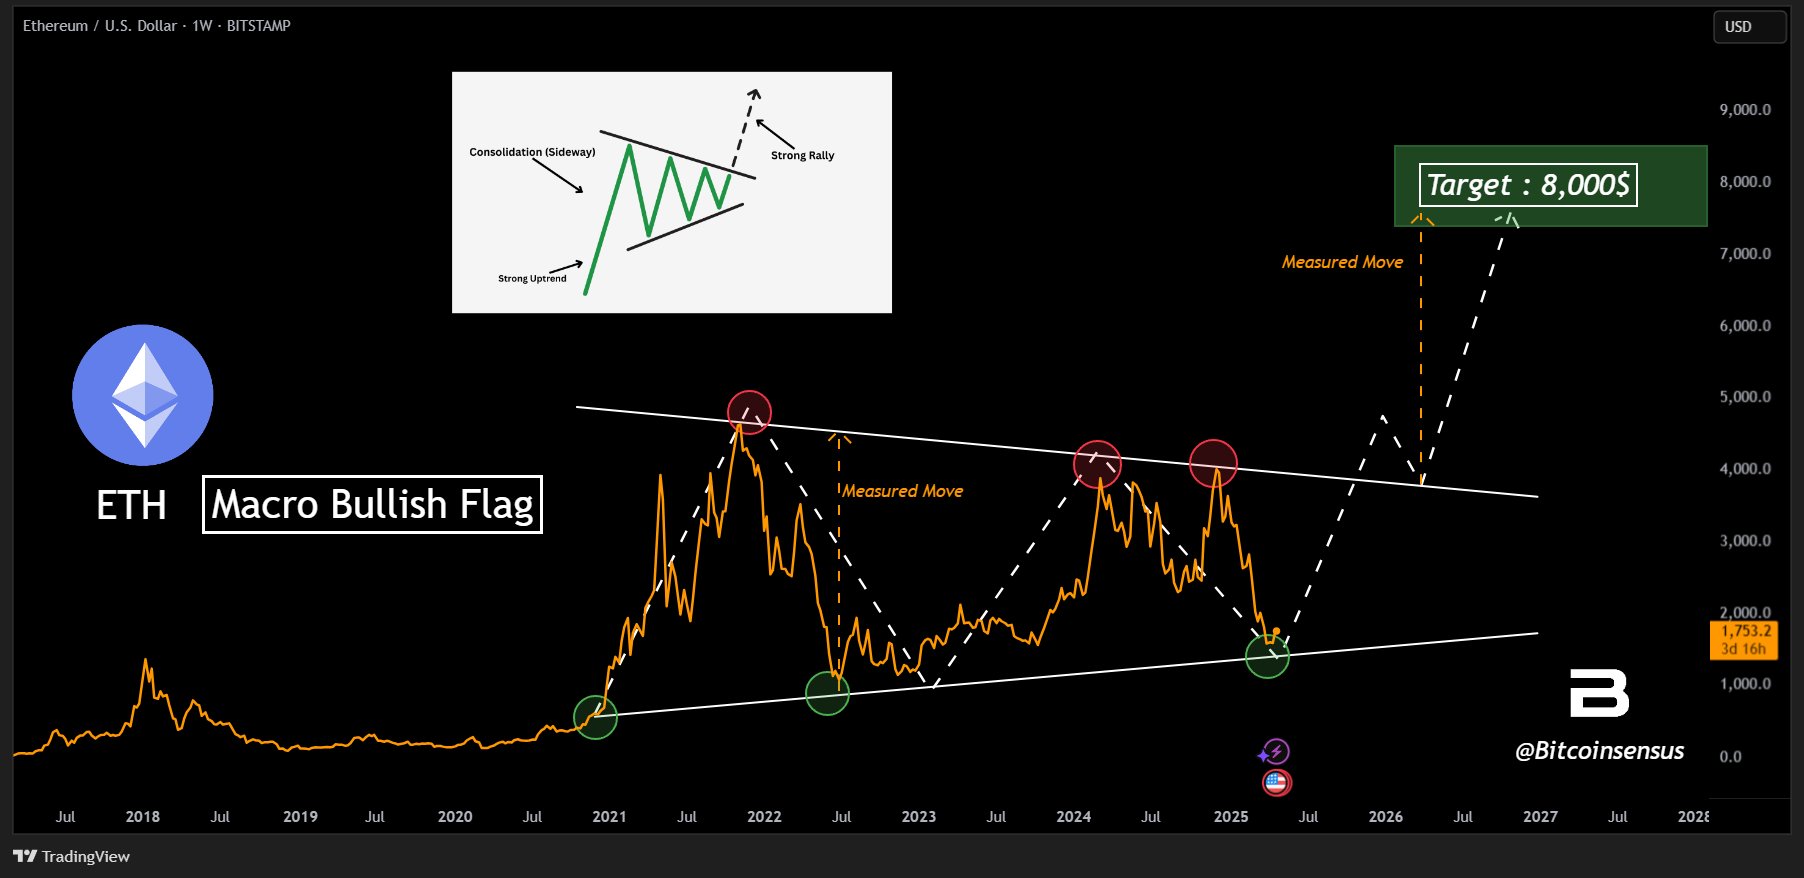
In addition to the on-chain data, market participants are also analyzing Ethereum from a technical perspective. A crypto analyst on X operating under the pseudonym “Bitcoinsensus” has drawn attention to a multi-year “bullish flag” pattern forming on ETH charts since 2021.

A bullish flag is a technical chart formation that typically follows a strong price move upward, marked by a period of consolidation in a downward-sloping channel. If the asset breaks out of the flag to the upside, it can signal a continuation of the prior bullish trend.
Bitcoinsensus suggests that if the pattern completes, Ethereum could target a move toward the $8,000 range. This potential breakout would depend on several factors, including macroeconomic sentiment, ETF flows, and on-chain fundamentals.
Featured image created with DALL-E, Chart from TradingView


