Stablecoin Exchange Inflows Plummet $61 Billion—Warning Sign for Bitcoin?
On-chain data shows the exchange inflows related to the stablecoins USDT and USDC have seen a sharp plunge. Here’s what this could mean for Bitcoin and other cryptocurrencies.
Stablecoin Exchange Inflows Have Dropped Below Yearly Average
In a new post on X, CryptoQuant author Axel Adler Jr has discussed about the latest trend in the Exchange Inflow of the top two stablecoins in the sector, USDT and USDC.
The “Exchange Inflow” refers to an on-chain indicator that keeps track of the total amount of a given asset that’s moving into the wallets associated with centralized exchanges.
Generally, investors may deposit their coins into these platforms when they want to trade them away, so a high value on the Exchange Inflow can indicate demand for swapping the cryptocurrency. For volatile assets like Bitcoin, this is something that can naturally be bearish for the price.
In the case of stablecoins, however, their price doesn’t see any impact from exchange deposits, since it always remains, by definition, stable around whatever fiat currency the asset is tracking.
That said, stablecoin inflows aren’t without consequence. Investors usually deposit these assets to swap into a volatile cryptocurrency of their choice. As such, coins like Bitcoin can see a bullish effect from an Exchange Inflow spike related to these fiat-tied tokens.
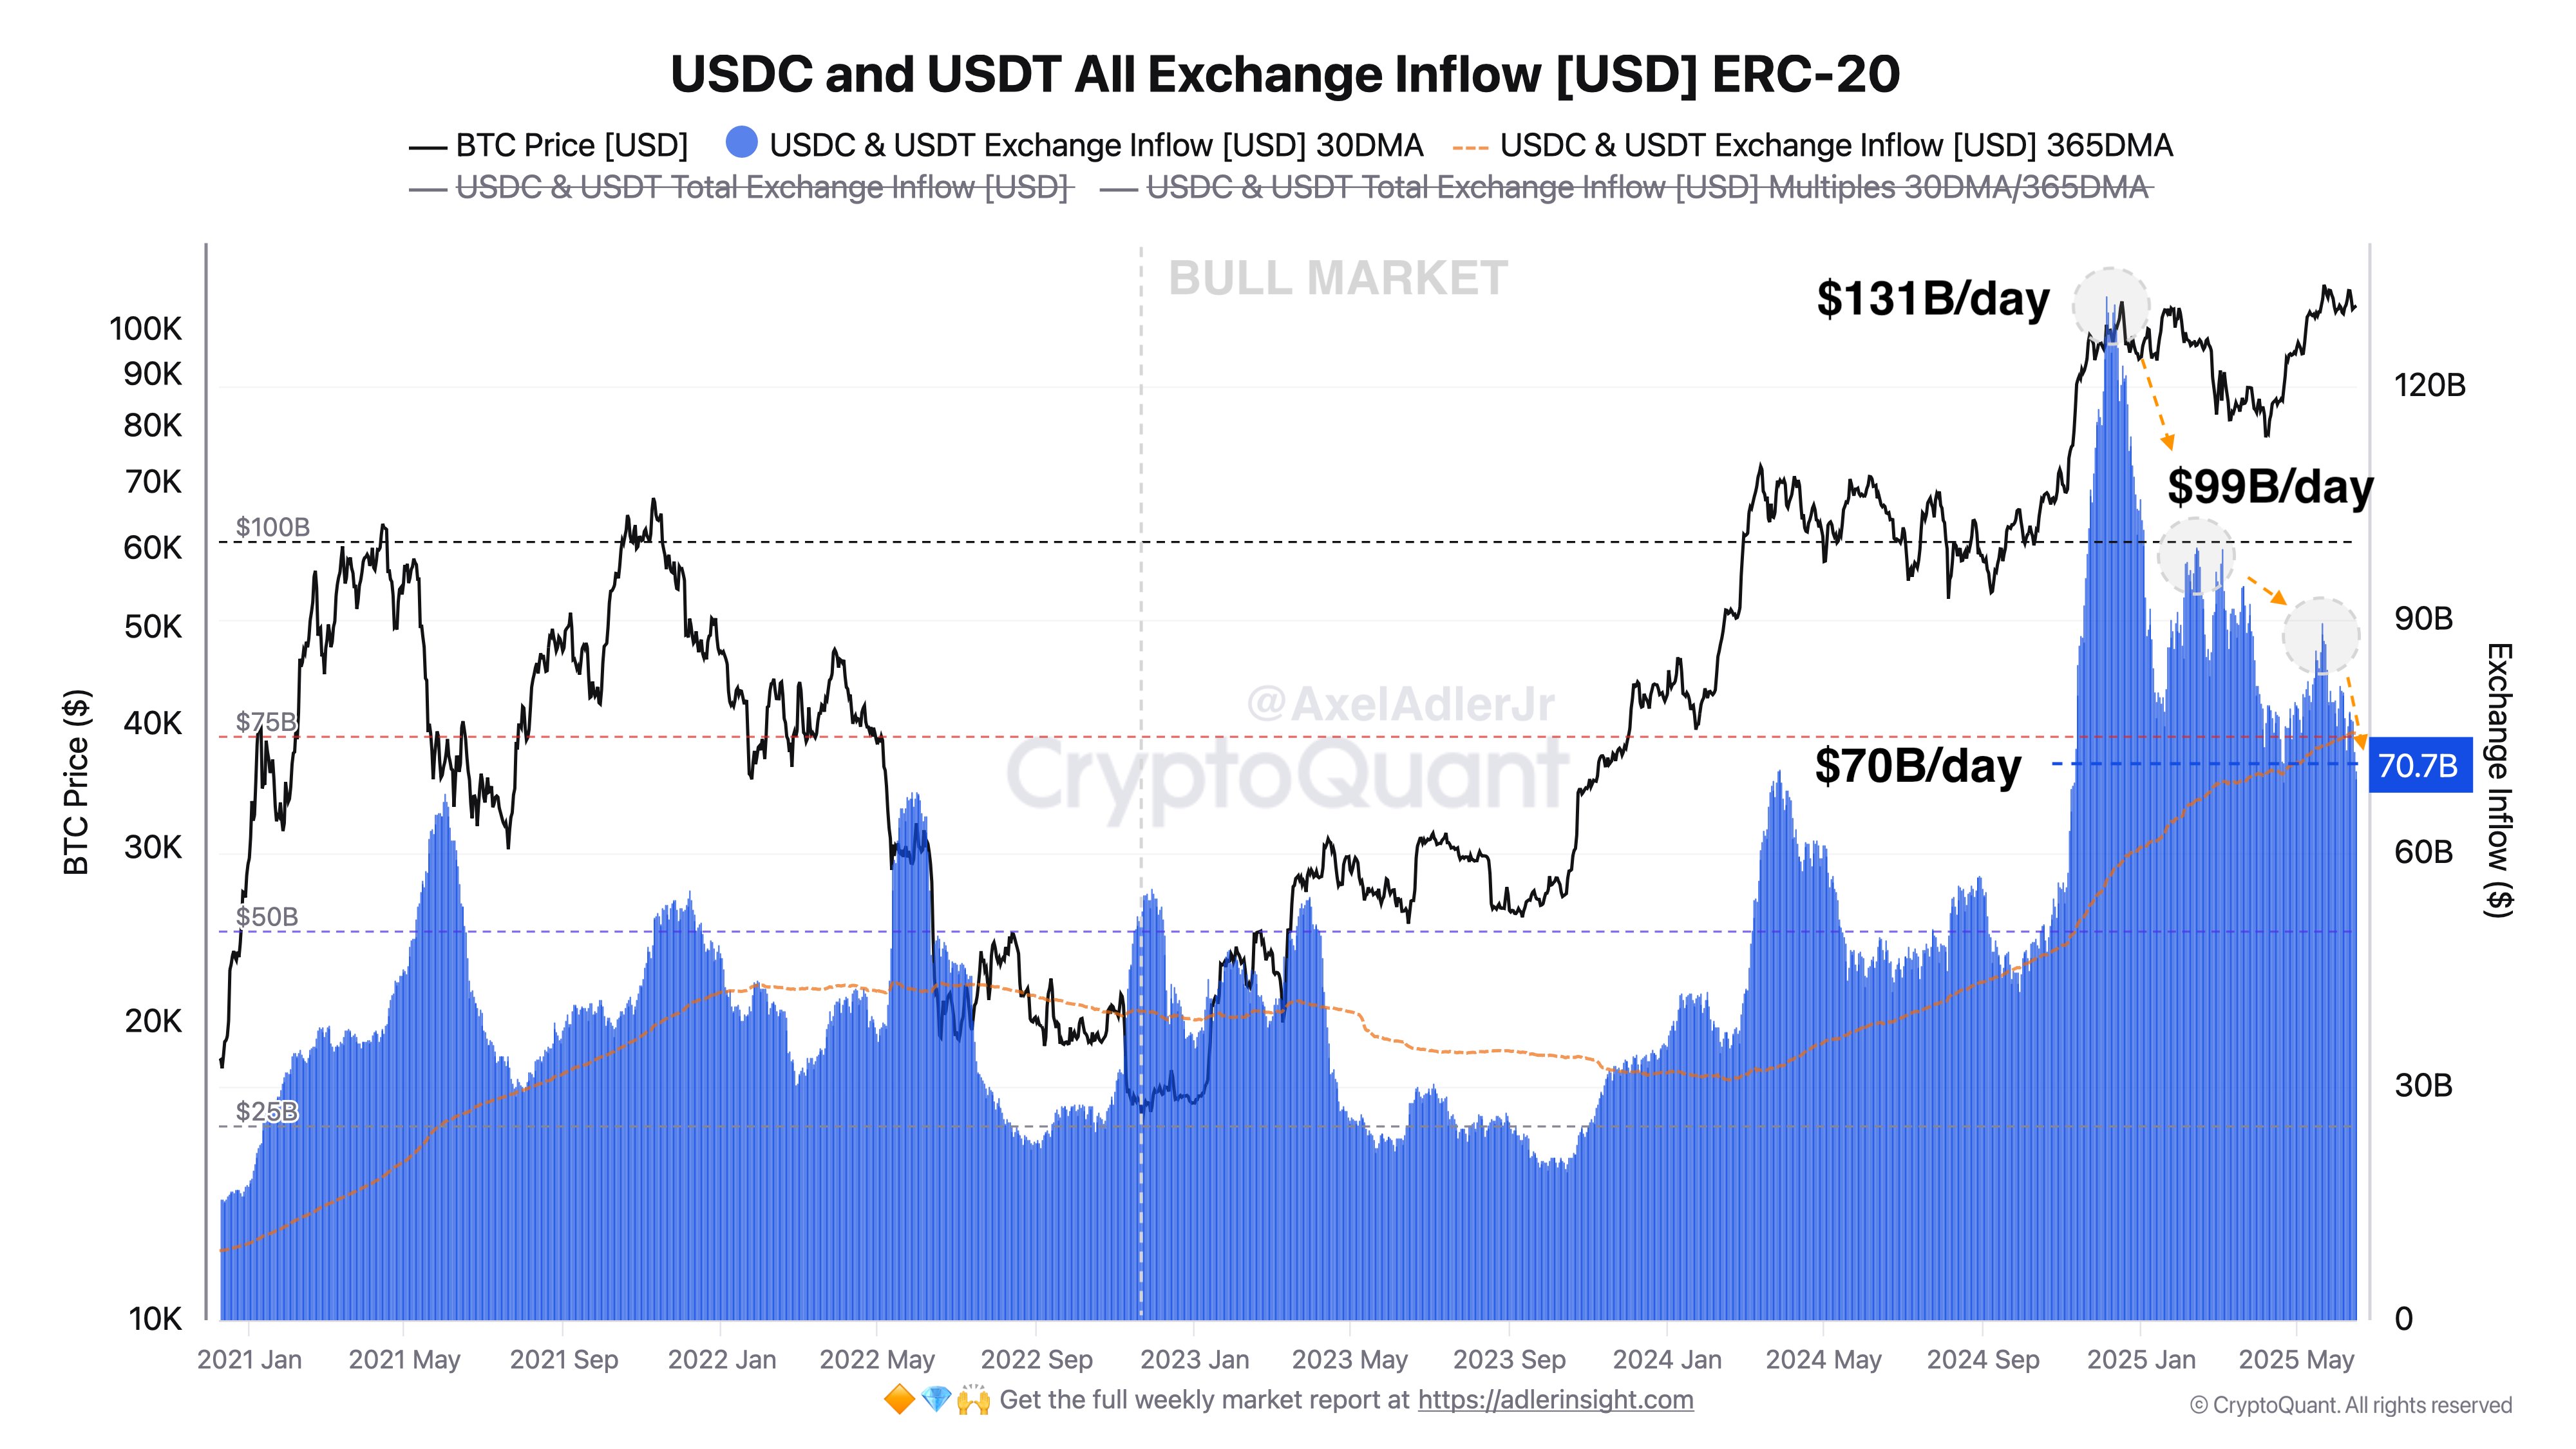
Now, here is a chart that shows the trend in the combined Exchange Inflow of the top two stablecoins, USDT and USDC, over the past few years:

As displayed in the above graph, the Exchange Inflow of USDT and USDC shot up to a very high value at the end of last year, a sign that the investors were making massive deposits of these stablecoins.
Alongside the spike in the indicator, the Bitcoin price observed a rally to a new all-time high (ATH), a potential sign that the stablecoin inflows may have helped provide the fuel for the run.
At the peak of the spike, the metric reached a value of $131 billion per day. From the chart, it’s apparent that since then, the indicator has been following a downward trajectory and today, its value has come down to $70 billion per day.
This represents a significant decline of $61 billion since the high. Though, while the indicator is indeed notably down compared to the peak, its current level is still high in the context of the wider cycle so far.
Naturally, if this drawdown in the stablecoin Exchange Inflow keeps up, it could potentially turn out to be a bearish sign for Bitcoin and other digital assets. That said, even though BTC went down earlier in the year, its price is still above the $100,000 mark right now, a possible sign that investors may simply be entering a phase of consolidation.
Bitcoin Price
Following a surge of about 2.5% over the last 24 hours, Bitcoin has managed to recover back to the $108,100 level.


