
FLOKI Price Forecast: Whale sell-off fuels downside risk as key resistance holds
- FLOKI price continues to trade in red on Thursday after facing rejection from a key level the previous day.
- Santiment’s Supply Distribution metric indicates that whale wallets are offloading FLOKI tokens, increasing the selling pressure.
- The technical outlook suggests a correction ahead, and bearish bets among traders are increasing.
FLOKI (FLOKI) extends its decline on Thursday, trading at around $0.000089 at the time of writing, after a nearly 6.3% drop the previous day following a rejection from a key level. On-chain data supports this fall as Santiment’s Supply Distribution metric indicates that whale wallets are offloading FLOKI tokens. Additionally, the technical outlook suggests a potential correction ahead, accompanied by rising bearish bets among traders.
FLOKI’s large wallets offload tokens
Santiment’s Supply Distribution data projects a bearish outlook for FLOKI as large wallets are offloading FLOKI tokens. The metric indicates that the whales holding between 10 million and 100 million FLOKI tokens (blue line) have decreased from 273.27 billion on Sunday to 271.46 billion on Wednesday and have been in a consistent downward trend since early June. Historically, when large wallets reduce exposure, it has caused an increase in selling pressure and a fall in FLOKI prices.
 [11-1749712897102.02.04, 12 Jun, 2025].png)
FLOKI Supply Distribution chart. Source: Santiment
Another bearish sign is Coinglass’s FlOKI long-to-short ratio, which stands at 0.74, approaching its lowest level in over a month. This ratio, below one, reflects bearish sentiment in the markets as more traders are betting on the asset price to fall.
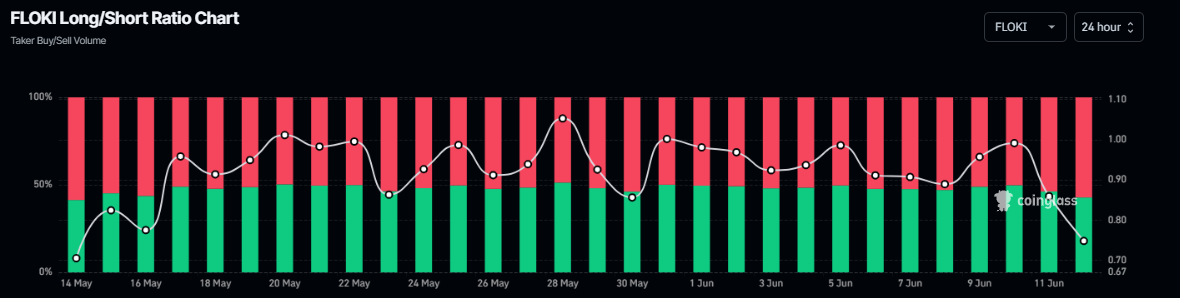
FLOKI long-to-short ratio chart. Source: Coinglass
FLOKI Price Forecast: Faces rejection from a key resistance level
FLOKI price broke below an ascending trendline (drawn by connecting multiple low levels since early April) on May 30 and declined 21% until June 5. However, the FLOKI price recovered from its recent decline and retested key resistance levels around $0.000097-$0.000098 on Tuesday.
This resistance area roughly coincides with multiple levels, making this a key reversal zone.
- Bearish order block area on May 29, extending from $0.000100 to $0.000097. A bearish order block is an area where market participants, such as institutional traders, have placed huge sell orders.
- The peak of the volume profile is around $0.00010, where traders have previously traded with high volume.
- The 50% Fibonacci retracement, drawn from the May 12 high of $0.000123 to the June 5 low of $0.000074, at $0.000098.
- The previously broken ascending trendline.
On Wednesday, FLOKI faced rejection around the above-mentioned resistance level and declined 6.26%. At the time of writing on Thursday, it continues to trade down at around $0.000089.
If FLOKI continues its correction, it could extend the decline to retest its June 5 low of $0.000074.
The Relative Strength Index (RSI) indicator on the daily chart reads 49, slipping below its neutral level of 50, indicating bearish momentum gaining traction.
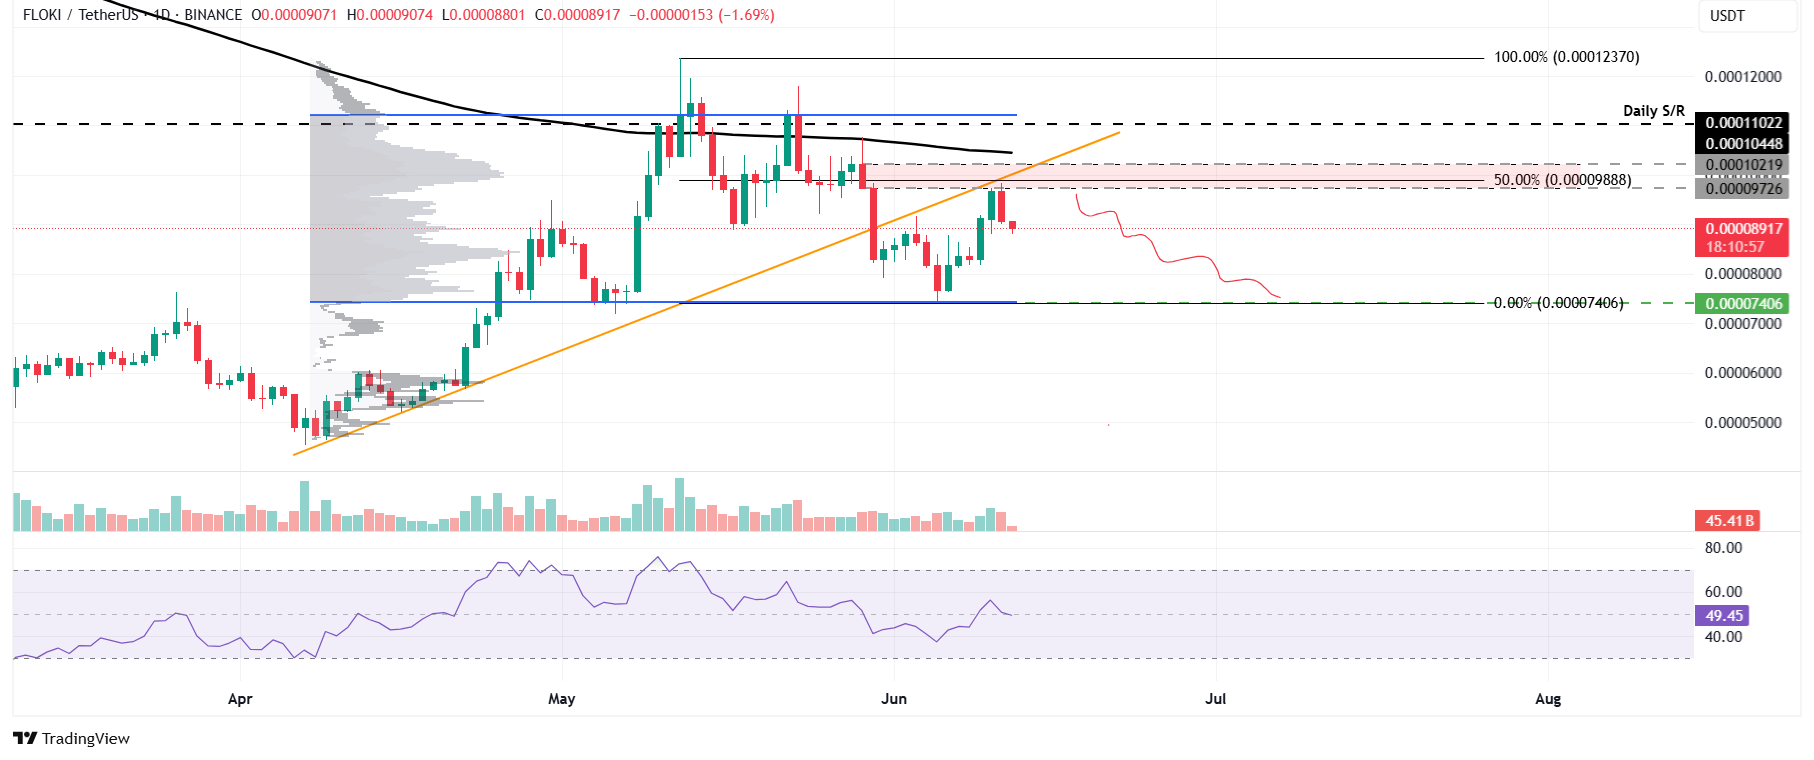
FLOKI/USDT daily chart
However, if FLOKI recovers and closes above the 200-day Exponential Moving Average (EMA) at $0.000104, the bearish thesis would be invalidated. Such development could extend the recovery toward its next daily resistance at $0.000110.
Recommended Articles


