
Bitcoin Shorts Getting Wiped—Fuel For Rally Or Top Signal?
Data shows the Bitcoin short liquidations have been notably outpacing the long ones recently. Here’s whether this is something alarming or not.
Bitcoin Liquidation Oscillator Is In Negative Territory Right Now
In a new post on X, CryptoQuant author Axel Adler Jr has provided an overview of the futures market from the perspective of the liquidations dominance oscillator. “Liquidation” refers to the forceful closure that any open contract undergoes after it has amassed losses of a certain degree (as defined by its platform).
Naturally, this happens following a decline in the price for the long contracts (bullish bets), while after a surge in the case of the short ones (bearish bets). The risk of these contracts being liquidated goes up the more leverage that the investor has opted for.
The liquidations dominance oscillator compares long and short liquidations occurring across the sector and represents their balance as an oscillator around the 0% mark.
Below is the chart for the oscillator shared by the analyst that shows the trend in its 30-day moving average (MA) value over the last couple of years.

As is visible in the graph, the 30-day MA of the Bitcoin liquidations dominance oscillator has had a negative value recently, which suggests the shorts have been observing more liquidations than the longs.
This dominance of short liquidations has come as the cryptocurrency’s price has rallied to a new all-time high (ATH). From the chart, it’s apparent that a similar trend was also witnessed during past rallies.
Generally, mass liquidation events involving shorts help support the upside. As the analyst has highlighted in the graph, however, an extreme level of dominance from the short liquidations implies overheated conditions for Bitcoin, with its price attaining a top alongside it.
At present, though, the indicator is sitting at ‘just’ -11.5%. The rally at the end of 2024 saw the metric hit a peak negative value of -16.5%. Similarly, it reached -19% in April 2024 and -24% in January 2023.
“Thus, despite the recent pullback, bullish momentum remains intact – without the kind of “overheating” that could trigger sharp local reversals,” notes the analyst.
In some other news, the on-chain analytics firm Glassnode has revealed in an X post how the Bitcoin network has skewed toward institutional involvement during the past six months.
The indicator shared by Glassnode is the Unspent Realized Price Distribution (URPD), which tells us about how much of the cryptocurrency’s supply was last purchased at what price levels.
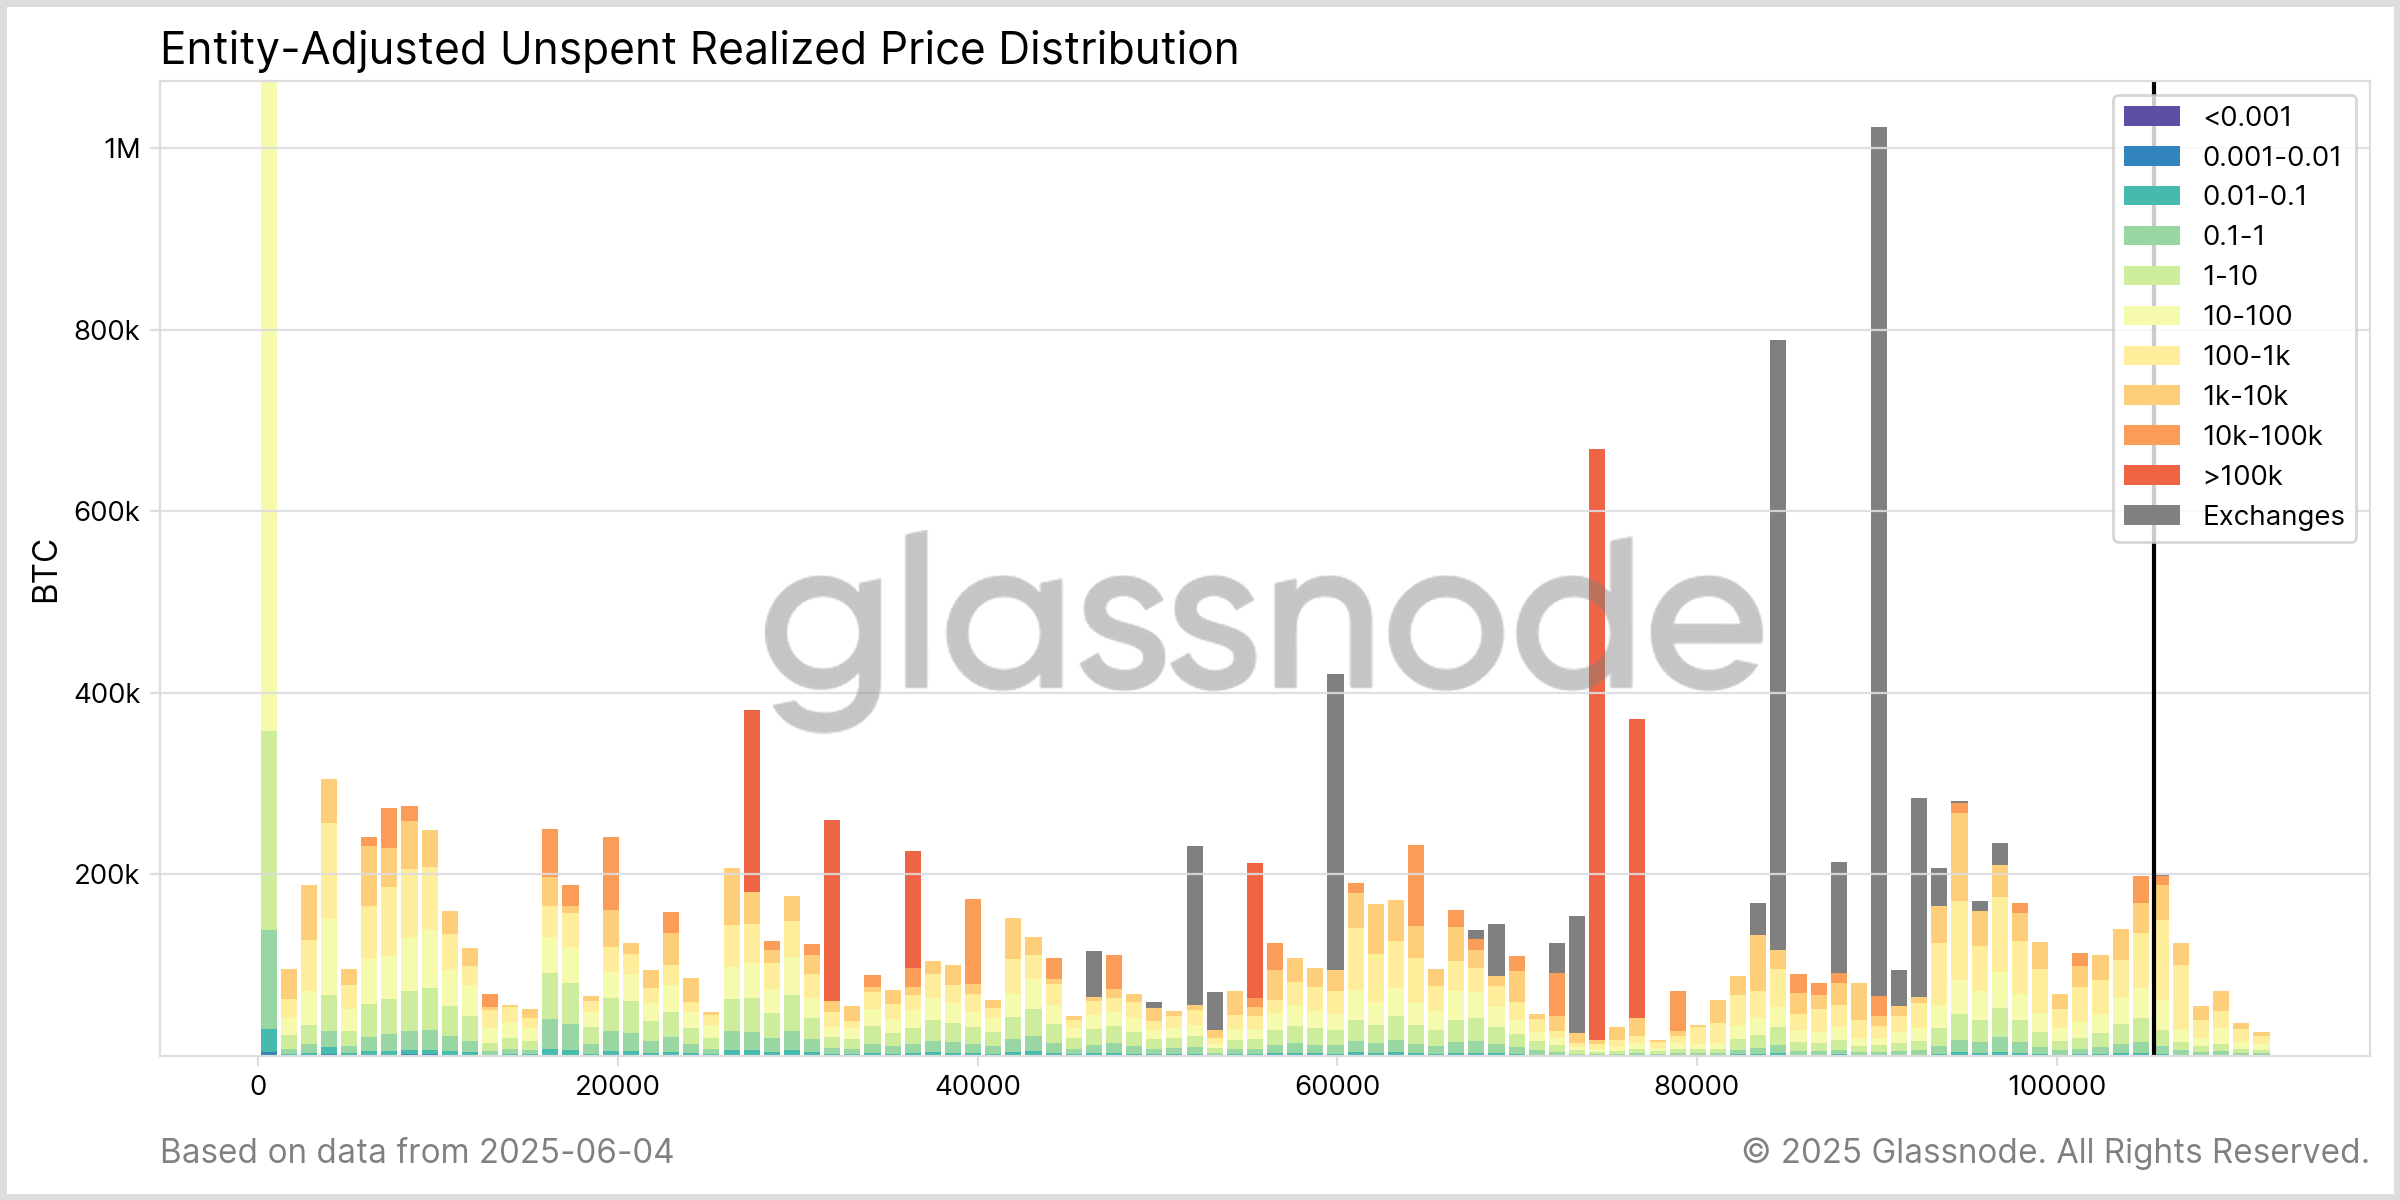
As the analytics firm explains,
Above $90k, activity is led by 100–10k $BTC holders. Wallets >100k $BTC are most concentrated at $74k–76k, large whales (10k–100k) at $78k–79k, $85k–90k, and near current levels.
BTC Price
Bitcoin has gone stale during the past few days as its price is still trading around the $104,800 mark.
Recommended Articles


